|
|
|
报告导航:研究报告—
制造业—化工
|
|
2014-2016年中国结构胶粘剂行业研究报告 |
 |
字数:4.0万 |
页数:137 |
图表数:127 |
|
中文电子版:8500元 |
中文纸版:4250元 |
中文(电子+纸)版:9000元 |
|
英文电子版:2400美元 |
英文纸版:2600美元 |
英文(电子+纸)版:2700美元 |
|
编号:PQ008
|
发布日期:2014-06 |
附件:下载 |
 |
|
|
结构胶粘剂属于胶粘剂产品中的高强度、高性能胶,主要包括有机硅结构胶、环氧树脂胶、聚氨酯胶等,广泛应用于建筑、汽车、风电、光伏、电子电器等领域。
近几年来,随着中国房地产、汽车、光伏、电子电器等行业发展,中国结构胶粘剂市场规模增长较快。2013年中国结构胶粘剂产量约58.93万吨,销售收入151亿元。其中,有机硅结构胶仍是中国结构胶粘剂市场最大的细分品种, 2013年其产量占比约为44.7%。
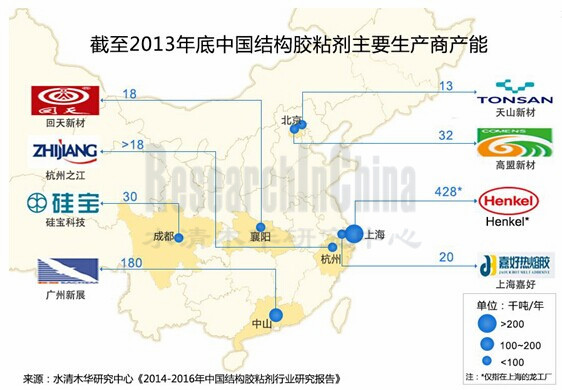
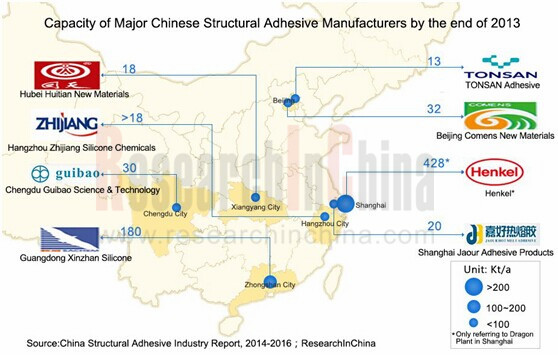
H.B. Fuller、Henkel、3M、Sika、Cytec Industries等全球知名胶粘剂生产商由于其产品结构齐全、技术领先,占据着中国结构胶粘剂市场大部分份额。并且这些跨国企业仍然在加大在华投资,以扩大其市场占有率。如Henkel,2013年其在上海建成了产能42.8万吨/年的全球最大工业胶粘剂工厂(市场定位于包括中国在内的亚太地区的汽车和各种消费品领域胶粘剂需求)。
中国本土结构胶粘剂企业大多成立于20世纪80-90年代,尽管发展较晚,但发展较快,并已在某些细分市场形成了同外资相抗衡的优势企业如回天新材、康达新材、硅宝科技、高盟新材、杭州之江、广州新展等。
有机硅结构胶细分市场:随着硅宝科技、广州新展、杭州之江等行业领导者产能迅猛扩张,目前中国有机硅结构胶行业竞争愈加激烈。
2013年3月,广州新展新增有机硅密封胶产能12万吨/年,实现总产能18万吨/年;杭州之江有望于2014年下半年形成有机硅密封胶产能8-10万吨/年;硅宝科技计划于2015年将有机硅室温胶产能增至8万吨/年,较2013年新增5万吨/年。
聚氨酯结构胶细分市场:高盟新材是中国复合聚氨酯胶粘剂细分领域龙头企业,2008年以来其产销率一直保持在95%以上,2013年其产销率更是达到101.1%。目前,公司也在积极复合聚氨酯胶粘剂产能扩张,预计2014年底公司有望实现复合聚氨酯胶粘剂产能4.2万吨/年。
《2014-2016年中国结构胶粘剂行业研究报告》主要包括以下几个方面:
 中国结构胶粘剂行业运行环境、总体现状、市场供需、竞争格局及发展预测等; 中国结构胶粘剂行业运行环境、总体现状、市场供需、竞争格局及发展预测等;
中国结构胶胶粘剂下游建筑、汽车、风电光伏电子电器等市场需求分析,有机硅、环氧树脂、聚氨酯等结构胶粘剂细分市场分析;
全球17家、中国大陆及台湾16家主要结构胶粘剂生产商的运营情况、胶粘剂业务、在华发展、发展趋势等。
Structural adhesive is a sort of adhesive with high strength and high performance among adhesives, consisting mainly of silicone structural adhesive, epoxy structural adhesive, polyurethane adhesive, etc.
Along with the development of industries such as real estate, automobile, photovoltaic (PV) and electronics & appliances in China over the recent years, Chinese structural adhesive market size grows rapidly. In 2013, China’s output of structural adhesives approximated 589.3kt and achieved the revenue of RMB15.1 billion, among which the output of silicone structural adhesive, being still the largest segmented product category in Chinese structural adhesive adhesive market, accounted for roughly 44.7% in 2013.
The world’s renown adhesive producers such as H.B. Fuller, Henkel, 3M, Sika, and Cytec Industries sweep the most shares of Chinese structural adhesive market due to their complete product mix and advanced technologies. Additionally, those multinational corporations still have been aggressively increasing their investments in China, in a bid to hold more market shares. Take Henkel for example, it established the world’s largest industrial adhesive plant with production capacity of 428kt/a (targeted at the demand for adhesives from automotive field and sundry consumer goods in China and other Asia-Pacific regions) in Shanghai in 2013.
Most local Chinese structural adhesive enterprises were established in the period between 1980s and 1990s. Although with a late start, they have been developing rapidly and some of them such as Huitian Adhesive, Shanghai KangDa New Materials Co., Ltd, Chengdu Guibao Science & Technology Co., Ltd., Beijing COMENS New Material Co., Ltd., Hangzhou Zhijiang Silicone Chemicals Co., Ltd, and Guangzhou Xinzhan Silicone Co., Ltd have been the competitors challenging overseas counterparts in some market segments.
Silicone structural adhesive market:as the production capacity of the industrial players like Chengdu Guibao Science & Technology Co., Ltd., Guangzhou Xinzhan Silicone Co., Ltd., and Hangzhou Zhijiang Silicone Chemicals Co., Ltd are expanding aggressively, the competition in Chinese silcione structural adhesive market has become increasingly fierce.
In March, 2013, Guangzhou Xinzhan Silicone Co., Ltd added the silicone sealants capacity of 120kt/a and realized total production capacity of 180kt/a; Hangzhou Zhijiang Silicone Chemicals Co., Ltd is expected to embrace the silicone sealant capacity of 80kt/a to 100kt/a in the second half year of 2014; Chengdu Guibao Science & Technology Co., Ltd is scheduled to raise the silcone room temperature adhesive capacity up to 80kt/a in 2015, an increase of 50kt/a compared with 2013.
Polyurethane structural adhesive market:Beijing COMENS New Material Co., Ltd is the leading player in composite polyurethane adhesive market, and its sales-output ratio has been always above 95% since 2008, the figure even hit 101.1% in 2013. Currently, the company is actively expanding the production capacity of composite polyurethane adhesive, and it is expected that, till the end of 2014 the company’s capacity of composite polyurethane adhesive will reach 42kt/a.
China Structural Adhesive Industry Report, 2014-2016 resolves around the followings:
Operating environment, status quo, market supply & demand, competition pattern, development forecast, etc of Chinese structural adhesive industry;
Analysis on the demand fro structural adhesive from downstream markets such as building, automobile, windpower & PV, electronics & appliances, etc. and analysis on market segments such as silicone, epoxy and PU structural adhesives;
Operation, adhesive business, development in China, development tendency, etc of 17 global and 16 Chinese Mainland and Taiwanese structural adhesive manufacturers.
第一章 结构胶粘剂概述
1.1 胶粘剂定义及分类
1.2 结构胶粘剂定义和分类
第二章 中国结构胶粘剂市场概况
2.1 运行环境
2.1.1 市场环境
2.1.2 政策环境
2.2 总体现状
2.3 市场供需
2.3.1 全球
2.3.2 中国
2.3.3 市场需求
2.4 竞争格局
2.5 结构胶粘剂下游
2.5.1 建筑领域
2.5.2 汽车领域
2.5.3 风电、光伏领域
2.5.4电子电器领域
2.5.5 其他领域
2.6 发展前景
第三章 中国结构胶粘剂细分市场分析
3.1 有机硅结构胶
3.2 环氧树脂结构胶
3.3 聚氨酯结构胶
3.4 丙烯酸酯结构胶及其他
第四章 全球主要供应商
4.1 H.B. FULLER
4.1.1 公司简介
4.1.2 经营情况
4.1.3 营收构成
4.1.4 毛利率
4.1.5研发与投资
4.1.6 胶粘剂
4.1.7 在华发展
4.1.8 发展预测
4.2 HENKEL
4.2.1 公司简介
4.2.2 经营情况
4.2.3 营收构成
4.2.4 毛利率
4.2.5 研发与投资
4.2.6 胶粘剂业务
4.2.7 在华发展
4.2.8 发展预测
4.3 THREEBOND
4.3.1 公司简介
4.3.2 经营情况
4.3.3 在华发展
4.4 3M
4.4.1 公司简介
4.4.2 经营情况
4.4.3 营收构成
4.4.4 毛利率
4.4.5 研发与投资
4.4.6 在华发展
4.4.7 发展预测
4.5 ITW
4.5.1 公司简介
4.5.2 经营情况
4.5.3 营收构成
4.5.4 研发
4.5.5 在华发展
4.5.6 发展预测
4.6 SIKA
4.6.1 公司简介
4.6.2 经营情况
4.6.3 营收构成
4.6.5 研发与投资
4.6.6 在华发展
4.6.7 发展预测
4.7 MOMENTIVE
4.7.1 公司简介
4.7.2 MSC
4.7.3 MPM
4.7.4 在华发展
4.8 DOW CORNING
4.8.1 公司简介
4.8.2 经营情况
4.8.3 在华发展
4.9 CYTEC INDUSTRIES
4.9.1公司简介
4.9.2经营情况
4.9.3 营收构成
4.9.4 毛利率
4.9.5 投资
4.9.6 胶粘剂
4.9.7 在华发展
4.9.8 发展预测
4.10 ASHLAND
4.10.1 公司简介
4.10.2 经营情况
4.10.3 胶粘剂
4.10.4 在华发展
4.11 ALTECO CHEMICAL
4.11.1 公司简介
4.11.2 在华发展
4.12 AVERY DENNISON
4.12.1 公司简介
4.12.2 经营情况
4.12.3 营收构成
4.12.4 资产剥离
4.12.5 在华发展
4.13 RPM INTERNATIONAL INC.
4.13.1 公司简介
4.13.2 经营情况
4.13.3 营收构成
4.14 BOSTIK SA
4.14.1 公司简介
4.14.2 经营情况
4.15 OMNOVA SOLUTIONS
4.15.1 公司简介
4.15.2 经营情况
4.15.3 在华发展
4.16 LORD
4.16.1 公司简介
4.16.2 在华发展
4.17 MACTAC
4.18 ROYAL ADHESIVES & SEALANTS
4.18.1 公司简介
4.18.2 经营情况
4.19 FRANKLIN ADHESIVES & POLYMERS
4.19.1 公司简介
4.19.2 在华发展
4.20 ADHESIVES RESEARCH
4.21 JOWAT AG
4.21.1 公司简介
4.21.2在华发展
4.22 MAPIE
第五章 中国大陆主要供应商
5.1回天新材
5.1.1 公司简介
5.1.2 经营情况
5.1.3 营收构成
5.1.4 毛利率
5.1.5 研发与投资
5.1.6客户与供应商
5.1.7 结构胶粘剂
5.1.8竞争对手
5.1.9发展预测
5.2康达新材
5.2.1 公司简介
5.2.2 经营情况
5.2.3营收构成
5.2.4 毛利率
5.2.5 研发与投资
5.2.6 客户与供应商
5.2.7 结构胶粘剂
5.2.8 发展预测
5.3硅宝科技
5.3.1 公司简介
5.3.2 经营情况
5.3.3 营收构成
5.3.4 毛利率
5.3.5 研发与投资
5.3.6 客户与供应商
5.3.7有机硅室温胶
5.3.8 发展预测
5.4高盟新材
5.4.1 公司简介
5.4.2 经营情况
5.4.3 营收构成
5.4.4 毛利率
5.4.5 研发与投资
5.4.6 客户与供应商
5.4.7 复合聚氨酯胶粘剂
5.4.8 发展预测
5.5天山新材
5.5.1 公司简介
5.5.2 经营状况
5.5.3 发展前景
5.6山东北方现代化学工业公司
5.6.1 公司简介
5.6.2 结构胶粘剂厂商
5.7白云化工
5.7.1公司简介
5.7.2 经营情况
5.7.3 研发
5.8杭州之江
5.8.1 公司简介
5.8.2 经营情况
5.9 广州新展
5.10 普赛达
5.10.1公司简介
5.10.2 发展情况
5.11 东和
5.12 鑫威电子材料
5.13 上海嘉好
第六章 台湾地区主要供应商
6.1台湾大东
6.2南宝树脂
6.2.1 公司简介
6.2.2 在华业务
6.3德渊
6.3.1 公司简介
6.3.3 经营情况
6.3.3 营收构成
6.3.4 毛利率
6.3.4 研发
6.3.5 胶粘剂
6.3.6在华业务
6.3.7 发展预测
第七章 总结与预测
7.1 总结
7.2预测
1 Overview of Structural Adhesive
1.1 Definition and Classification of Adhesive
1.2 Definition and Classification of Structural Adhesive
2 Overview of China Structural Adhesive Market
2.1 Operating Environment
2.1.1 Market Environment
2.1.2 Policy Environment
2.2 Status Quo
2.3 Supply and Demand
2.3.1 Global
2.3.2 China
2.3.3 Market Demand
2.4 Competitive Landscape
2.5 Downstream of Structural Adhesive
2.5.1 Construction Field
2.5.2 Automotive Field
2.5.3 Windpower and PV Fields
2.5.4 Electronics and Appliances Field
2.5.5 Other Fields
2.6 Development Prospects
3 Structural Adhesive Market Segments in China
3.1 Silicone Structural Adhesive
3.2 Epoxy Structural Adhesive
3.3 Polyurethane Structural Adhesive
3.4 Acrylic Ester Structural Adhesive and Others
4 World’s Leading Suppliers
4.1 H.B. Fuller
4.1.1 Profile
4.1.2 Operation
4.1.3 Revenue Structure
4.1.4 Gross Margin
4.1.5 R&D and Investment
4.1.6 Adhesives
4.1.7 Development in China
4.1.8 Development Forecast
4.2 Henkel
4.2.1 Profile
4.2.2 Operation
4.2.3 Revenue Structure
4.2.4 Gross Margin
4.2.5 R&D and Investment
4.2.6 Adhesive Business
4.2.7 Development in China
4.2.8 Development Forecast
4.3 Threebond
4.3.1 Profile
4.3.2 Operation
4.3.3 Development in China
4.4 3M
4.4.1 Profile
4.4.2 Operation
4.4.3 Revenue Structure
4.4.4 Gross Margin
4.4.5 R&D and Investment
4.4.6 Development in China
4.4.7 Development Forecast
4.5 ITW
4.5.1 Profile
4.5.2 Operation
4.5.3 Revenue Structure
4.5.4 R&D
4.5.5 Development in China
4.5.6 Development Forecast
4.6 SIKA
4.6.1 Profile
4.6.2 Operation
4.6.3 Revenue Structure
4.6.5 R&D and Investment
4.6.6 Development in China
4.6.7 Development Forecast
4.7 CYTEC Industries
4.7.1 Profile
4.7.2 Operation
4.7.3 Revenue Structure
4.7.4 Gross Margin
4.7.5 Investment
4.7.6 Adhesives
4.7.7 Development in China
4.7.8 Development Forecast
4.8 Momentive
4.8.1 Profile
4.8.2 MSC
4.8.3 MPM
4.8.4 Development in China
4.9 Dow Corning
4.9.1 Profile
4.9.2 Operation
4.9.3 Development in China
4.10 ASHLAND
4.10.1 Profile
4.10.2 Operation
4.10.3 Adhesives
4.10.4 Development in China
4.11 AVERY DENNISON
4.11.1 Profile
4.11.2 Operation
4.11.3 Revenue Structure
4.11.4 Divestiture
4.11.5 Development in China
4.12 BOSTIK SA
4.12.1 Profile
4.12.2 Operation
4.13OMNOVA Solutions
4.13.1 Profile
4.13.2 Operation
4.13.3 Development in China
4.14 ALTECO CHEMICAL
4.14.1 Profile
4.14.2 Development in China
4.15 LORD
4.15.1 Profile
4.15.2 Development in China
4.16 Franklin Adhesives & Polymers
4.16.1 Profile
4.16.2 Development in China
4.17 JOWAT AG
4.17.1 Profile
4.17.2Development in China
5 Leading Suppliers in Mainland China
5.1 Huitian Adhesive
5.1.1 Profile
5.1.2 Operation
5.1.3 Revenue Structure
5.1.4 Gross Margin
5.1.5 R&D and Investment
5.1.6 Customers and Suppliers
5.1.7 Adhesive
5.1.8 Rivals
5.1.9Development Forecast
5.2 Shanghai KangDa New Materials Co., Ltd.
5.2.1 Profile
5.2.2 Operation
5.2.3 Revenue Structure
5.2.4 Gross Margin
5.2.5 R&D and Investment
5.2.6 Customers and Suppliers
5.2.7 Adhesive
5.2.8 Development Forecast
5.3 Chengdu Guibao Science & Technology Co., Ltd.
5.3.1 Profile
5.3.2 Operation
5.3.3 Revenue Structure
5.3.4 Gross Margin
5.3.5 R&D and Investment
5.3.6 Customers and Suppliers
5.3.7 Adhesive
5.3.8 Development Forecast
5.4 Beijing COMENS New Material Co., Ltd.
5.4.1 Profile
5.4.2 Operation
5.4.3 Revenue Structure
5.4.4 Gross Margin
5.4.5 R&D and Investment
5.4.6 Customers and Suppliers
5.4.7 Adhesive
5.4.8 Development Forecast
5.5 Beijing TONSAN Adhesive Co., Ltd.
5.5.1 Profile
5.5.2 Operation
5.5.3 Development Prospects
5.6 Shandong North Modern Chemistry Industry Co., Ltd.
5.6.1 Profile
5.6.2 Adhesive Manufacturer
5.7 Guangzhou Baiyun Chemical Industry Co., Ltd.
5.7.1Profile
5.7.2 Operation
5.7.3 R&D
5.8 Hangzhou Zhijiang Silicone Chemicals Co., Ltd
5.8.1 Profile
5.8.2 Operation
5.9 Guangzhou Xinzhan Silicone Co., Ltd
5.10 Dongguan Pustar Adhesives & Sealants Co., Ltd
5.10.1 Profile
5.10.2 Development
5.11 Shanghai Donghe Adhesive Co., Ltd.
5.12 SINWE Electronic Materials
5.13 Shanghai Jaour Adhesive Products Co., Ltd.
6 Leading Suppliers in Taiwan
6.1 Great Eastern Resins Industrial Co., Ltd (Greco)
6.2Nanpao Resins Chemical Co., Ltd
6.2.1 Profile
6.2.2 Business in China
6.3 Texyear
6.3.1 Profile
6.3.3 Operation
6.3.3 Revenue Structure
6.3.4 Gross Margin
6.3.4 R&D
6.3.5 Adhesives
6.3.6 Business in China
6.3.7 Development Forecast
7 Summary and Prediction
7.1 Summary
7.2 Prediction
表:胶粘剂定义和分类
表:结构胶粘剂分类及应用
图:结构胶粘剂产业链
表:2006-2014年中国结构胶粘剂相关的主要政策
图:2003-2013年中国胶粘剂产量及同比增长
图:2003-2013年中国胶粘剂销售收入及同比增长
图:2013年全球胶粘剂和密封剂市场容量(分行业)
图:2013年全球胶粘剂市场结构(按化学组分)
图:2013年全球胶粘剂市场结构(按应用领域)
图:2009-2016年中国结构胶粘剂产量及同比增长
图:2013年中国结构胶粘剂产量结构(按化学组分)
图:2013年中国结构胶粘剂市场结构(按应用领域)
图:2007-2014年中国房屋新开工面积、施工面积和竣工面积
图:2005-2016年中国汽车产量
图:2007-2013年全球及中国风电新增装机容量
图:2007-2013年全球及中国光伏累计装机容量
图:2008-2016年中国有机硅结构胶产量及同比增长
图:2008-2016年中国环氧树脂结构胶产量及同比增长
图:2008-2016年中国聚氨酯结构胶产量及同比增长
表:2008-2016年中国其他结构胶产量
图:2008-2014年富乐公司营业收入和净利润
图:2013年富乐公司营业收入构成(分部门)
图:2008-2014年富乐公司毛利率
图:2008-2013年富乐公司研发支出及其占比
图:2012-2016年富乐公司营业收入和净利润预测
图:2008-2014年Henkel营业收入和净利润
表:2010-2014年Henkel(分业务)销售收入结构
表:2010-2014年Henkel(分地区)销售收入结构
图:2009-2014年Henkel毛利率
图:2009-2014年Henkel研发支出及其占比
图:2009-2014年Henkel胶粘剂技术业务销售收入及同比增长
图:2012-2016年Henkel营业收入和净利润预测
图:2001-2012年Threebond销售收入
图:2012年Threebond公司销售收入构成(分产品)
图:2008-2014年3M销售收入和净利润
表:2011-2013年3M销售收入和营业利润(分部门)
表:2011-2013年3M销售收入和营业利润(分地区)
图:2009-2014年3M毛利率
图:2008-2013年3M研发支出及其占比
图:2011-2013年3M资本支出(分部门)
图:2012-2016年3M销售收入和净利润预测
图:2008-2014年ITW营业收入和营业利润
表:2011-2013年ITW(分业务)营业收入
表:2011-2013年ITW(分地区)营业收入
图:2008-2013年ITW研发支出及其占比
图:2012-2016年ITW营业收入和营业利润预测
图:2008-2014年Sika销售收入和净利润
表:2009-2013年Sika(按应用市场)销售收入构成
图:2013年Sika(分地区)销售收入
图:2008-2013年Sika研发支出及其占比
表:2013-2014年上半年Sika收购(胶粘剂行业)情况
表:截至2013年底Sika在华子公司
图:2012-2016年Sika销售收入和净利润预测
图:2008-2014年MSC销售收入和净利润
图:2013年MSC(分产品)销售收入
图:2008-2014年MPM销售收入和净利润
表:2008-2013年MPM(分产品)销售收入构成
表:2008-2014年Dow Corning销售收入和净利润
图:2008-2014年Cytec Industries销售收入和净利润
表:2011-2014年Cytec Industries(按应用领域)销售收入构成
表:2011-2014年Cytec Industries(分地区)销售收入构成
图:2008-2014年Cytec Industries毛利率
图:2012-2016年Cytec Industries销售收入和净利润预测
图:2009-2014财年Ashland销售收入和净利润
图:2009-2014年 Avery Dennison销售收入和净利润
图:2013年Avery Dennison(分部门)销售收入
图:2009-2014年 RPM International销售收入和净利润
图:2009-2014年 RPM International(分部门)销售收入
图:2009-2013年 Bostik销售收入
图:2010-2014年OMNOVA Solutions销售收入和净利润
图:2008-2014年回天新材营业收入和净利润
表:2008-2013年回天新材(分产品)营业收入
表:2012-2013年回天新材(按应用领域)收入
表:2008-2013年回天新材(分地区)营业收入
图:2008-2014年回天新材(分产品)毛利率
图:2008-2013年回天新材研发支出及其占比
图:2009-2013年回天新材前五名客户营业收入及营收占比
图:2009-2013年回天新材前五名供应商采购额及占比
表:回天新材主要竞争对手分析
图:2012-2016年回天新材营业收入和净利润预测
图:2008-2014年康达新材营业收入和净利润
表:2008-2013年康达新材(分产品)营业收入
图:2008-2013年康达新材(分地区)营业收入
图:2008-2014年康达新材(分产品)毛利率
图:2011-2013年康达新材研发支出及其占比
表:截止到2013年底康达新材项目投资及进展情况
图:2009-2013年康达新材前五名客户营业收入及营收占比
图:2009-2013年康达新材前五名供应商采购额及占比
表:2011-2013年康达新材胶粘剂产销量及其营业收入
图:2012-2016年康达新材营业收入和净利润预测
图:2008-2014年硅宝科技营业收入和净利润
表:2008-2013年硅宝科技(分产品)营业收入
图:2008-2013年硅宝科技(分地区)营业收入
图:2008-2013年硅宝科技(分产品)毛利率
图:2008-2013年硅宝科技研发支出及其占比
图:2009-2013年硅宝科技前五名客户营业收入及营收占比
表:2013年硅宝科技前五名客户名称及其营业贡献
图:2009-2013年硅宝科技前五名供应商采购额及占比
图:2011-2013年硅宝科技有机硅室温胶(按应用领域)营业收入
图:2008-2015年硅宝科技有机硅室温胶产能走势
图:2012-2016年硅宝科技营业收入和净利润预测
图:2008-2014年高盟新材营业收入和净利润
表:2008-2013年高盟新材(分产品)营业收入
图:2008-2013年高盟新材(分产品)毛利率
图:2008-2013年高盟新材研发支出及其占比
图:2009-2013年高盟新材前五名客户营业收入及营收占比
表:2013年高盟新材前五名客户名称及其营业贡献
图:2009-2013年高盟新材前五名供应商采购额及占比
表:2008-2013年高盟新材复合聚氨酯胶粘剂产能、产销量、产能利用率及产销率
图:2012-2016年高盟新材营业收入和净利润预测
图:2007-2013年(预测)天山新材营业收入及同比增长
表:2008-2010年天山新材结构胶粘剂产量(分产品)
表:2011年天山新材拟募投项目及投资额
表:2013-2014年上半年白云化工研发新产品及其特点
图:2008-2014年德渊营业收入和净利润
图:2008-2013年德润(分业务)营业收入
图:2008-2014年德润毛利率
图:2008-2013年德润研发支出及其占比
图:2008-2013年德润热熔胶及其他胶营业收入及其占比
表:2008-2012年德润热熔胶及其他胶产能、产量、产值及产能利用率
表:2008-2012年德润热熔胶及其他胶销量及销售额
表:截止到2013年底德润在华控股子公司名称、主营业务及持股比例
图:2012-2016年德渊营业收入和净利润预测
表:2010-2014年全球结构胶粘剂主要生产商收入排名
表:2010-2014年全球结构胶粘剂主要生产商净利润排名
表:2010-2014年全球结构胶粘剂主要生产商净利润率排名
图:2012-2016年中国结构胶粘剂产量预测(细分产品)
Definition and Classification of Adhesive
Classification and Application of Structural Adhesive
Structural Adhesive Industry Chain
Main Policies about Structural Adhesive in China, 2006-2014
China’s Adhesive Output and YoY Growth, 2003-2013
China’s Adhesive Revenue and YoY Growth, 2003-2013
Global Adhesives and Sealants Market Capacity, 2013
Global Adhesive Market Structure by Chemical Composition, 2013
Global Adhesive Market Structure by Application, 2013
China’s Structural Adhesive Output and YoY Growth, 2009-2016E
China’s Structural Adhesive Output Structure by Chemical Composition, 2013
China Structural Adhesive Market Structure by Application, 2013
New Housing Starts, Construction Area and Completed Area in China, 2007-2014
Automobile Production in China, 2005-2016E
Newly Installed Wind Power Capacity in China and Beyond,2007-2013
Cumulative PV Installed Capacity in China, 2007-2013
China’s Silicone Structural Adhesive Output and YoY Growth, 2008-2016E
China’s Epoxy Structural Adhesive Output and YoY Growth, 2008-2016E
China’s PU Structural Adhesive Output and YoY Growth, 2008-2016E
China’s Other Adhesive Output, 2008-2016E
Revenue and Net Income of H.B. Fuller, 2008-2014
Revenue Structure (by Division) of H.B. Fuller, 2013
Gross Margin of H.B. Fuller, 2008-2014
R&D Costs and % in Revenue of H.B. Fuller, 2008-2013
Revenue and Net Income of H.B. Fuller, 2012-2016E
Revenue and Net Income of Henkel, 2008-2014
Sales Structure (by Business) of Henkel, 2010-2014
Sales Structure (by Region) of Henkel, 2010-2014
Gross Margin of Henkel, 2009-2014
R&D Costs and % in Revenue of Henkel, 2009-2014
Adhesive Technology Business Sales and YoY Growth of Henkel, 2009-2014
Revenue and Net Income of Henkel, 2012-2016E
Sales of Threebond, 2001-2012
Sales Structure (by Product) of Threebond, 2012
Revenue and Net Income of 3M, 2008-2014
Revenue and Operating Income (by Division) of 3M, 2011-2013
Revenue and Operating Income (by Region) of 3M, 2011-2013
Gross Margin of 3M, 2009-2014
R&D Costs and % in Revenue of 3M, 2008-2013
Capital Expenditure (by Division) of 3M, 2011-2013
Revenue and Net Income of 3M, 2012-2016E
Revenue and Operating Income of ITW, 2008-2014
Revenue (by Business) of ITW, 2011-2013
Revenue (by Region) of ITW, 2011-2013
R&D Costs and % in Revenue of ITW, 2008-2013
Revenue and Operating Income of ITW, 2012-2016E
Revenue and Net Income of Sika, 2008-2014
Revenue Structure (by Application Market) of Sika, 2009-2013
Revenue (by Region) of Sika, 2013
R&D Costs and % in Revenue of Sika, 2008-2013
Acquisitions (Adhesive Sector) by Sika, 2013-H1 2014
Subsidiaries of Sika in China by the End of 2013
Revenue and Net Income of Sika, 2012-2016E
Revenue and Net Income of Cytec Industries, 2008-2014
Revenue Structure (by Applications) of Cytec Industries), 2011-2014
Revenue Structure (by Region) of Cytec Industries, 2011-2014
Gross Margin of Cytec Industries, 2008-2014
Revenue and Net Income of Cytec Industries, 2012-2016E
Revenue and Net Income of MSC, 2008-2014
Revenue (by Product) of MSC, 2013
Revenue and Net Income of MPM, 2008-2014
Revenue Structure (by Product) of MPM, 2008-2013
Revenue and Net Income of Dow Corning, 2008-2014
Revenue and Net Income of Ashland, 2009-2014
Revenue and Net Income of Avery Dennison, 2009-2014
Revenue (by Division) of Avery Dennison, 2013
Revenue of Bostik, 2009-2013
Revenue and Net Income of OMNOVA Solutions, 2010-2014
Revenue and Net Income of Huitian Adhesive, 2008-2014
Revenue of Huitian Adhesive by Product, 2008-2013
Revenue of Huitian Adhesive by Application, 2012-2013
Revenue of Huitian Adhesive by Region, 2008-2013
Gross Margin of Huitian Adhesive by Product, 2008-2014
R&D Costs and % in Revenue of Huitian Adhesive, 2008-2013
Huitian Adhesive’s Revenue from Top 5 Customers and % of Total Revenue, 2009-2013
Huitian Adhesive’s Procurement from Top 5 Suppliers and % of Total Procurement, 2009-2013
Major Rivals of Huitian Adhesive
Revenue and Net Income of Huitian Adhesive, 2012-2016E
Revenue and Net Income of Shanghai KangDa New Materials, 2008-2014
Revenue of Shanghai KangDa New Materials by Product, 2008-2013
Revenue of Shanghai KangDa New Materials by Region, 2008-2013
Gross Margin of Shanghai KangDa New Materials by Product, 2008-2014
R&D Costs and % in Revenue of Shanghai KangDa New Materials, 2011-2013
Project Investment and Progress of Shanghai KangDa New Materials by the End of 2013
Revenue of Shanghai KangDa New Materials from Top 5 Customers and % of Total Revenue, 2009-2013
Procurment of Shanghai KangDa New Materials from Top 5 Suppliers and % of Total Revenue, 2009-2013
Adhesive Output, Sales Volume and Revenue of Shanghai KangDa New Materials, 2011-2013
Revenue and Net Income of Shanghai KangDa New Materials, 2012-2016E
Revenue and Net Income of Chengdu Guibao Science & Technology, 2008-2014
Revenue of Chengdu Guibao Science & Technology by Product, 2008-2013
Revenue of Chengdu Guibao Science & Technology by Region, 2008-2013
Gross Margin of Chengdu Guibao Science & Technology by Product, 2008-2013
R&D Costs and % in Revenue of Chengdu Guibao Science & Technology, 2008-2013
Revenue of Chengdu Guibao Science & Technology from Top 5 Customers and % of Total Revenue, 2009-2013
Name List and Revenue Contribution of Top 5 Customers of Chengdu Guibao Science & Technology, 2013
Procurement of Chengdu Guibao Science & Technology from Top 5 Suppliers and % of Total Procurement, 2009-2013
Revenue of Chengdu Guibao Science & Technology from Silicone Room-temperature Adhesive by Application, 2011-2013
Running Trend of Silicone Room-temperature Adhesive Capacity of Chengdu Guibao Science & Technology, 2008-2015
Revenue and Net Income of Chengdu Guibao Science & Technology, 2012-2016E
Revenue and Net Income of Beijing COMENS New Material, 2008-2014
Revenue of Beijing COMENS New Material by Product, 2008-2013
Gross Margin of Beijing COMENS New Material by Product, 2008-2013
R&D Costs and % in Revenue of Beijing COMENS New Material, 2008-2013
Revenue of Beijing COMENS New Material from Top 5 Customers and % of Total Revenue, 2009-2013
Name List and Revenue Contribution of Beijing COMENS New Material, 2013
Procurement of Beijing COMENS New Material from Top 5 Suppliers and % of Total Procurement, 2009-2013
Composite PU Adhesive Capacity, Output & Sales Volume, Capacity Utilization and the Sales-output Ratio of Beijing COMENS New Material, 2008-2013
Revenue and Net Income of Beijing COMENS New Material, 2012-2016E
Structural Adhesive Output of Beijing TONSAN Adhesive by Product, 2008-2010
IPO Projects and Investment Amount of Beijing TONSAN Adhesive, 2011
Newly Developed Products and Characteristics of Guangzhou Baiyun Chemical Industry, 2013-H1 2014
Revenue and Net Income of Texyear, 2008-2014
Revenue of Texyear by Business, 2008-2013
Gross Margin of Texyear, 2008-2014
R&D Costs and % in Revenue of Texyear, 2008-2013
Texyear’s revenue from Hot Melt Adhesive and Other Adhesives and % of Total Revenue, 2008-2013
Capacity, Output, Output Value and Capacity Utilization of Texyear’s Hot Melt Adhesive, 2008-2012
Sales Volume and Sales Value of Texyear’s Hot Melt Adhesive, 2008-2012
Name and Prime Businesses of Texyear’s Sharehodling Subsidiaries in China and Texyear’s Shareholding Ratios of Them as of 2013
Revenue and Net Income of Texyear, 2012-2016E
Ranking of World’s Major Structural Adhesive Manufacturers by Revenue, 2010-2014
Ranking of World’s Major Structural Adhesive Manfuacturers by Net Income, 2010-2014
Ranking of World’s Major Structural Adhesive Manufacturers by Net Profit Margin, 2010-2014
China’s Output of Structural Adhesive (Segmented Products), 2012-2016E
如果这份报告不能满足您的要求,我们还可以为您定制报告,请 留言说明您的详细需求。
|