|
|
|
报告导航:研究报告—
制造业—能源矿产
|
|
2014-2016年中国风电变流器行业研究报告 |
 |
字数:3.1万 |
页数:101 |
图表数:80 |
|
中文电子版:8000元 |
中文纸版:4000元 |
中文(电子+纸)版:8500元 |
|
英文电子版:2240美元 |
英文纸版:2400美元 |
英文(电子+纸)版:2540美元 |
|
编号:YDN005
|
发布日期:2014-06 |
附件:下载 |
 |
|
|
目前,中国已经成为全球风力发电规模最大、增长最快的市场。2013年,中国风电装机容量达91.4GW,新增装机容量16.1GW,占全球新增装机容量的46.1%,位居全球第一。中国风电装机规模的快速攀升带动了中国风电变流器市场规模的增长,2013年中国风电变流器市场规模在188亿元左右,同比增长44.6%。
作为风机的核心部件之一,每新增一套风机就需要配备一套风电变流器。按照每台风机装机容量1.5MW来计算,2013年中国风电变流器需求量为10,726台左右,较2012年增长26.8%。随着需求量的增长,中国风电变流器产量也持续增加,2013年中国风电变流器产量达10,000台左右,同比增长23.5%。
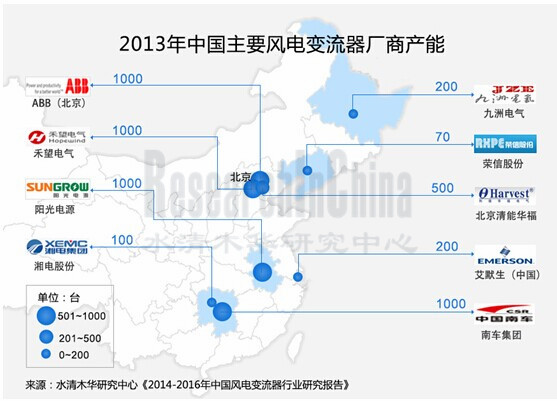
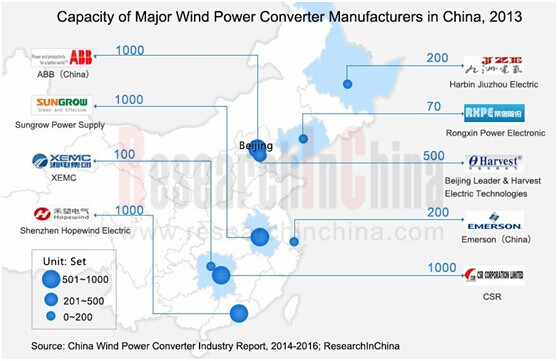
中国本土风电变流器厂商起步较晚。截止2013年底,外资厂商占据了中国风电变流器约95%的市场份额,其中ABB、Converteam、AMSC、Emerson处于领先位置。内资企业主要包括科诺伟业、阳光电源、禾望电气、南车时代、清能华福等。2013年底,阳光电源、禾望电气、南车时代风电变流器产能均达1000台/年。
风电变流器是中国风电设备行业中为数不多的国产化率很低的零部件。在进口替代政策和行业高盈利能力的驱动下,中国本土企业正在加紧进行产品研发,随着风电变流器技术壁垒不断突破,其市场份额有望逐步提升。
风电变流器主要原材料包括功率元器件、控制器件、通用元器件、功率电气件、金属材料以及电线等。各种电力电子器件(包括功率器件和控制器件)是风电变流器主要组成部分,占其成本50-55%左右,其中IGBT占比约为10%;功率电气件包括主变压器,高低压开关等,占其成本的30%-40%;剩余5%左右成本由各种材料和结构件构成。
根据国家能源局《可再生能源发展“十二五”规划》,预计2020年中国风电装机将达到1.5亿千瓦以上,占世界风电总装机容量的4%-6%。按照每台1.5MW计算,预计2014-2016年中国风电变流器需求量仍将维持在8000台/年以上。
水清木华研究中心《2014-2016年中国风电变流器行业研究报告》着重研究了以下内容:
 中国风电变流器行业发展现状,包括市场规模、市场供需、竞争格局、政策环境及未来3年预测等; 中国风电变流器行业发展现状,包括市场规模、市场供需、竞争格局、政策环境及未来3年预测等;
中国风电变流器原材料市场情况,包括原材料成本构成和IGBT、继电器市场分析等;
中国风电装机市场情况,包括风电装机容量、市场份额、进出口和竞争格局等;
全球7家、中国15家风电变流器重点生产企业的经营情况、在华发展及风电变流器业务等。
China now has become the world’s largest and the fastest-growing wind power generation market. In 2013, China had a cumulative 91.4GW of wind power capacity, of which 16.1GW was newly-added capacity, accounting for 46.1% of the world’s newly installed capacity and ranking No. 1 globally. The surge in wind power installations has driven the development of China wind power converter market, which was worth around RMB 18.8 billion in 2013, soaring by 44.6% from a year earlier.
As a core part of wind turbine, one set of wind power converter is needed to support one set of wind turbine. Calculated by installed capacity of 1.5MW for each set of wind turbine, about 10,726 sets of converters were needed in China in 2013, rising by 26.8% from a year earlier. China’s wind power converter output has continued to increase along with the growing demand, arriving at 10,000 sets or so in 2013, up 23.5% year on year.
China’s domestic wind power converter manufacturers started late on the business. By the end of 2013, foreign players dominated about 95% of China wind power converter market, with ABB, Converteam, AMSC and Emerson being the leaders. Domestic Chinese companies chiefly involve Beijing Corona, Sungrow Power, Hopewind, Zhuzhou CSR Times Electric and Qharvest. At the end of 2013, Sungrow Power, Hopewind and Zhuzhou CSR Times Electric had wind power converter capacity of 1,000 sets/a each.
Wind power converter is one of few parts with low localization rate in Chinese wind power equipment industry. Driven by import substitution policies and high profitability of the industry, local Chinese manufacturers are stepping up efforts to develop products, and will gain more market share as technical barriers of wind power converter are broken one after another.
Wind power converter consists mainly of power component, control device, general component, power electric component, metal material and electric wire. Various power and electronic devices (including power component, control device) are major components of wind power converter, accounting for 50%-55% of the total cost, of which IGBT makes up about 10%; power electric components includes main transformer and high/low voltage switch, occupying 30%-40% of its cost; the remaining 5% or so is held by various materials and structural parts.
According to Development Plan for Renewable Energy during the 12th Five-Year Plan Period by National Energy Administration, it is expected that China’s installed capacity of wind power will reach 150 GW by 2020, accounting for 4%-6% of the world’s total wind power installations. Calculated based on 1.5MW for one set of wind turbine, the demand for wind power converter is estimated to stay above 8000 sets/a in China during 2014-2016.
China Wind Power Converter Industry Report, 2014-2016 by ResearchInChina foucuses on the following:
Development status quo of China wind power converter industry, including market size, supply and demand, competitive landscape, policy environment and forecast for the next three years;
Market Profile of raw materials for wind power converter in China, covering cost structure of raw materials and IGBT and relay markets;
Introduction to China’s wind capacity market, invloving installed capacity of wind power, market share, import and export, and competitive landscape;
Operation, development in China and wind power converter business of 7 global and 15 Chinese wind power converter manufacturers.
第一章 风电变流器行业概述
1.1 定义
1.2 分类及应用
1.3 工艺流程
1.4 发展趋势
第二章 中国风电变流器行业发展概况
2.1 市场规模
2.2 供给情况
2.3 需求情况
2.4 政策环境
2.5 竞争格局
第三章 原材料市场状况
3.1 风电变流器原材料构成
3.2 IGBT市场分析
3.2.1 市场规模
3.2.2 竞争格局
3.3 继电器市场分析
3.3.1 市场规模
3.3.2 市场构成
3.3.3 竞争格局
第四章 中国风电装机情况
4.1 风电装机容量
4.2 市场构成
4.3 进出口
4.4 竞争格局
第五章 全球重点风电变流器企业
5.1 ABB
5.1.1 公司简介
5.1.2 经营情况
5.1.3 收入构成
5.1.4 在华业务
5.2 AMSC
5.2.1 公司简介
5.2.2 经营情况
5.2.3 收入构成
5.2.4 在华业务
5.3 西门子
5.3.1 公司简介
5.3.2 经营情况
5.3.3 收入构成
5.3.4在华业务
5.4 Converteam
5.4.1 公司简介
5.4.2 经营情况
5.4.3 在华业务
5.5 Emerson
5.5.1 公司简介
5.5.2 经营情况
5.5.3 收入构成
5.5.4 在华业务
5.6 Vacon
5.6.1 公司简介
5.6.2 经营情况
5.6.3 收入构成
5.6.4 在华业务
5.7 Schneider Electric SA
5.7.1 公司简介
5.7.2 经营情况
5.7.3 收入构成
5.7.4 在华业务
第六章 中国重点风电变流器企业
6.1 阳光电源
6.1.1 公司简介
6.1.2 经营情况
6.1.3 收入构成
6.1.4 毛利率
6.1.5 风电变流器业务
6.1.6 预测与展望
6.2 九洲电气
6.2.1 公司简介
6.2.2 经营情况
6.2.3 收入构成
6.2.4 毛利率
6.2.5 风电变流器业务
6.2.6 预测与展望
6.3 科诺伟业
6.3.1 公司简介
6.3.2 风电变流器业务
6.4 荣信股份
6.4.1 公司简介
6.4.2 经营情况
6.4.3 收入构成
6.4.4 毛利率
6.4.5 风电变流器业务
6.4.6 预测与展望
6.5 龙源电力
6.5.1 公司简介
6.5.2 经营情况
6.5.3 收入构成
6.5.4 毛利率
6.5.5 风电变流器业务
6.5.6 预测与展望
6.6 海得控制
6.6.1 公司简介
6.6.2 经营情况
6.6.3 收入构成
6.6.4 毛利率
6.6.5 风电变流器业务
6.6.6 预测与展望
6.7 禾望电气
6.7.1 公司简介
6.7.2 经营情况
6.7.3 风电变流器业务
6.8 清能华福
6.8.1 公司简介
6.8.2 经营情况
6.9 南车时代电气
6.9.1 公司简介
6.9.2 经营情况
6.9.3 收入构成
6.9.4 毛利率
6.9.5 风电变流器业务
6.9.6 预测与展望
6.10 科陆电子
6.10.1 公司简介
6.10.2 经营情况
6.10.3 收入构成
6.10.4 毛利率
6.10.5 风电变流器业务
6.10.6 预测与展望
6.11 江苏大全
6.11.1 公司简介
6.11.2 经营情况
6.11.3 风电变流器业务
6.12 北京能高
6.12.1 公司简介
6.12.2 风电变流器业务
6.13 许继集团
6.13.1 公司简介
6.13.2 风电变流器业务
6.14 山东新风光
6.14.1 公司简介
6.14.2 经营情况
6.15 东方日立
第七章 总结与预测
7.1 总结
7.2 预测
1. Overview of Wind Power Converter Industry
1.1 Definition
1.2 Classification and Application
1.3 Process Flow
1.4 Development Trend
2. Development of China Wind Power Converter Industry
2.1 Market Size
2.2 Supply
2.3 Demand
2.4 Policy Environment
2.5 Competitive Landscape
3. Raw Materials Market
3.1 Raw Materials of Wind Power Converter
3.2 IGBT Market
3.2.1 Market Size
3.2.2 Competitive Landscape
3.3 Relay Market
3.3.1 Market Size
3.3.2 Market Structure
3.3.3 Competitive Landscape
4. China’s Wind Power Installation
4.1 Installed Wind Power Capacity
4.2 Market Structure
4.3 Import and Export
4.4 Competitive Landscape
5. Major Global Wind Power Converter Manufacturers
5.1 ABB
5.1.1 Profile
5.1.2 Operation
5.1.3 Revenue Structure
5.1.4 Business in China
5.2 AMSC
5.2.1 Profile
5.2.2 Operation
5.2.3 Revenue Structure
5.2.4 Business in China
5.3 Siemens
5.3.1 Profile
5.3.2 Operation
5.3.3 Revenue Structure
5.3.4 Business in China
5.4 Converteam
5.4.1 Profile
5.4.2 Operation
5.4.3 Business in China
5.5 Emerson
5.5.1 Profile
5.5.2 Operation
5.5.3 Revenue Structure
5.5.4 Business in China
5.6 Vacon
5.6.1 Profile
5.6.2 Operation
5.6.3 Revenue Structure
5.6.4 Business in China
5.7 Schneider Electric SA
5.7.1 Profile
5.7.2 Operation
5.7.3 Revenue Structure
5.7.4 Business in China
6. Major Chinese Wind Power Converter Manufacturers
6.1 Sungrow Power Supply Co. Ltd.
6.1.1 Profile
6.1.2 Operation
6.1.3 Revenue Structure
6.1.4 Gross Margin
6.1.5 Wind Power Converter Business
6.1.6 Forecast and Outlook
6.2 Harbin Jiuzhou Electric Co., Ltd.
6.2.1 Profile
6.2.2 Operation
6.2.3 Revenue Structure
6.2.4 Gross Margin
6.2.5 Wind Power Converter Business
6.2.6 Forecast and Outlook
6.3 Beijing Corona Science & Technology Co., Ltd.
6.3.1 Profile
6.3.2 Wind Power Converter Business
6.4 Rongxin Power Electronic Co., Ltd.
6.4.1 Profile
6.4.2 Operation
6.4.3 Revenue Structure
6.4.4 Gross Margin
6.4.5 Wind Power Converter Business
6.4.6 Forecast and Outlook
6.5 China Longyuan Power Group Corporation Ltd.
6.5.1 Profile
6.5.2 Operation
6.5.3 Revenue Structure
6.5.4 Gross Margin
6.5.5 Wind Power Converter Business
6.5.6 Forecast and Outlook
6.6 Shanghai Hi-tech Control System Co., Ltd.
6.6.1 Profile
6.6.2 Operation
6.6.3 Revenue Structure
6.6.4 Gross Margin
6.6.5 Wind Power Converter Business
6.6.6 Forecast and Outlook
6.7 Shenzhen Hopewind Electric Co., Ltd.
6.7.1 Profile
6.7.2 Operation
6.7.3 Wind Power Converter Business
6.8 Chino-Harvest Wind Power Technology Co., Ltd.
6.8.1 Profile
6.8.2 Operation
6.9 Zhuzhou CSR Times Electric Co., Ltd.
6.9.1 Profile
6.9.2 Operation
6.9.3 Revenue Structure
6.9.4 Gross Margin
6.9.5 Wind Power Converter Business
6.9.6 Forecast and Outlook
6.10 Shenzhen Clou Electronics Co., Ltd.
6.10.1 Profile
6.10.2 Operation
6.10.3 Revenue Structure
6.10.4 Gross Margin
6.10.5 Wind Power Converter Business
6.10.6 Forecast and Outlook
6.11 Daqo Group
6.11.1 Profile
6.11.2 Operation
6.11.3 Wind Power Converter Business
6.12 Beijing Nego Automation Technology Co., Ltd.
6.12.1 Profile
6.12.2 Wind Power Converter Business
6.13 XJ Group Corporation
6.13.1 Profile
6.13.2 Wind Power Converter Business
6.14 Shandong Xinfenguang Electronic Technology Co., Ltd.
6.14.1 Profile
6.14.2 Operation
6.15 Dongfang Hitachi (Chengdu) Electric Control Equipments Co., Ltd.
7. Summary and Forecast
7.1 Summary
7.2 Forecast
表:风电变流器应用
图:双馈风电变流器应用示意图
图:全功率风电变流器应用示意图
图:风电变流器工艺流程图
图:2008-2013年中国风电变流器市场规模
图:2009-2013年中国风电变流器产量
图:2006-2013年中国风电变流器需求量
表:2006-2014年中国风电变流器法律法规及政策
图:2013年中国风电变流器市场份额
表:2013年中国风电变流器各厂商产能及规划
表:风电变流器主要原材料
图:2013年风电变流器成本构成
图:2008-2014年全球IGBT市场规模
图:2012年全球IGBT市场份额
图:2006-2016年全球继电器市场规模
图:2006-2016年中国继电器市场规模
图:2013年全球继电器(分行业)市场构成
图:2013年中国继电器市场份额
图:2006-2013年全球风电装机容量
图:2006-2013年中国风电装机容量
图:2013年中国风机整机机型市场份额
图:2007-2013年中国风电机组出口情况
表:2013年中国风电机组(分企业)出口情况
表:2013年中国风电装机市场份额
图:2009-2014年ABB营业收入及净利润
图:2013年ABB(分行业)收入构成
图:截至2013年ABB在中国业务分布
图:2009-2013财年AMSC营业收入及净利润
表:2012-2013财年AMSC(分行业)营业收入
表:2011-2013财年AMSC(分地区)营业收入
图:2009-2013财年Siemens营业收入及净利润
图:2012-2013财年Siemens(分地区)订单额与营业收入
图:2009-2013财年西门子中国营业收入及增幅
图:2011年Converteam 全球业务分部
图:2009-2013财年Emerson销售额及净利润
图:2013财年 Emerson(分产品)销售额构成
图:艾默生网络能源驻中国办事处信息
图:2009-2013年Vacon营业收入及营业利润
表:2013年Vacon(分地区)营业收入
图:2009-2013年Schneider Elecrtic营业收入及净利润
图:2013年Schneider Elecrtic(分地区)营业收入构成
图:2009-2013年Schneider Elecrtic中国区营业收入及增速
图:2010-2014年阳光电源营业收入及净利润
表:2011-2013年阳光电源(分产品)主营业务收入
表:2011-2013年阳光电源(分地区)主营业务收入
表:2011-2013年阳光电源(分产品)毛利率
表:2011-2013年阳光电源风电变流器出货量
图:2011-2016年阳光电源营业收入及净利润
图:2009-2014年九洲电气营业收入及净利润
表:2011-2013年九洲电气(分产品)主营业务收入
表:2011-2013年九洲电气(分地区)主营业务收入
表:2011-2013年九洲电气(分产品)毛利率
图:2011-2016年九洲电气营业收入及净利润
图:2009-2014年荣信股份营业收入及净利润
表:2011-2013荣信股份(分产品)主营业务收入
表:2011-2013荣信股份(分地区)主营业务收入
表:2011-2013年荣信股份(分产品)毛利率
图:2011-2016年荣信股份营业收入及净利润预测
图:2009-2014年龙源电力营业收入及净利润
图:2013年龙源电力(分业务)营业收入构成
图:2009-2013年龙源电力毛利率
图:2011-2016年龙源电力营业收入及净利润预测
图:2009-2014年海得控制营业收入及净利润
表:2011-2013年海得控制(分产品)主营业务收入
表:2012-2013年海得控制(分地区)主营业务收入
表:2011-2013年海得控制(分产品)毛利率
表:2012-2013年海得控制(分地区)毛利率
图:2011-2016年海得控制营业收入及净利润预测
图:2009-2014年南车时代电气营业收入及净利润
表:2011-2013南车时代电气(分产品)营业收入
图:2009-2014年南车时代电气毛利率
图:2009-2014年南车时代电气营业收入及净利润
图:2009-2014年科陆电子营业收入及净利润
表:2012-2013年科陆电子(分产品)主营业务收入
表:2011-2013年科陆电子(分地区)主营业务收入
图:2009-2014年科陆电子毛利率
图:2011-2016年科陆电子营业收入及净利润
表:2009-2012年大全集团销售收入
表:2013年北京能高风电变流器产品
图:2006-2016年中国风电变流器需求量
Application of Wind Power Converter
Application Sketch Map of Double-fed Wind Power Converter
Application Sketch Map of Full Power Wind Power Converter
Process Flow Diagram of Wind Power Converter
China’s Wind Power Converter Market Size, 2008-2013
China’s Wind Power Converter Output, 2009-2013
China’s Wind Power Converter Demand, 2006-2013
China’s Laws, Regulations and Policies Concerning Wind Power Converter, 2006-2014
Share of China Wind Power Converter Market, 2013
Capacity and Planning of Wind Power Converter Manufacturers in China, 2013
Main Raw Materials of Wind Power Converter
Cost Structure of Wind Power Converter, 2013
Global IGBT Market Size, 2008-2014
Global IGBT Market Share, 2012
Global Relay Market Size, 2006-2016E
China Relay Market Size, 2006-2016E
Structure of Global Relay Market by Sector, 2013
China Relay Market Share, 2013
Global Wind Power Installed Capacity, 2006-2013
China Wind Power Installed Capacity, 2006-2013
Market Share of Complete Wind Turbine Models in China, 2013
China’s Wind Turbine Export, 2007-2013
China’s Wind Turbine Export by Manufacturer, 2013
Market Share of China Wind Power Installations, 2013
Revenue and Net Income of ABB, 2009-2014
Revenue Structure of ABB by Sector, 2013
Business Distribution of ABB in China, by 2013
Revenue and Net Income of AMSC, FY2009- FY2013
Revenue of AMSC by Sector, FY2012- FY2013
Revenue of AMSC by Region, FY2011- FY2013
Revenue and Net Income of Siemens, FY2009- FY2013
Orders and Revenue of Siemens by Region, FY2012-FY2013
Revenue and YoY Growth Rate of Siemens in China, FY2009- FY2013
Converteam’s Global Business, 2011
Sales and Net Income of Emerson, FY2009-FY2013
Sales Structure of Emerson by Product, FY2013
Information about China Office of Emerson Network Energy
Revenue and Net Income of Vacon, 2009-2013
Revenue of Vacon by Region, 2013
Revenue and Net Income of Schneider Elecrtic, 2009-2013
Revenue Structure of Schneider Elecrtic by Region, 2013
Revenue and YoY Growth Rate of Schneider Elecrtic in China, 2009-2013
Revenue and Net Income of Sungrow Power, 2010-2014
Operating Revenue of Sungrow Power by Product, 2011-2013
Operating Revenue of Sungrow Power by Region, 2011-2013
Gross Margin of Sungrow Power by Product, 2011-2013
Wind Power Converter Shipment of Sungrow Power, 2011-2013
Revenue and Net Income of Sungrow Power, 2011-2016E
Revenue and Net Income of Harbin Jiuzhou Electric, 2009-2014
Operating Revenue of Harbin Jiuzhou Electric by Product, 2011-2013
Operating Revenue of Harbin Jiuzhou Electric by Region, 2011-2013
Gross Margin of Harbin Jiuzhou Electric by Product, 2011-2013
Revenue and Net Income of Harbin Jiuzhou Electric, 2011-2016E
Revenue and Net Income of Rongxin Power Electronic, 2009-2014
Operating Revenue of Rongxin Power Electronic by Product, 2011-2013
Operating Revenue of Rongxin Power Electronic by Region, 2011-2013
Gross Margin of Rongxin Power Electronic by Product, 2011-2013
Revenue and Net Income of Rongxin Power Electronic, 2011-2016E
Revenue and Net Income of Longyuan Power, 2009-2014
Revenue Structure of Longyuan Power by Business, 2013
Gross Margin of Longyuan Power, 2009-2013
Revenue and Net Income of Longyuan Power, 2011-2016E
Revenue and Net Income of Shanghai Hi-tech Control System, 2009-2014
Operating Revenue of Shanghai Hi-tech Control System by Product, 2011-2013
Operating Revenue of Shanghai Hi-tech Control System by Region, 2011-2013
Gross Margin of Shanghai Hi-tech Control System by Product, 2011-2013
Gross Margin of Shanghai Hi-tech Control System by Region, 2011-2013
Revenue and Net Income of Shanghai Hi-tech Control System, 2011-2016E
Revenue and Net Income of Zhuzhou CSR Times Electric, 2009-2014
Revenue of Zhuzhou CSR Times Electric by Product, 2011-2013
Gross Margin of Zhuzhou CSR Times Electric, 2009-2014
Revenue and Net Income of Zhuzhou CSR Times Electric, 2009-2016E
Revenue and Net Income of Shenzhen Clou Electronics, 2009-2014
Operating Revenue of Shenzhen Clou Electronics by Product, 2012-2013
Operating Revenue of Shenzhen Clou Electronics by Region, 2011-2013
Gross Margin of Shenzhen Clou Electronics, 2009-2014
Revenue and Net Income of Shenzhen Clou Electronics, 2011-2016E
Sales of Daqo Group, 2009-2012
Wind Power Converter Products of Beijing Nego Automation Technology, 2013
China’s Wind Power Converter Demand, 2006-2016E
如果这份报告不能满足您的要求,我们还可以为您定制报告,请 留言说明您的详细需求。
|