|
|
|
报告导航:研究报告—
生命科学—生物科技
|
|
2013-2016年中国动物疫苗行业研究报告 |
 |
字数:5.5万 |
页数:137 |
图表数:176 |
|
中文电子版:9000元 |
中文纸版:4500元 |
中文(电子+纸)版:9500元 |
|
英文电子版:2500美元 |
英文纸版:2700美元 |
英文(电子+纸)版:2800美元 |
|
编号:HK045
|
发布日期:2014-06 |
附件:下载 |
 |
|
|
动物疫苗是接种动物后使其产生主动免疫,预防疾病的一类生物制剂。全球动物疫苗传统市场主要为欧美等发达国家,目前占比仍达60%左右。近年来,由于质量安全、高度成熟等因素影响,欧美动物疫苗市场增长放缓,未来中国等新兴国家动物疫苗市场的快速增长将成为全球动物疫苗市场的新亮点。
2004-2013年,中国动物疫苗市场规模保持26.3%的高速增长,2013年达到115亿元左右。其中2007-2010年的增长主要政府招标苗扩容推动,而2011年之后的增长主要由市场苗扩容推动。中国动物疫苗市场基本由国内企业占据,自给率达90%左右。
由于政策因素,中国动物疫苗产品划分为强制免疫疫苗和市场苗。目前,中国强制免疫疫苗包括口蹄疫、禽流感、猪蓝耳、猪瘟和小反刍疫苗5类,市场苗的主要品种包括猪圆环疫苗、鸡新城疫苗、猪细小病疫苗等。2011年之后,中国政府招标苗市场竞争激烈,成长空间有限;而市场化疫苗则发展较快,2013年占比已达到40%-50%之间。
按动物属性划分,动物疫苗可分为猪用疫苗、禽用疫苗、牛羊用疫苗、宠物及其他疫苗等,2013年中国猪用和禽用疫苗占据了动物疫苗市场80%以上的市场份额。此外,中国宠物产业的兴起正拉动宠物疫苗需求快速增长,而目前中国商品化的宠物疫苗很少,主要依赖进口产品,未来中国宠物疫苗市场将有较大的发展空间。
随着中国养殖业规模化程度逐步提高,动物疫苗需求将继续稳定增长。预计未来几年中国动物疫苗行业有望保持15%左右的增长速度,2016年中国动物疫苗行业市场规模将达到175亿元左右。
2006年,中国实施兽药GMP强制认证,提高行业准入门槛,促使动物疫苗企业数量大幅下降,行业集中度有所提高。2013年,中国动物疫苗上市企业中,市场占有率最高的是中牧股份,达10.5%。其次分别为金宇集团、天康生物、大华农等,三者市场占有率之和达15%左右。

水清木华研究中心《2013-2016年中国动物疫苗行业研究报告》主要包括以下几个内容:
 全球动物疫苗行业市场规模、市场结构、竞争格局等; 全球动物疫苗行业市场规模、市场结构、竞争格局等;
中国动物疫苗行业市场规模、市场结构、竞争格局、进出口分析等;
中国动物疫苗行业政策环境、社会环境、下游需求分析等;
中国猪用疫苗、禽用疫苗等细分市场规模、竞争格局等;
中国10家动物疫苗生产企业的经营情况、动物疫苗业务分析、预测与展望等;
2013-2016年中国动物疫苗及其细分市场规模、市场结构预测等。
Animal vaccine is a kind of biological agent that enables inoculated animals to produce active immunity for disease prevention. Europe and the United States and other developed countries are the main force of traditional animal vaccine markets in the world, still taking around 60% nowadays. In recent years, European and American animal vaccine markets have decelerated growth due to quality safety, high maturity and other factors, while the fast-growing animal vaccine market of China and other emerging countries will become a new highlight.
In 2004-2013, Chinese animal vaccine market size maintained a high growth rate of 26.3%, reaching about RMB11.5 billion in 2013. The growth in 2007-2010 was mainly driven by the expansion of governmental tender vaccine, while that from 2011 was primarily thanks to the market-oriented vaccine expansion. The Chinese animal vaccine market is basically occupied by local companies, showing a self-sufficiency rate of around 90%.
Given the policy factor, Chinese animal vaccine products are divided into compulsory immunization vaccines and market-oriented vaccines. At present, the former include foot-and-mouth disease (FMD), bird flu, porcine reproductive and respiratory syndrome (PRRS), swine fever, and peste des petits ruminants (PPR); the latter refer to porcine circovirus (PCV), Newcastle disease, porcine parvovirus (PPV) and other varieties. Since 2011, the bids for compulsory vaccines proposed by the Chinese government has turned to be more fierce, with limited growth potential; however, market-oriented vaccines have developed faster, enjoying 40%-50% market share in 2013.
According to animal attributes, animal vaccines can be classified into swine vaccines, poultry vaccines, cattle & sheep vaccines, pet vaccines and other vaccines. In 2013, Chinese swine vaccines and poultry vaccines accounted for more than 80% of the animal vaccine market. In addition, the emerging Chinese pet industry is boosting the demand for pet vaccines, but due to lack of commercialized pet vaccines, China now mainly relies on imports. Thus, the Chinese pet vaccine market will see a larger space for development in the future.
As the scale of Chinese farming escalates, the demand for animal vaccines will continue to grow steadily. In the next few years, the Chinese animal vaccine industry is expected to keep a growth rate of approximately 15% and see market value of RMB17.5 billion or so in 2016.
In 2006, China implemented mandatory veterinary drug GMP certification to raise the threshold, resulting in a sharp decline in the number of animal vaccine companies and the accompanying increased industry concentration. In 2013, CAHIC seized the highest market share of 10.5% among Chinese listed animal vaccine companies, followed by Jinyu Group, Tecon and Dahuanong with a combined proportion of 15% or so.
China Animal Vaccine Industry Report, 2013-2016 by ResearchInChina covers the followings:
 The market size, market structure and competitive landscape of the global animal vaccine industry; The market size, market structure and competitive landscape of the global animal vaccine industry;
The market size, market structure, competitive landscape and import & export of the Chinese animal vaccine industry;
Policies, social environment and downstream demand of the Chinese animal vaccine industry;
The size and competitive landscape of Chinese animal vaccine market segments such as swine vaccines and poultry vaccines;
Operation, animal vaccine business, forecast and outlook of 10 Chinese animal vaccine manufacturers;
The market size and market structure of Chinese animal vaccine market and its segments in 2013-2016E.
第一章 动物疫苗行业概述
1.1 定义
1.2 分类
1.3 产业链
第二章 动物疫苗行业发展现状
2.1 国际动物疫苗行业现状
2.1.1 市场规模
2.1.2 市场结构
2.1.3 竞争格局
2.1.4 新疫病及新产品
2.2 中国动物疫苗行业现状
2.2.1 市场规模
2.2.2 市场结构
2.2.3 进出口
2.2.4 利润水平
2.2.5 进入壁垒
2.2.6 竞争格局
2.2.7 发展趋势
第三章 中国动物疫苗行业发展环境
3.1 政策环境
3.1.1 主要政策
3.1.2 强免疫苗招标制度
3.2 社会环境
3.2.1 养殖业稳定发展
3.2.2 规模化养殖趋势
3.2.3 动物疫情频发
第四章 中国动物疫苗行业细分市场分析
4.1 政府强制免疫疫苗
4.1.1 口蹄疫苗
4.1.2 禽流感疫苗
4.1.3 猪蓝耳疫苗
4.1.4 猪瘟疫苗
4.2 市场化疫苗
4.2.1 猪圆环疫苗
4.2.2 鸡新城疫苗
4.3 宠物疫苗
第五章 中国动物疫苗行业主要企业
5.1 中牧股份
5.1.1 企业简介
5.1.2 经营情况
5.1.3 营收构成
5.1.4 毛利率
5.1.5 研发
5.1.6 动物疫苗业务
5.1.7 预测与展望
5.2 金宇集团
5.2.1 企业简介
5.2.2 经营情况
5.2.3 营收构成
5.2.4 毛利率
5.2.5 研发
5.2.6 动物疫苗业务
5.2.7 预测与展望
5.3 天康生物
5.3.1 企业简介
5.3.2 经营情况
5.3.3 营收构成
5.3.4 毛利率
5.3.5 研发
5.3.6 客户和供应商
5.3.7 动物疫苗业务
5.3.8 预测与展望
5.4 天邦股份
5.4.1 企业简介
5.4.2 经营情况
5.4.3 营收构成
5.4.4 毛利率
5.4.5 研发
5.4.6 动物疫苗业务
5.4.7 预测与展望
5.5 升华拜克
5.5.1 企业简介
5.5.2 经营情况
5.5.3 营收构成
5.5.4 毛利率
5.5.5 客户
5.5.6 动物疫苗业务
5.5.7 预测与展望
5.6 瑞普生物
5.6.1 企业简介
5.6.2 经营情况
5.6.3 营收构成
5.6.4 毛利率
5.6.5 研发
5.6.6 动物疫苗业务
5.6.7 预测与展望
5.7 大华农
5.7.1 企业简介
5.7.2 经营情况
5.7.3 营收构成
5.7.4 毛利率
5.7.5 研发
5.7.6 动物疫苗业务
5.7.7 预测与展望
5.8 海利生物
5.8.1 企业简介
5.8.2 经营情况
5.8.3 营收构成
5.8.4 毛利率
5.8.5 研发
5.8.6 客户和供应商
5.8.7 动物疫苗业务
5.8.8 预测与展望
5.9 益康生物
5.9.1 企业简介
5.9.2 经营情况
5.9.3 营收构成
5.9.4 毛利率
5.9.5 研发
5.9.6 客户和供应商
5.9.7 动物疫苗业务
5.10 中博生物
5.10.1 企业简介
5.10.2 经营情况
5.10.3 营收构成
5.10.4 毛利率
5.10.5 研发
5.10.6 客户和供应商
5.10.7 动物疫苗业务
第六章 总结及预测
6.1 总结
6.2 发展预测
6.2.1 猪用疫苗
6.2.2 禽用疫苗
6.2.3 牛羊用疫苗
6.2.4 宠物疫苗
1. Overview of Animal Vaccine
1.1 Definition
1.2 Classification
1.3 Industry Chain
2. Status Quo of Animal Vaccine Industry
2.1 Global Market
2.1.1 Market Size
2.1.2 Market Structure
2.1.3 Competitive Landscape
2.1.4 New Epidemics and Products
2.2 Chinese Market
2.2.1 Market Size
2.2.2 Market Structure
2.2.3 Import and Export
2.2.4 Profit
2.2.5 Entry Barriers
2.2.6 Competitive Landscape
2.2.7 Trends
3. Development Environment for China Animal Vaccine Industry
3.1 Policy Environment
3.1.1 Major Policies
3.1.2 Tendering System for Compulsory Immunization Vaccine
3.2 Social Environment
3.2.1 Stable Development of Farming Industry
3.2.2 Large-scale Farming Becomes a Trend
3.2.3 Frequent Outbreaks of Animal Epidemics
4. Chinese Animal Vaccine Industry Segments
4.1 Governmental Mandatory Vaccine
4.1.1 FMD Vaccine
4.1.2 Bird Flu Vaccine
4.1.3 PRRS Vaccine
4.1.4 Swine Fever Vaccine
4.2 Market-oriented Vaccine
4.2.1 PCV Vaccine
4.2.2 Newcastle Disease Vaccine
4.3 Pet Vaccine
5. Key Enterprises
5.1 CAHIC
5.1.1 Profile
5.1.2 Operation
5.1.3 Revenue Structure
5.1.4 Gross Margin
5.1.5 R & D
5.1.6 Animal Vaccine Business
5.1.7 Forecast and Outlook
5.2 Jinyu Group
5.2.1 Profile
5.2.2 Operation
5.2.3 Revenue Structure
5.2.4 Gross Margin
5.2.5 R & D
5.2.6 Animal Vaccine Business
5.2.7 Forecast and Outlook
5.3 Tecon
5.3.1 Profile
5.3.2 Operation
5.3.3 Revenue Structure
5.3.4 Gross Margin
5.3.5 R & D
5.3.6 Clients and Suppliers
5.3.7 Animal Vaccine Business
5.3.8 Forecast and Outlook
5.4 Tech-bank
5.4.1 Profile
5.4.2 Operation
5.4.3 Revenue Structure
5.4.4 Gross Margin
5.4.5 R & D
5.4.6 Animal Vaccine Business
5.4.7 Forecast and Outlook
5.5 Shenghua Biok
5.5.1 Profile
5.5.2 Operation
5.5.3 Revenue Structure
5.5.4 Gross Margin
5.5.5 Clients
5.5.6 Animal Vaccine Business
5.5.7 Forecast and Outlook
5.6 Ringpu Bio-technology
5.6.1 Profile
5.6.2 Operation
5.6.3 Revenue Structure
5.6.4 Gross Margin
5.6.5 R & D
5.6.6 Animal Vaccine Business
5.6.7 Forecast and Outlook
5.7 Dahuanong
5.7.1 Profile
5.7.2 Operation
5.7.3 Revenue Structure
5.7.4 Gross Margin
5.7.5 R & D
5.7.6 Animal Vaccine Business
5.7.7 Forecast and Outlook
5.8 Hile Bio
5.8.1 Profile
5.8.2 Operation
5.8.3 Revenue Structure
5.8.4 Gross Margin
5.8.5 R & D
5.8.6 Clients and Suppliers
5.8.7 Animal Vaccine Business
5.8.8 Forecast and Outlook
5.9 Yikang
5.9.1 Profile
5.9.2 Operation
5.9.3 Revenue Structure
5.9.4 Gross Margin
5.9.5 R & D
5.9.6 Clients and Suppliers
5.9.7 Animal Vaccine Business
5.10 Chopper
5.10.1 Profile
5.10.2 Operation
5.10.3 Revenue Structure
5.10.4 Gross Margin
5.10.5 R & D
5.10.6 Clients and Suppliers
5.10.7 Animal Vaccine Business
6. Summary and Forecast
6.1 Summary
6.2 Development Forecast
6.2.1 Swine Vaccine
6.2.2 Poultry Vaccine
6.2.3 Cattle and Sheep Vaccine
6.2.4 Pet Vaccine
图:动物保健品产品分类
表:动物疫苗种类(按构成成分和特性)及特点
图:动物疫苗行业产业链
表:中国动物疫病分类
图:2008-2016年全球动物疫苗市场规模及预测
表:全球动物保健品行业巨头基本情况
表:近年来国外商业化的疫苗及生产厂家
表:中国强制免疫政策发展历程
图:2004-2013年中国动物疫苗市场规模
图:2008-2013年中国动物疫苗净进口额及对外依存度
表:2010-2013年中国动物疫苗产品结构(按动物种类)
表:2010-2013年中国动物疫苗产品结构(按疫苗种类)
图:2009-2014年中国兽用疫苗进出口量
图:2009-2014年中国兽用疫苗进出口平均价格
图:2013年中国兽用疫苗进口国家(按进口量)
图:2013年中国兽用疫苗出口目的地分布(按出口量)
图:2013年中国进口兽用疫苗的主要地区及其进口量占比
图:2013年中国出口兽用疫苗的主要地区及其出口量占比
表:2011-2013年中国主要动物疫苗上市公司动物疫苗业务毛利率
表:中国动物疫苗行业进入壁垒
表:2013中国动物疫苗主要生产企业及其生产能力
图:2013年中国动物疫苗行业竞争格局
表:中国疫苗生产工艺水平与国际先进水平的主要差距
表:1990-2013年中外合资动物疫苗企业
表:2010-2014年中国动物疫苗行业主要政策
表:2013年中国动物疫病强制免疫计划
表:2013-2020年中国优先防治和重点防范的动物疫病
图:中国强制免疫招标体系缺陷
图:中国强制免疫招标体系改革方向
图:2009-2013年中国肉类、禽蛋及牛奶产量
图:2011-2013年中国肉类产品结构(按产量)
图:2010-2020年中国养殖规模化程度
表:中国常见动物疫情概述
表:2013年中国动物疫情汇总
表:中国动物疫苗市场结构(按销售方式)
表:2013年中国主要强制免疫疫苗市场竞争格局
表:中国各种猪瘟疫苗性能比较
表:中国市场化疫苗分类及市场情况
表:2013年中国部分强免疫病市场化疫苗市场容量
表:2013年中国部分非强制免疫疫苗市场容量
表:鸡新城疫疫苗市场容量及瑞普生物市场份额
表:中国宠物疫苗市场供应企业及其产品
图:2009-2013年中牧股份营业收入和净利润
表:2011-2013年中牧股份(分产品)营业收入
图:2011-2013年中牧股份(分产品)营业收入占比
表:2011-2013年中牧股份(分地区)营业收入
图:2011-2013年中牧股份(分地区)营业收入占比
表:2011-2013年中牧股份主营产品毛利率
图:2011-2013年中牧股份研发支出及占营业收入比例
表:中牧股份动物疫苗相关子公司及其产品
表:2014年中牧股份动物疫苗在建项目
表:2012-2016年中牧股份营业收入和净利润预测
图:2009-2013年金宇集团营业收入和净利润
表:2011-2013年金宇集团(分产品)营业收入
图:2011-2013年金宇集团(分产品)营业收入占比
表:2011-2013年金宇集团(分地区)营业收入
图:2011-2013年金宇集团(分地区)营业收入占比
图:2010-2013年金宇集团主营业务毛利率
图:2011-2013年金宇集团研发支出及占营业收入比例
表:2013年金宇集团动物疫苗相关子公司情况
表:2012-2013年金宇保灵营业收入及净利润
表:2012-2016年金宇集团营业收入和净利润预测
图:2009-2013年天康生物营业收入和净利润
表:2011-2013年天康生物(分产品)营业收入
图:2011-2013年天康生物(分产品)营业收入占比
表:2011-2013年天康生物(分地区)营业收入
图:2011-2013年天康生物(分地区)营业收入
表:2011-2013年天康生物主营产品毛利率
图:2011-2013年天康生物研发支出及占营业收入比例
图:2011-2013年天康生物前五名客户贡献收入及占比
表:2013年天康生物前五名客户名称、收入贡献及占比
图:2011-2013年天康生物前五名供应商采购金额及占比
表:2013年天康生物前五名供应商名称、采购金额及占比
表:2013年天康生物动物疫苗生产基地及产能
表:2012-2016年天康生物营业收入和净利润预测
图:2009-2013年天邦股份营业收入和净利润
表:2011-2013年天邦股份(分产品)营业收入
图:2011-2013年天邦股份(分产品)营业收入占比
表:2011-2013年天邦股份(分地区)营业收入
图:2011-2013年天邦股份(分地区)营业收入占比
表:2011-2013年天邦股份主营产品毛利率
图:2011-2013年天邦股份研发支出及占营业收入比例
图:2010-2013年成都天邦营业收入及净利润
表:2012-2016年天邦股份营业收入和净利润预测
图:2009-2013年升华拜克营业收入和净利润
表:2011-2013年升华拜克(分产品)营业收入
图:2011-2013年升华拜克(分产品)营业收入占比
表:2011-2013年升华拜克(分地区)营业收入
图:2011-2013年升华拜克(分地区)营业收入占比
表:2011-2013年升华拜克主要产品毛利率
图:2011-2013年升华拜克前五名客户贡献收入及占比
表:2013年升华拜克前五名客户名称、收入贡献及占比
图:2009-2013年青岛易邦营业收入与净利润
表:2012-2016年升华拜克营业收入和净利润预测
图:2009-2013年瑞普生物营业收入和净利润
表:2011-2013年瑞普生物(分产品)营业收入
表:2011-2013年瑞普生物(分产品)营业收入占比
表:2012-2013年瑞普生物(分地区)营业收入
图:2012-2013年瑞普生物(分地区)营业收入占比
图:2011-2013年瑞普生物主营产品毛利率
图:2011-2013年瑞普生物研发支出及占营业收入比例
表:2011-2013年瑞普生物动物疫苗(分产品)产销量
表:2013年瑞普生物动物疫苗(分产品)销售收入及毛利率
表:2013年瑞普生物动物疫苗业务相关子公司及其产品
表:2013年瑞普生物动物疫苗业务相关子公司营业收入和净利润
表:2013年瑞普生物动物疫苗在建项目
表:2012-2016年瑞普生物营业收入和净利润预测
图:2009-2013年大华农营业收入和净利润
表:2011-2013年大华农(分产品)营业收入
图:2011-2013年大华农(分产品)营业收入占比
表:2011-2013年大华农(分地区)营业收入
图:2011-2013年大华农(分地区)营业收入占比
图:2011-2013年大华农主营产品毛利率
图:2011-2013年大华农研发支出及占营业收入比例
表:2010-2013大华农动物疫苗产品产能
表:2012-2013年大华农兽用生物制品产量、销量及产销率
表:2012-2016年大华农营业收入和净利润预测
表:海利生物主要产品
图:2011-2013年海利生物营业收入和净利润
表:2011-2013年海利生物(分产品)营业收入
图:2011-2013年海利生物(分产品)营业收入占比
表:2011-2013年海利生物(分地区)营业收入
图:2011-2013年海利生物(分地区)营业收入占比
图:2011-2013年海利生物主营产品毛利率
图:2011-2013年海利生物研发支出及占营业收入比例
表:2013年海利生物前五名客户名称、收入贡献及占比
图:2011-2013年海利生物前五名供应商采购金额及占比
表:2013年海利生物供应商名称、采购金额及占比
表:2013年海利生物(分产品)营业收入占比
表:2011-2013年海利生物三种销售模式的营业收入占比
表:2011-2013年海利生物猪用疫苗产能及产销量
表:2011-2013年海利生物主要产品销售价格
表:2014年海利生物动物疫苗募投项目情况
表:2012-2016年海利生物营业收入和净利润预测
图:2009-2011年益康生物营业收入和净利润
表:2009-2011年益康生物(分产品)营业收入
图:2009-2011年益康生物(分产品)营业收入占比
表:2009-2011年益康生物(分地区)营业收入
图:2009-2011年益康生物(分地区)营业收入占比
图:2009-2011年益康生物主营产品毛利率
图:2009-2011年益康生物研发支出及占营业收入比例
图:2009-2011年益康生物前五名客户贡献收入及占比
表:2011年益康生物前五名客户名称、收入贡献及占比
图:2009-2011年益康生物前五名供应商采购金额及占比
表:2011年益康生物供应商名称、采购金额及占比
表:2009-2011年益康生物动物疫苗生产线
表:2009-2011年益康生物产能、产量及产能利用率
表:2009-2011年益康生物产量、销量及产销率
图:2009-2011年益康生物主要产品平均销售价格
图:2009-2011年益康生物营业收入构成(按销售模式)
图:2009-2011年中博生物营业收入和净利润
表:2011-2013年中博生物(分产品)营业收入
图:2011-2013年中博生物(分产品)营业收入占比
表:2011-2013年中博生物(分地区)营业收入
图:2011-2013年中博生物(分地区)营业收入占比
表:2011-2013年中博生物主要疫苗产品销售收入
图:2011-2013年中博生物研发支出及占营业收入比例
图:2011-2013年中博生物前五名客户贡献收入及占比
表:2013年中博生物前五名客户名称、收入贡献及占比
图:2011-2013年中博生物前五名供应商采购额及占比
表:2013年中博生物供应商名称、采购金额及占比
表:中博生物三种销售模式及其产品、客户
表:2011-2013年中博生物三种销售模式销售收入占比
表:2011-2013年中博生物主要疫苗产品销售收入
表:2011-2013年中博生物主要疫苗产品销售收入占比
表:2011-2013年中博生物疫苗产能、产量及产能利用率
表:2011-2013年中博生物疫苗产量、销量及产销率
图:2011-2013年中博生物主要疫苗产品平均销售价格
表:2014年中博生物投资计划
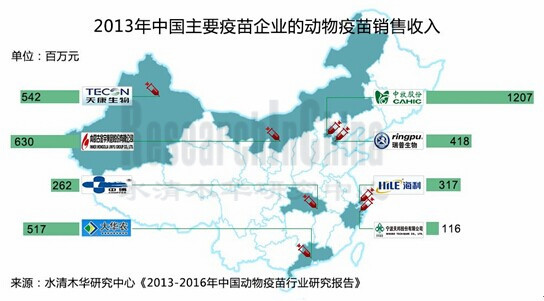
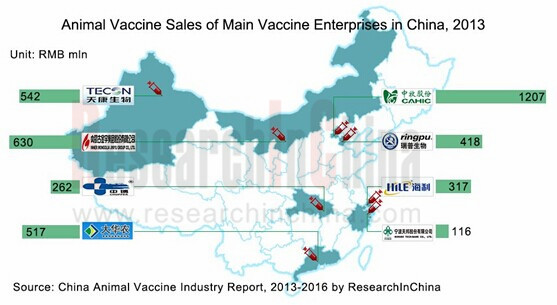
表:2011-2013年中国主要动物疫苗公司的动物疫苗业务收入
图:2012-2016年中国动物疫苗市场规模预测
图:2013与2016年中国动物疫苗市场结构预测(按动物属性分)
图:2012-2016年中国猪用疫苗市场规模预测
图:2012-2016年中国禽用疫苗市场规模预测
图:2012-2016年中国牛羊用疫苗市场规模预测
图:2012-2016年中国宠物疫苗市场规模预测
Classification of Animal Health Products
Animal Vaccine Types (by Constituent and Feature) and Characteristics
Animal Vaccine Industry Chain
Classification of Animal Epidemics in China
Global Animal Vaccine Market Size, 2008-2016E
Profile of Global Animal Health Products Giants
Commercialized Vaccines and Manufacturers in Overseas Market in Recent Years
Development Process of Chinese Compulsory Vaccination Policies
Chinese Animal Vaccine Market Size, 2004-2013
China’s Animal Vaccine Net Import Value and Dependence on Export, 2008-2013
China’s Animal Vaccine Product Structure (by Animal Species), 2010-2013
China’s Animal Vaccine Product Structure (by Vaccine Type), 2010-2013
China’s Animal Vaccine Import and Export Volume, 2009-2014
China’s Average Animal Vaccine Import and Export Prices, 2009-2014
China’s Animal Vaccine Import Sources (by Import Volume), 2013
China’s Animal Vaccine Export Destinations (by Export Volume), 2013
Main Regions Which Import Animal Vaccines and Their Share in Import Volume in China, 2013
Main Regions Which Export Animal Vaccines and Their Share in Export Volume in China, 2013
Gross Margin of Animal Vaccine Business of Major Listed Animal Vaccine Companies in China, 2011-2013
Barriers to Entry into Animal Vaccine Industry in China
Major Chinese Animal Vaccine Manufacturers and Their Capacity, 2013
Competitive Landscape of China Animal Vaccine Industry, 2013
Gap between Chinese Vaccine Production Process and International Advanced Level
Sino-foreign Joint Animal Vaccine Enterprises, 1990-2013
Major Polices on China Animal Vaccine Industry, 2010-2014
Compulsory Immunization Plan of Animal Epidemics in China, 2013
Animal Diseases worth Priority Prevention in China, 2013-2020
Defects of Compulsory Vaccination Tender System in China
Direction for Compulsory Vaccination Tender System Reform in China
Output of Meat, Eggs and Milk in China, 2009-2013
China’s Meat Product Structure (by Output), 2011-2013
Farming Scale Degree in China, 2010-2020E
Overview of Common Animal Epidemics in China
Animal Epidemic Summary in China, 2013
China’s Animal Vaccine Market Structure (by Sales Method)
Competitive Landscape of Main Compulsory Immunization Vaccine Markets in China, 2013
Performance Comparison between Swine Fever Vaccines in China
Classification and Market Conditions of Market-oriented Vaccines in China
Market Capacity of Some Compulsory Market-oriented Vaccines in China, 2013
Market Capacity of Some Non-compulsory Vaccines in China, 2013
Market Capacity of Newcastle Disease Vaccine and Market Share of Ringpu Bio-technology
Pet Vaccine Suppliers in Chinese Market and Their Products
CAHIC’s Revenue and Net Income, 2009-2013
CAHIC’s Revenue (by Product), 2011-2013
CAHIC’s Revenue Structure (by Product), 2011-2013
CAHIC’s Revenue (by Region), 2011-2013
CAHIC’s Revenue Structure (by Region), 2011-2013
Gross Margin of CAHIC’s Main Products, 2011-2013
CAHIC’s R & D Costs and % of Total Revenue, 2011-2013
CAHIC's Animal Vaccine Subsidiaries and Their Products
CAHIC's Animal Vaccine Projects under Construction, 2014
CAHIC's Revenue and Net Income, 2012-2016E
Jinyu Group’s Revenue and Net Income, 2009-2013
Jinyu Group’s Revenue (by Product), 2011-2013
Jinyu Group’s Revenue Structure (by Product), 2011-2013
Jinyu Group’s Revenue (by Region), 2011-2013
Jinyu Group’s Revenue Structure (by Region), 2011-2013
Gross Margin of Jinyu Group’s Main Business, 2010-2013
Jinyu Group’s R & D Costs and % of Total Revenue, 2011-2013
Animal Vaccine Subsidiaries of Jinyu Group, 2013
Revenue and Net Income of Spirit Jinyu, 2012-2013
Jinyu Group’s Revenue and Net Income, 2012-2016E
Tecon’s Revenue and Net Income, 2009-2013
Tecon’s Revenue (by Product), 2011-2013
Tecon’s Revenue Structure (by Product), 2011-2013
Tecon’s Revenue (by Region), 2011-2013
Tecon’s Revenue Structure (by Region), 2011-2013
Gross Margin of Tecon’s Main Products, 2011-2013
Tecon’s R & D Costs and % of Total Revenue, 2011-2013
Tecon’s Revenue from Top 5 Clients and % of Total Revenue, 2011-2013
Name List and Revenue Contribution of Tecon’s Top 5 Clients, 2013
Tecon’s Procurement from Top 5 Suppliers and % of Total Procurement, 2011-2013
Name List and Procurement Contribution of Tecon’s Top 5 Suppliers, 2013
Tecon’s Animal Vaccine Production Bases and Capacity, 2013
Tecon’s Revenue and Net Income, 2012-2016E
Tech-bank’s Revenue and Net Income, 2009-2013
Tech-bank’s Revenue (by Product), 2011-2013
Tech-bank’s Revenue Structure (by Product), 2011-2013
Tech-bank’s Revenue (by Region), 2011-2013
Tech-bank’s Revenue Structure (by Region), 2011-2013
Tech-bank’s Gross Margin of Main Products, 2011-2013
Tech-bank’s R & D Costs and % of Total Revenue, 2011-2013
Revenue and Net Income of Chengdu TECBOND, 2010-2013
Tech-bank’s Revenue and Net Income, 2012-2016E
Shenghua Biok’s Revenue and Net Income, 2009-2013
Shenghua Biok’s Revenue (by Product), 2011-2013
Shenghua Biok’s Revenue Structure (by Product), 2011-2013
Shenghua Biok’s Revenue (by Region), 2011-2013
Shenghua Biok’s Revenue Structure (by Region), 2011-2013
Gross Margin of Shenghua Biok’s Main Products, 2011-2013
Shenghua Biok’s Revenue from Top 5 Clients and % of Total Revenue, 2011-2013
Name List and Revenue Contribution of Shenghua Biok’s Top 5 Clients, 2013
Revenue and Net Income of Qingdao Yebio, 2009-2013
Shenghua Biok’s Revenue and Net Income, 2012-2016E
Ringpu Bio-technology’s Revenue and Net Income, 2009-2013
Ringpu Bio-technology’s Revenue (by Product), 2011-2013
Ringpu Bio-technology’s Revenue Structure (by Product), 2011-2013
Ringpu Bio-technology’s Revenue (by Region), 2012-2013
Ringpu Bio-technology’s Revenue Structure (by Region), 2012-2013
Ringpu Bio-technology’s Gross Margin of Main Products, 2011-2013
Ringpu Bio-technology’s R & D Costs and % of Total Revenue, 2011-2013
Ringpu Bio-technology’s Animal Vaccine Output and Sales Volume (by Product), 2011-2013
Sales and Gross Margin of Ringpu Bio-technology’s Animal Vaccines (by Product), 2013
Ringpu Bio-technology’s Animal Vaccine Subsidiaries and Their Products, 2013
Revenue and Net Income of Ringpu Bio-technology’s Animal Vaccine Subsidiaries, 2013
Ringpu Bio-technology’s Animal Vaccine Projects under Construction, 2013
Ringpu Bio-technology’s Revenue and Net Income, 2012-2016E
Dahuanong’s Revenue and Net Income, 2009-2013
Dahuanong’s Revenue Structure (by Product), 2011-2013
Dahuanong’s Revenue Structure (by Product), 2011-2013
Dahuanong’s Revenue (by Region), 2011-2013
Dahuanong’s Revenue Structure (by Region), 2011-2013
Gross Margin of Dahuanong’s Main Products, 2011-2013
Dahuanong’s R & D Costs and % of Total Revenue, 2011-2013
Capacity of Dahuanong’s Animal Vaccine Products, 2010-2013
Output, Sales Volume and Sales-output Ratio of Dahuanong’s Veterinary Biologics, 2012-2013
Dahuanong’s Revenue and Net Income, 2012-2016E
Hile Bio’s Main Products
Hile Bio’s Revenue and Net Income, 2011-2013
Hile Bio’s Revenue Structure (by Product), 2011-2013
Hile Bio’s Revenue Structure (by Product), 2011-2013
Hile Bio’s Revenue (by Region), 2011-2013
Hile Bio’s Revenue Structure (by Region), 2011-2013
Gross Margin of Hile Bio’s Main Products, 2011-2013
Hile Bio’s R & D Costs and % of Total Revenue, 2011-2013
Name List and Revenue Contribution of Hile Bio’s Top 5 Clients, 2013
Hile Bio’s Procurement from Top 5 Suppliers and % of Total Procurement, 2011-2013
Name List and Procurement Contribution of Hile Bio’s Suppliers, 2013
Hile Bio’s Revenue Structure (by Product), 2013
Hile Bio’s Revenue Structure (by Sales Method), 2011-2013
Hile Bio’s Swine Vaccine Capacity, Output and Sales Volume, 2011-2013
Selling Prices of Hile Bio’s Main Products, 2011-2013
Hile Bio’s Animal Vaccine Fundraising Projects, 2014
Hile Bio’s Revenue and Net Income, 2012-2016E
Yikang’s Revenue and Net Income, 2009-2011
Yikang’s Revenue Structure (by Product), 2009-2011
Yikang’s Revenue Structure (by Product), 2009-2011
Yikang’s Revenue (by Region), 2009-2011
Yikang’s Revenue Structure (by Region), 2009-2011
Gross Margin of Yikang’s Main Products, 2009-2011
Yikang’s R & D Costs and % of Total Revenue, 2009-2011
Yikang’s Revenue from Top 5 Clients and % of Total Revenue, 2009-2011
Name List and Revenue Contribution of Yikang’s Top 5 Clients, 2011
Yikang’s Procurement from Top 5 Suppliers and % of Total Procurement, 2009-2011
Name List and Procurement Contribution of Yikang’s Suppliers, 2011
Yikang’s Animal Vaccine Production Lines, 2009-2011
Yikang’s Capacity, Output and Capacity Utilization, 2009-2011
Yikang’s Output, Sales Volume and Sales-output Ratio, 2009-2011
Average Selling Price of Yikang’s Main Products, 2009-2011
Yikang’s Revenue Structure (by Sales Method), 2009-2011
Chopper’s Revenue and Net Income, 2009-2011
Chopper’s Revenue (by Product), 2011-2013
Chopper’s Revenue Structure (by Product), 2011-2013
Chopper’s Revenue (by Region), 2011-2013
Chopper’s Revenue Structure (by Region), 2011-2013
Sales of Chopper's Main Vaccine Products, 2011-2013
Chopper’s R & D Costs and % of Total Revenue, 2011-2013
Chopper’s Revenue from Top 5 Clients and % of Total Revenue, 2011-2013
Name List and Revenue Contribution of Chopper’s Top 5 Clients, 2013
Chopper’s Procurement from Top 5 Suppliers and % of Total Procurement, 2011-2013
Name List and Procurement Contribution of Chopper’s Suppliers, 2013
Chopper’s Products and Clients (by Sales Method)
Chopper’s Sales Structure by Sales Method, 2011-2013
Sales of Chopper’s Main Vaccine Products, 2011-2013
Chopper’s Sales Structure by Main Vaccine Product, 2011-2013
Chopper’s Vaccine Capacity, Output and Capacity Utilization, 2011-2013
Chopper’s Vaccine Output, Sales Volume and Sales-output Ratio, 2011-2013
Average Selling Price of Chopper’s Main Vaccine Products, 2011-2013
Chopper’s Investment Plan, 2014
Animal Vaccine Revenue of Major Animal Vaccine Companies in China, 2011-2013
Chinese Animal Vaccine Market Size, 2012-2016E
Chinese Animal Vaccine Market Structure (by Animal Attributes), 2013 vs 2016E
Chinese Swine Vaccine Market Size, 2012-2016E
Chinese Poultry Vaccine Market Size, 2012-2016E
如果这份报告不能满足您的要求,我们还可以为您定制报告,请 留言说明您的详细需求。
|