|
|
|
报告导航:研究报告—
制造业—工业机械
|
|
2013-2014年全球及中国电动工具行业研究报告 |
 |
字数:1.8万 |
页数:70 |
图表数:69 |
|
中文电子版:7000元 |
中文纸版:3500元 |
中文(电子+纸)版:7500元 |
|
英文电子版:1650美元 |
英文纸版:1750美元 |
英文(电子+纸)版:1950美元 |
|
编号:ZYW176
|
发布日期:2014-06 |
附件:下载 |
 |
|
|
2013-2014年全球及中国电动工具行业研究报告》主要包含以下内容:
1、电动工具简介
2、全球电动工具市场与产业
3、全球房地产与基建市场
4、中国电动工具市场与产业
5、16家电动工具厂家研究
电动工具主要应用在三个领域,分别是建筑、DIY、园艺。因此电动工具市场与基础设施建设和房地产关系最密切,除去金融危机时期,电动工具市场都相当稳定,波动范围比较小。
2013年中美房地产市场都异常火热,尤其中国房地产市场。进入2014年,中国房地产急转直下,美国房地产市场也开始呈现颓势。对中国来说,不仅房地产市场,基础设施建设市场也出现下滑,原因主要在于政府对贪污腐败的打击。美国5月新屋开工(new home start)年化100.1万户,预期103万户,5月新屋开工户数环比下降6.5%,预期下降3.9%。5月营建许可(building permit)年化99.1万户,预期105万户,5月营建许可环比下降6.4%,预期下降0.9%。美国短期利率走高打压了房地产市场,预计2015年会更糟糕。不过电动工具市场是略微滞后于房地产市场的,2014年仍然是不错的一年。
2013年全球电动工具市场规模大约为163亿美元,增幅为8.7%,预计2014年达168亿美元,增幅为3.1%,而2015年的电动工具市场预计下滑4.2%,达到161亿美元。
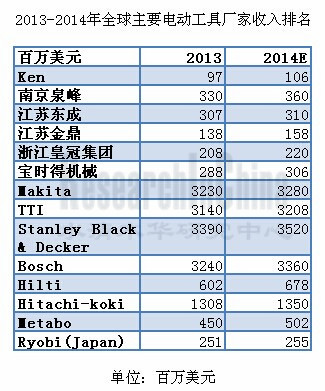
全球电动工具市场集中度很高,前四大企业收入都在30亿美元之上,彼此之间差距不大,Stanley Black & Decker和TTI市场集中在北美,Makita 和Bosch市场集中在欧洲。Hilti集中在欧洲的基础设施建设市场。Hitachi-koki集中在日本和欧洲。
中国则是全球最大的电动工具制造基地,全球近80%的电动工具都是在中国制造的,特别是集中在江苏和浙江两个省。中国2013年出口电动工具达2.01亿台,仅获得62.07亿美元的收入。
中国在努力改变低端制造的形象,主要手段是并购,如南京泉峰收购德国Flex。中国企业也在被国外厂家收购,如2013年Stanley Black & Decker收购江苏国强(Jiangsu Guoqiang)60%的股份。
Global and China Power Tool Industry Report, 2013-2014 mainly includes the followings:
1. Introduction to power tools
2. Global power tool market and industry
3. Global property and infrastructure construction market
4. Power tool market and industry in China
5. Analysis of 16 power tool manufacturers
Power tools are used primarily in three fields: construction, DIY and gardening, and therefore they are closely related to infrastructure construction and real estate market. Except for the period of financial crisis, the power tool market has remained fairly stable, with narrow scope of fluctuations.
In 2013, both China and the United States witnessed an excessively thriving property market, especially for China. Entering 2014, however, China’s property market dived, and the US housing market presented a declining tendency. As for China, both real estate market and infrastructure construction market showed an upward trend, mainly caused by Chinese Government’s crackdown on corruption. In the United States, however, the number of new home starts was annualized at 1.001 million units by May, versus a projected number of 1.03 million homes, down 6.5% on a month-on-month basis for new home starts and 3.9% for the projected decrease. And also as of May, the number of building permits was annualized at 991,000 homes compared with an expected number of 1.05 million units. The building permits were down 6.4% from a month earlier while the estimated drop stood at 0.9%. Additionally, the high short-term interest rates in the US hurt the housing market, and this would be worse in 2015. But the power tool market slightly lagged behind the real estate market. So, 2014 is expected to be a good year for power tool market.
In 2013, the global market size of power tools approximated USD16.3 billion, an 8.7% increase, and this figure is expected to reach USD16.8 billion, up 3.1%. But it is projected that the power tool market will shrink by 4.2% in 2015, to USD16.1 billion.
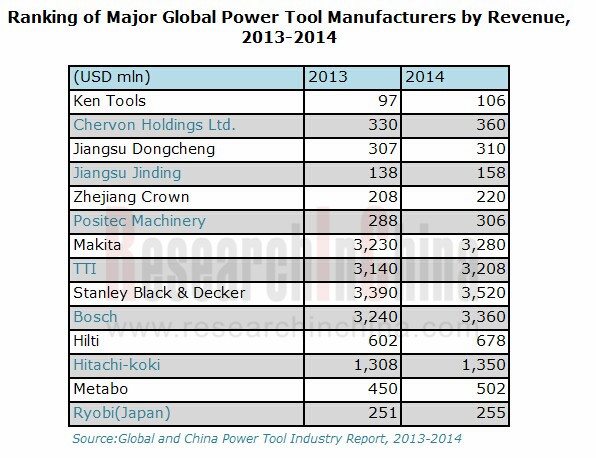
The global power tool market characterizes a quite high market concentration degree, with Stanley Black & Decker’s and TTI’s markets converged in North America, Makita’s and Bosch’s in Europe, Hilti’s in infrastructure construction in Europe and Hitachi-koki’s in Japan and Europe. The revenue of the four giants all outnumbers USD3 billion, and there is a small gap between them.
China is the world's largest power tool manufacturing base, with nearly 80% of global power tools made in China, especially in Jiangsu and Zhejiang. In 2013, China exported a total of 201 million sets of power tool, but only gained USD6.207 billion.
China is endeavoring for a change in its image of low-end manufacturing mainly by means of mergers and acquisitions. Take Chervon for example, it acquired German Flex. Meanwhile, the Chinese enterprises are acquired by foreign companies. For instance, Stanley Black & Decker obtained a 60% stake in Jiangsu Guoqiang in 2013.
第一章、电动工具简介
第二章、电动工具市场与产业
2.1、全球电动工具市场
2.2、全球基础设施建设与建筑市场
2.2.1、欧洲
2.2.2、中东与北非
2.2.3、撒哈拉以南非洲
2.2.4、拉美地区
2.3、美国房地产市场
2.4、电动工具产业
2.5、电动工具用锂电池
2.6、锂电池产业
2.7、中国锂电池产业
第三章、中国电动工具产业与市场
3.1、中国电动工具产业
3.2、中国电动工具市场
3.3、中国房地产市场
第四章、主要电动工具厂家研究
4.1、泉峰控股
4.2、锐奇股份
4.3、江苏东成
4.4、江苏金鼎
4.5、皇冠电动工具
4.6、信源电器
4.7、浙江华丰
4.8、宝时得机械
4.9、MAKITA
4.10、TTI
4.11、STANLEY BLACK & DECKER
4.12、BOSCH
4.13、HILTI
4.14、HITACHI-KOKI
4.15、METABO
4.16、RYOBI
1 Introduction to Power Tools
2 Power Tool Market and Industry
2.1 Global Power Tool Market
2.2 Global Infrastructure Construction and Building Market
2.2.1 Europe
2.2.2 The Middle East and North Africa
2.2.3 Sub-Saharan Africa
2.2.4 Latin America
2.3 Property Market in America
2.4 Power Tool Industry
2.5 Lithium Battery for Power Tool
2.6 Lithium Battery Industry
2.7 Lithium Battery Industry in China
3 Power Tool Industry and Market in China
3.1 Power Tool Industry in China
3.2 Power Tool Market in China
3.3 Property Market in China
4 Major Power Tool Manufacturers
4.1 Chervon Holdings Ltd.
4.2 Shanghai Ken Tools Co., Ltd.
4.3 Jiangsu Dongcheng Power Tools Co., Ltd.
4.4 Jiangsu Jinding Electric Tools Group Co., Ltd
4.5 Zhejiang Crown Electric Tools Manufacture Co., Ltd.
4.6 Zhejiang Xinyuan Electric Appliance Manufacture Co., Ltd.
4.7 Zhejiang Huafeng Electric Tools Co., Ltd.
4.8 Positec Machinery (China) Co., Ltd.
4.9 MAKITA
4.10 TTI
4.11 STANLEY BLACK & DECKER
4.12 BOSCH
4.13 HILTI
4.14 HITACHI-KOKI
4.15 METABO
4.16 RYOBI
2010-2015年全球电动工具市场规模
2010-2015年全球电动工具出货量
2013-2015年全球电动工具市场地域分布
1961-2017年美国房屋开工(Housing Start)量
1984-2017年美国建筑许可(Building Permits)量
1970-2016年美国新屋(New Home)销量
1970-2016年美国 New Home for sale销量
1980-2016年美国新屋平均价格
2013、2014年全球主要电动工具厂家收入排名
2013 年全球锂电池分国家产量构成
2013 年全球锂电池分厂家产量构成
2013年中国前20大锂电池cell企业收入排名
2013年中国前8大锂电池组装企业收入排名
1997-2013年中国电动工具产量
2012、2013年中国电动工具产量地域分布
2009-2015年中国电动工具市场出货量
2009-2015年中国电动工具市场规模
2007-2014年锐奇股份收入与营业利润
2007-2013年锐奇股份资产与负债
2010-2013年锐奇股份收入地域分布
2012-2013年锐奇股份各项费用
2007-2013年锐奇股份研发投入
2010-2013年锐奇股份现金流
浙江华丰主要客户
2008-2015财年Makita销售额与营业利润率
2014财年Makita营业利润分析
Makita全球工厂分布
2011-2015财年Makita销售额地域分布
2011-2015财年Makita产量地域分布
2007-2014财年Makita产量
2009-2014年TTI销售额与营业利润率
2009-2013年TTI资产负债表
TTI全球分布
2011-2013年TTI收入业务分布
2010-2013年TTI收入地域分布
2011-2013年TTI Working Capitalas % of sales
2011-2013年TTI净负债率
2009-2014年Stanley Black & Decker销售额与毛利率
2009-2014年Stanley Black & Decker销售额与EBITDA
2009-2013年Stanley Black & Decker Highlighnts
2009-2013年Stanley Black & Decker净利润
2007-2013年Stanley Black & Decker Working Capital Turns
2009-2014年Stanley Black & Decker现金流
2009-2013年Stanley Black & Decker收入业务分布
2009-2013年Stanley Black & Decker各事业部营业利润率
CDIY事业部主要产品
Q1/2014 Stanley Black & Decker CDIY事业部收入地域分布
2013 Stanley Black & Decker CDIY事业部收入地域分布
2013年Stanley Black & Decker CDIY事业部收入by end market
2013年Stanley Black & Decker Industrial事业部收入产品分布
2013年Stanley Black & Decker Industrial事业部收入地域分布
2008-2014年Bosch收入与税前利润率
2009-2013年Bosch收入业务分布
2009-2013年Bosch收入地域分布
2009-2014年Hilti销售额与营业利润
2009-2013年Hilti净利润、现金流、研发投入
2012、2013年Hilti销售额地域分布
2009-2015财年日立工机Hitachi-koki收入与营业利润
2009-2014财年日立工机Hitachi-koki资产负债
2009-2014财年日立工机Hitachi-koki现金流
2009-2015财年日立工机Hitachi-koki收入业务分布
2009-2015财年日立工机Hitachi-koki 电动工具收入地域分布
2013年2季度-2014年1季度日立工机Hitachi-koki 欧洲区电动工具收入
2011-2015财年日立工机Hitachi-koki 电动工具欧洲区收入
2011-2015财年日立工机Hitachi-koki 电动工具美国区收入
2009-2015财年RYOBI收入与营业利润
2009-2015财年RYOBI收入业务分布
2009-2015财年RYOBI营业利润业务分布
Global Power Tool Market Size, 2010-2015E
Global Power Tool Shipments, 2010-2015E
Market Distribution of Global Power Tools by Region, 2013-2015E
Number of Housing Starts in the United States, 1961-2017E
Number of Building Permits in the United States, 1984-2017E
Number of New Homes in the United States, 1970-2016E
Sales Volume of New Homes in the United States, 1970-2016E
Average Price of New Homes in the United States, 1980-2016E
Ranking of Major Global Power Tool Manufacturers by Revenue, 2013-2014
Output Structure of Global Lithium Battery by Country, 2013
Output Structure of Global Lithium Batteries by Manufacturer, 2013
Ranking of Top 20 Lithium Battery Vendors in China by Revenue, 2013
Ranking of Top 8 Lithium Battery Assembling Manufacturers in China by Revenue, 2013
Output of Power Tools in China, 1997-2013
Output Distribution of Power Tools in China by Region, 2012-2013
China Power Tools Shipments, 2009-2015E
China Power Tools Market Size, 2009-2015E
Revenue and Operating Income of Shanghai Ken Tools, 2007-2014
Assets and Liabilities of Shanghai Ken Tools, 2007-2013
Revenue of Shanghai Ken Tools by Region, 2010-2013
Sundry Expenses of Shanghai Ken Tools, 2012-2013
R&D Costs of Shanghai Ken Tools, 2007-2013
Cash Flow of Shanghai Ken Tools, 2010-2013
Major Customers of Zhejiang Huafeng
Sales and Operating Margin of Makita, FY2008-FY2015
Operating Income of Makita, FY2014
Worldwide Distribution of Makita Factories
Sales Breakdown of Makita by Region, FY2011-FY2015
Output Distribution of Makita by Region, FY2011-FY2015
Output of Makita, FY2007-FY2014
Sales and Operating Margin of TTI, 2009-2014
Balance Sheet of TTI, 2009-2013
Global Presence of TTI
Revenue of TTI by Segment, 2011-2013
Revenue of TTI by Region, 2010-2013
Working Capital of TTI and % of Sales, 2011-2013
Net Asset-liability Ratio of TTI, 2011-2013
Sales and Gross Margin of Stanley Black & Decker, 2009-2014
Sales and EBITDA of Stanley Black & Decker, 2009-2014
Highlights of Stanley Black & Decker, 2009-2013
Net Income of Stanley Black & Decker, 2009-2013
Working Capital Turns of Stanley Black & Decker, 2007-2013
Cash Flow of Stanley Black & Decker, 2009-2014
Revenue of Stanley Black & Decker by Segment, 2009-2013
Operating Margin of Stanley Black & Decker’s Business Divisions, 2009-2013
Main Products of CDIY Business Division
Revenue of Stanley Black & Decker's CDIY Business Division by Region, Q1/2014
Revenue of Stanley Black & Decker's CDIY Business Division by Region, 2013
Revenue of Stanley Black & Decker's CDIY Business Division by End Market, 2013
Revenue of Stanley Black & Decker’s Industrial Business Division by Product, 2013
Revenue of Stanley Black & Decker’s Industrial Business Division by Region, 2013
Revenue and EBIT Margin of Bosch, 2008-2014
Revenue of Bosch by Segment, 2009-2013
Revenue of Bosch by Region, 2009-2013
Sales and Operating Income of Hilti, 2009-2014
Net Income, Cash Flow and R&D Costs of Hilti, 2009-2013
Sales of Hilti by Region, 2012-2013
Revenue and Operating Income of Hitachi-koki, FY2009-FY2015
Assets and Liabilities of Hitachi-koki, FY2009-FY2014
Cash Flow of Hitachi-koki, FY2009-FY2014
Sales of Hitachi-koki by Segment, FY2009-FY2015
Power Tool Revenue Breakdown of Hitachi-koki by Region, FY2009-FY2015
Power Tool Revenue of Hitachi-koki from Europe, Q2/2013-Q1/2014
Power Tool Revenue of Hitachi-koki from Europe, FY2011-FY2015
Power Tool Revenue of Hitachi-koki from America, FY2011-FY2015
Revenue and Operating Income of RYOBI, FY2009-FY2015
Revenue of RYOBI by Segment, FY2009-FY2015
Operating Income of RYOBI by Segment, FY2009-FY2015
如果这份报告不能满足您的要求,我们还可以为您定制报告,请 留言说明您的详细需求。
|