|
|
|
报告导航:研究报告—
制造业—材料
|
|
2013-2016年全球及中国光纤预制棒行业研究报告 |
 |
字数:2.8万 |
页数:108 |
图表数:107 |
|
中文电子版:8500元 |
中文纸版:4250元 |
中文(电子+纸)版:9000元 |
|
英文电子版:2350美元 |
英文纸版:2500美元 |
英文(电子+纸)版:2650美元 |
|
编号:CYH027
|
发布日期:2014-06 |
附件:下载 |
 |
|
|
光纤预制棒是光纤光缆产业链的上游核心材料,占到整个产业链利润的70%左右。
2013年,全球光纤预制棒产量为1.04万吨,同比增长18.2%;需求量为1.01万吨,同比增长16.6%。
目前,中国、日本、美国是全球前三大光纤预制棒生产国和需求国,2013年其产量和需求量合计分别占到全球的84.1%和83.3%。其中,中国位居首位,占比分别为32.9%和59.8%。
受4G、FTTx及LTE等宽带需求的拉动,中国光纤预制棒市场需求快速增长,进而促使其进口量不断增加。2013年,中国光纤预制棒进口量同比增长20.2%至2748.1吨,占中国需求量的45.4%。
美国、日本是中国光纤预制棒主要进口国,2013年合计占中国总进口量的91.3%。为避免进口低价倾销、提高国内产品利润率,中国商务部于2014年3月起对原产于日本和美国的进口光纤预制棒展开反倾销立案调查。
此外,中国光纤预制棒市场需求的日益增长,也吸引了一大批国内外企业进驻。目前,信越、住友、藤仓等国外企业已进入中国光纤预制棒市场;同时亨通光电、中天科技等国内企业也通过升级改造或新建项目等方式增加光纤预制棒产能,以提高竞争力。
亨通光电是中国第二大光纤预制棒生产企业,已具备650吨/年的光纤预制棒生产能力。2013年8月,公司新建年产610吨光纤预制棒项目,预计2015年建成投产。
中天科技是中国具备“光棒—光纤—光缆”等完整产业链生产企业之一。近几年,公司不断扩大光纤预制棒产能,2011-2013年,公司完成一至三期的光纤预制棒项目,形成400吨/年的产能。2014年,公司又启动光纤预制棒的技术升级项目,待年底投产后,公司总产能将提升至600吨/年。
此外,通鼎光电、中利科技和鑫茂科技等主流光纤厂商也纷纷进军光纤预制棒产业。其中,通鼎光电和中利科技的光纤预制棒项目均将于2014年底前投产;鑫茂科技规划的300吨/年单模预制棒项目已获环评通过,正在建设中。

水清木华研究中心《2013-2016年全球及中国光纤预制棒行业研究报告》着重研究了以下内容:
 全球光纤预制棒市场供需、地区分布及价格走势等; 全球光纤预制棒市场供需、地区分布及价格走势等;
中国光纤预制棒行业政策环境、市场供需、进出口、竞争格局及价格走势等;
全球7家、中国6家光纤预制棒企业经营情况、光纤预制棒业务及发展战略等;
2013-2016年中国光纤预制棒企业市场份额及市场规模预测等。
As the core material of the optical fiber and cable industrial chain upstream, optical fiber preform contributes about 70% of the whole industrial chain profits.
In 2013, the global optical fiber preform production reached 10,449 tons, up 18.2% year on year, meeting demand of 10,128 tons, up 16.6% year on year.
As the top three optical fiber preform producers and demanders in the world, China, Japan and the United States combined for 84.1% and 83.3% of the global production and demand, of which, China topped the list, boasting separate proportions of 32.9% and 59.8%.
Pulled by the broadband demand from 4G, FTTx and LTE, the Chinese optical fiber preform market demand is growing rapidly, which then brings ever-increasing import volume. In 2013, the Chinese optical fiber preform imports rose 20.2% year on year to 2,748.1 tons, making up 45.4% of the country’s demand.
The United States and Japan are major importers of Chinese optical fiber preform, altogether taking 91.3% of China’s total imports in 2013. To avoid import price dumping and improve profit margins of domestic products, the Ministry of Commerce of the People’s Republic of China has conducted an anti-dumping investigation on imported optical fiber preform native to Japan and the United States since March 2014.
Moreover, China’s growing market demand for optical fiber preform has also attracted a large number of domestic and foreign enterprises. So far, foreign companies e.g. Shin-Etsu Chemical, Sumitomo Electric Industries and Fujikura have entered the Chinese optical fiber preform market; on the other hand, domestic counterparts such as Hengtong Optic-electric Co., Ltd. and Jiangsu Zhongtian Technology Co., Ltd. are also increasing their capacity of optical fiber preform via upgrading and reconstruction or new projects, for the purpose of sharpening the competitive edge.
As the second largest optical fiber preform manufacturing enterprise in China, Hengtong Optic-electric Co., Ltd. has been provided with the 650 tons/a optical fiber preform production capacity. Its 610 tons/a Optical Fiber Preform Project newly constructed in August 2013 is expected to be completed and put into production in 2015.
Jiangsu Zhongtian Technology Co., Ltd is one of the domestic manufacturers that have a complete industrial chain e.g. optical wand – optical fiber – optical cable. In recent years, it has continuously extended the capacity of optical fiber preform, with 400 tons/a formed upon the completion of the Optical Fiber Preform Project Phase I, II and III in 2011-2013. In 2014, the company initiated the Optical Fiber Preform Technology Upgrade Project, and will see total capacity up to 600 tons/a upon the year-end commissioning.
In addition, Jiangsu Tongding Optic-Electronic Stock Co., Ltd, Zhongli Sci-Tech Group Co.,Ltd, Tianjin Xinmao Science&Technology Co.,Ltd and other mainstream optical fiber manufacturers have also successively marched the optical fiber preform industry. Among them, the first two companies will put their optical fiber preform projects into production by the end of 2014; the 300 tons/a Single-mode Preform Project planned by Tianjin Xinmao Science&Technology has been approved by the EIA General Counsel and is now being built.
Global and China Optical Fiber Preform Industry Report, 2013-2016 by ResearchInChina mainly focuses on the followings:
 Supply and demand, regional distribution, price trend, etc. of the global optical fiber preform market; Supply and demand, regional distribution, price trend, etc. of the global optical fiber preform market;
Policy environment, market supply and demand, import and export, competition pattern, price trend, etc. of the Chinese optical fiber preform industry;
Operation, optical fiber preform business, development strategy, etc. of seven global companies and six Chinese companies;
Market share, market size, etc. of Chinese optical fiber preform enterprises in 2013-2016E.
第一章 光纤预制棒概述
1.1 定义
1.2 生产工艺
1.3 产业链
1.3.1 上游
1.3.2 下游
第二章 全球光纤预制棒行业发展概况
2.1 发展现状
2.2 供需分析
2.2.1 供给分析
2.2.2 需求分析
2.3 地区结构
2.3.1 美国
2.3.2 日本
2.3.3 欧洲
2.4 价格走势
第三章 中国光纤预制棒行业发展概况
3.1 政策环境
3.2 供需分析
3.2.1 供给分析
3.2.2 需求分析
3.3 竞争格局
3.4 进出口
3.4.1 进口
3.4.2 出口
3.5 价格走势
3.5.1 上下游价格
3.5.2 光纤预制棒价格
第四章 全球光纤预制棒生产企业
4.1 美国康宁
4.1.1 企业简介
4.1.2 经营情况
4.1.3 营收构成
4.1.4 研发与投资
4.1.5 光纤业务
4.1.6 在华发展
4.1.7 康宁上海
4.2 住友电工
4.2.1 企业简介
4.2.2 经营情况
4.2.3 信息通信业务
4.2.4 在华发展
4.2.5 成都中住光纤
4.3 信越化工
4.3.1 企业简介
4.3.2 经营情况
4.3.3 营收构成
4.3.4 电子与功能材料业务
4.3.5 在华发展
4.4 日本藤仓
4.4.1 企业简介
4.4.2 经营情况
4.4.3 营收构成
4.4.4 Power & Telecommunications业务
4.4.5 在华发展
4.4.6 藤仓烽火光电
4.5 普睿司曼
4.5.1 企业简介
4.5.2 经营情况
4.5.3 营收构成
4.5.4 电信业务
4.5.5 投资
4.5.6 在华发展
4.6 古河电力
4.6.1 企业简介
4.6.2 经营情况
4.6.3 电信业务
4.6.4 在华发展
4.6.5 苏州古河
4.7 荷兰特恩驰
4.7.1 企业简介
4.7.2 经营情况
4.7.3 营收构成
4.7.4 电信业务
4.7.5 在华发展
4.7.6 南京特恩驰
4.7.7 张家港特恩驰电缆
第五章 中国光纤预制棒生产企业
5.1 长飞公司
5.1.1 企业简介
5.1.2 经营情况
5.1.3 研发与投资
5.1.4 发展前景
5.2 亨通光电(600487)
5.2.1 企业简介
5.2.2 经营情况
5.2.3 营收构成
5.2.4 毛利率
5.2.5 研发
5.2.6 在建项目
5.2.7 光纤预制棒业务
5.2.8 发展前景
5.3 中天科技(600522)
5.3.1 企业简介
5.3.2 经营情况
5.3.3 营收构成
5.3.4 毛利率
5.3.5 客户与供应商
5.3.6 研发与投资
5.3.7 光纤预制棒业务
5.3.8 发展前景
5.4 烽火通信(600498)
5.4.1 企业简介
5.4.2 经营情况
5.4.3 营收构成
5.4.4 毛利率
5.4.5 研发与投资
5.4.6 光纤预制棒业务
5.4.7 发展前景
5.5 富通集团
5.5.1 企业简介
5.5.2 经营情况
5.5.3 营收构成
5.5.4 毛利率
5.5.5 在建项目
5.5.6 光纤预制棒业务
5.5.7 发展前景
5.6 普法公司
5.6.1 企业简介
5.6.2 在建工程
5.6.3 光纤预制棒业务
第六章 结论与预测
6.1 结论
6.2 预测
1. Overview of Optical Fiber Preform
1.1 Definition
1.2 Production Technology
1.3 Industry Chain
1.3.1 Upstream
1.3.2 Downstream
2. Development of Global Optical Fiber Preform Industry
2.1 Status Quo
2.2 Supply & Demand
2.2.1 Supply
2.2.2 Demand
2.3 Regional Structure
2.3.1 USA
2.3.2 Japan
2.3.3 Europe
2.4 Price Trend
3. Development of China Optical Fiber Preform Industry
3.1 Policy Environment
3.2 Supply & Demand
3.2.1 Supply
3.2.2 Demand
3.3 Competition Pattern
3.4 Import & Export
3.4.1 Import
3.4.2 Export
3.5 Price Trend
3.5.1 Upstream & Downstream
3.5.2 Optical Fiber Preform
4. Global Optical Fiber Preform Companies
4.1 Corning
4.1.1 Profile
4.1.2 Operation
4.1.3 Revenue Structure
4.1.4 R&D and Investment
4.1.5 Optical Fiber
4.1.6 Development in China
4.1.7 Corning Cable Systems (Shanghai) Company, Ltd.
4.2 Sumitomo Electric Industries
4.2.1 Profile
4.2.2 Operation
4.2.3 Information & Communication
4.2.4 Development in China
4.2.5 Chengdu SEI Optical Fiber Co., Ltd.
4.3 Shin-Etsu Chemical
4.3.1 Profile
4.3.2 Operation
4.3.3 Revenue Structure
4.3.4 Electronics & Functional Materials
4.3.5 Development in China
4.4 Fujikura
4.4.1 Profile
4.4.2 Operation
4.4.3 Revenue Structure
4.4.4 Power & Telecommunications
4.4.5 Development in China
4.4.6 Fujikura FiberHome Opto-Electronic Material Technology Co.,Ltd. (FFOE)
4.5 Prysmian
4.5.1 Profile
4.5.2 Operation
4.5.3 Revenue Structure
4.5.4 Telecommunications Service
4.5.5 Investment
4.5.6 Development in China
4.6 Furukawa Electric
4.6.1 Profile
4.6.2 Operation
4.6.3 Telecommunications Service
4.6.4 Development in China
4.6.5 Suzhou Furukawa Power Optic Cable Co., Ltd. (SFPOC)
4.7 NV Twentsche Kabel Holding (TKH)
4.7.1 Profile
4.7.2 Operation
4.7.3 Revenue Structure
4.7.4 Telecommunications Service
4.7.5 Development in China
4.7.6 Twentsche (Nanjing) Fibre Optics Ltd. (TFO)
4.7.7 Zhangjiagang Twentsche Cable Co., Ltd. (ZTC)
5. Chinese Optical Fiber Preform Companies
5.1 Yangtze Optical Fibre and Cable Company Ltd. (YOFC)
5.1.1 Profile
5.1.2 Operation
5.1.3 R&D and Investment
5.1.4 Development Prospect
5.2 Hengtong Optic-electric Co., Ltd. (600487)
5.2.1 Profile
5.2.2 Operation
5.2.3 Revenue Structure
5.2.4 Gross Margin
5.2.5 R&D
5.2.6 Projects under Construction
5.2.7 Optical Fiber Preform
5.2.8 Development Prospect
5.3 Jiangsu Zhongtian Technology Co., Ltd. (600522)
5.3.1 Profile
5.3.2 Operation
5.3.3 Revenue Structure
5.3.4 Gross Margin
5.3.5 Clients and Suppliers
5.3.6 R&D and Investment
5.3.7 Optical Fiber Preform
5.3.8 Development Prospect
5.4 FiberHome Telecommunication Technologies Co., Ltd. (600498)
5.4.1 Profile
5.4.2 Operation
5.4.3 Revenue Structure
5.4.4 Gross Margin
5.4.5 R&D and Investment
5.4.6 Optical Fiber Preform
5.4.7 Development Prospect
5.5 Futong Group
5.5.1 Profile
5.5.2 Operation
5.5.3 Revenue Structure
5.5.4 Gross Margin
5.5.5 Projects under Construction
5.5.6 Optical Fiber Preform
5.5.7 Development Prospect
5.6 Potevio Fasten Optical Communication Co.,Ltd. (PUTIAN-FASTEN)
5.6.1 Profile
5.6.2 Projects under Construction
5.6.3 Optical Fiber Preform
6. Conclusion and Forecast
6.1 Conclusion
6.2 Forecast
图:光纤预制棒芯棒和包层示意图
表:光纤预制棒芯棒制造工艺对比
图:2013年光纤预制棒芯棒工艺分布比例
图:2013年中国光纤预制棒(分原材料)成本构成
图:光纤预制棒下游产业链
图:2010-2013年全球光纤预制棒产能与产量
图:2010-2013年全球光纤预制棒需求量
表:2010-2013年全球光纤预制棒(分国家/地区)产能及市场份额
图:2010-2013年全球(分国家/地区)光纤预制棒需求量
表:2010-2013年美国光纤预制棒产能、产量与需求量
表:2010-2013年日本光纤预制棒产能、产量与需求量
图:2000-2014年全球光纤预制棒价格
表:2010-2014年中国光纤预制棒行业相关政策
图:2007-2014年中国光纤预制棒产量及同比增长
表:2014-2016年中国光纤预制棒主要建设项目
图:2010-2014年中国光纤预制棒需求量及同比增长
图:2007-2014年中国光纤预制棒自给率
表:中国光纤预制棒主要生产企业股东构成及使用技术
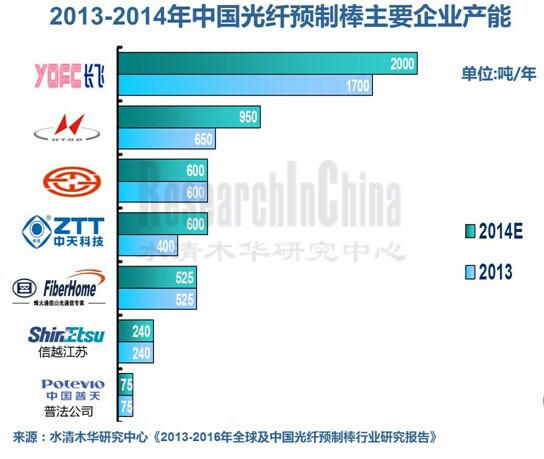
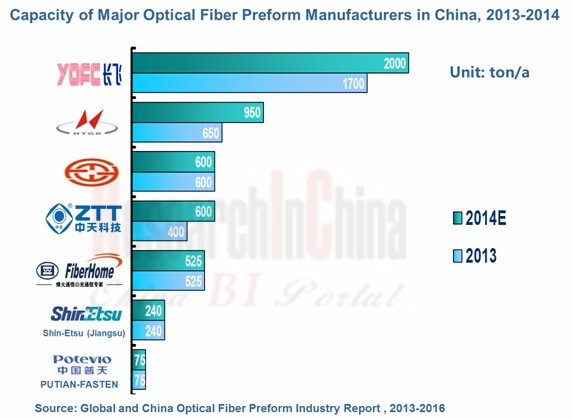
表:2013-2014年中国光纤预制棒(分企业)光棒、光纤、光缆产能与产量
图:2010-2014年中国光纤预制棒进口量及同比增长
图:2013年中国光纤预制棒(分国家)进口量构成
图:2010-2014年中国光纤预制棒进口金额及同比增长
图:2010-2014年中国光纤预制棒出口量及同比增长
图:2013年中国光纤预制棒(分国家)出口量及构成
图:2010-2014年中国光纤预制棒出口金额及同比增长
图:2004-2014年中国光纤光缆集中采购价格
图:2010-2013年中国光纤预制棒平均价格
图:2009-2014年康宁营业收入与净利润
图:2012-2013年康宁公司(分产品)营业收入及构成
表:2010-2013年康宁公司(分地区/国家)营业收入及构成
图:2009-2013年康宁研发投入与占比
图:2011-2013年康宁电信业务部(分产品)营业收入
图:2009-2013年康宁公司在中国营业收入及占比
图:2006-2009年康宁光缆系统(上海)主营业务收入和利润总额
图:FY2009-FY2014年住友电工销售额及净利润
图:2009-2013财年住友电工信息与通信业务销售额
图:FY2011-FY2013年住友电工在中国销售额
图:2009-2013年成都中住光纤营业务收入
图:2014年信越化工(分部门)产品
图:FY2011-FY2014年信越化工营业收入与净利润
图:FY2014年信越化工(分业务)销售额构成
表:FY2013-FY2014年信越化工(分地区)销售额及构成
图:FY2010-FY2014年信越化工电子与功能材料部门营业收入与营业利润
图:FY2012-FY2014年信越化工在中国营业收入及占比
图:FY2010-FY2014年日本藤仓销售额与净利润
表:FY2013-FY2014年藤仓(分业务)销售额及构成
表:FY2012-FY2014年日本藤仓(分地区)销售额及构成
图:FY2012-FY2014财年藤仓在中国销售额
图:2011-2013年藤仓烽火光电材料公司营业收入与净利润
图:2011-2014年普睿司曼营业收入与净利润
图:2013年普睿司曼(分业务)营业收入构成
图:2013年普睿司曼(分地区)营业收入构成
图:2013年普睿司曼电信业务(分地区)销售额构成
图:2013年普睿司曼电信业务(分产品)销售额构成
表:普睿司曼在中国子公司分布
图:FY2009-FY2014年古河电力营业收入与净利润
图:FY2010-FY2014年古河电力电信业务销售额及营业利润
表:FY2012-FY2014年古河电力电信业务(分产品)销售额及构成
图:2007-2009年苏州古河主营业务收入和利润总额
图:2009-2013年特恩驰营业收入与净利润
表:2012-2013年特恩驰(分业务)收入构成
图:2012-2013年特恩驰(分地区)收入构成
图:2013年特恩驰公司电信业务(分产品)收入构成、业务模式及市场
图:2005-2009年南京特恩驰主营业务收入和利润总额
图:2007-2009年张家港特恩驰主营业务收入和利润总额
图:2007-2013年长飞公司营业收入与净利润
图:2006-2013年长飞公司光纤预制棒产量
表:2010-2014年长飞公司主要研发投资项目
表:2012-2016年长飞公司营业收入与净利润
图:2008-2014年亨通光电营业收入与净利润
表:2011-2013年亨通光电(分产品)产销量及产销率
表:2011-2013年亨通光电(分产品)主营业务收入及构成
表:2009-2013年亨通光电(分地区)主营业务收入及构成
图:2011-2013年亨通光电光通信产品毛利率
图:2009-2013年亨通光电研发费用及占比
表:2014年亨通光电主要在建项目
表:2010-2015年亨通光电光纤预制棒产能
图:2010-2014年亨通光电光纤预制棒产量与销量
表:2012-2016年亨通光电营业收入与净利润
图:2008-2014年中天科技营业收入与净利润
表:2009-2013年中天科技(分产品)主营业务收入及构成
图:2008-2013年中天科技(分地区)主营业务收入及构成
图:2008-2013年中天科技主要产品毛利率
表:2009-2013年中天科技前五名客户营业收入贡献及占比
表:2009-2013年中天科技前五名供应商采购金额及占比
图:2009-2013年中天科技研发费用及占比
图:2010-2014年中天科技光纤预制棒产量
表:2012-2016年中天科技营业收入与净利润
图:2008-2014年烽火通信营业收入和净利润
图:2008-2013年烽火通信(分产品)主营业务收入
图:2008-2013年烽火通信(分地区)主营业务收入
图:2008-2013年烽火通信(分产品)毛利率
表:2011-2013年烽火通信研发投入及占比
图:2010-2014年烽火通信光纤预制棒产量
表:2012-2016年烽火通信营业收入与净利润
图:2009-2014年富通集团营业收入与净利润
表:2010-2013年富通集团(分业务)主营业务收入及构成
表:2012-2013年富通集团(分产品)主营业务收入及构成
图:2009-2013年富通集团(分产品)毛利率
表:2014年富通集团主要在建项目
图:2009-2016年富通集团光纤预制棒产能及产量
表:2012-2016年富通集团营业收入与净利润
图:2006-2014年普法公司光纤预制棒自产能与产量
图:2013-2014年中国光纤预制棒企业按产能市场份额
图:2013-2014年中国光纤预制棒主要生产企业营业收入及同比增长
图:2013-2016年全球光纤预制棒产量与需求量
图:2013-2016年中国光纤预制棒产量与需求量
Optical Fiber Preform Mandrel and Cladding Diagram
Manufacturing Process Comparison of Optical Fiber Preform Mandrel
Optical Fiber Preform Mandrel Process Distribution Proportion, 2013
China’s Optical Fiber Preform Cost Structure (by Raw Materials), 2013
Optical Fiber Preform Downstream Industry Chain
Global Optical Fiber Preform Capacity and Output, 2010-2013
Global Optical Fiber Preform Demand, 2010-2013
Global Optical Fiber Preform Capacity and Market Share (by Country / Region), 2010-2013
Global Optical Fiber Preform Demand (by Country / Region), 2010-2013
U.S. Optical Fiber Preform Capacity, Output and Demand, 2010-2013
Japan’s Optical Fiber Preform Capacity, Output and Demand, 2010-2013
Global Optical Fiber Preform Price, 2000-2014
Policies on China Optical Fiber Preform Industry, 2010-2014
China’s Optical Fiber Preform Output and YoY Growth, 2007-2014
Main Optical Fiber Preform Projects in China, 2014-2016E
China’s Optical Fiber Preform Demand and YoY Growth, 2010-2014
China’s Self-sufficiency Rate of Optical Fiber Preform, 2007-2014
Shareholder Structure and Technologies of Major Optical Fiber Preform Manufacturers in China
Capacity and Output of Optical Wand, Optical Fiber and Optical Cable of Chinese Optical Fiber Preform Enterprises, 2013-2014
China’s Optical Fiber Preform Import Volume and YoY Growth, 2010-2014
China’s Optical Fiber Preform Import Volume Breakdown (by Country), 2013
China’s Optical Fiber Preform Import Value and YoY Growth, 2010-2014
China’s Optical Fiber Preform Export Volume and YoY Growth, 2010-2014
China’s Optical Fiber Preform Export Volume Breakdown (by Country), 2013
China’s Optical Fiber Preform Export Value and YoY Growth, 2010-2014
China’s Centralized Purchasing Price of Optical Fiber and Cable, 2004-2014
China’s Average Price of Optical Fiber Preform, 2010-2013
Revenue and Net Income of Corning, 2009-2014
Revenue Breakdown of Corning (by Product), 2012-2013
Revenue Breakdown of Corning (by Region / Country), 2010-2013
Corning’s R & D Investment and % of Total Revenue, 2009-2013
Revenue of Corning's Telecommunications Business Unit (by Product), 2011-2013
Corning’s Revenue in China and % of Total Revenue, 2009-2013
Operating Revenue and Total Profit of Corning Cable Systems (Shanghai), 2006-2009
Sales and Net Income of Sumitomo Electric Industries, FY2009-FY2014
Information & Communication Sales of Sumitomo Electric Industries, FY2009-2013
Sales of Sumitomo Electric Industries in China, FY2011-FY2013
Revenue of Chengdu SEI Optical Fiber, 2009-2013
Products of Shin-Etsu Chemical (by Division), 2014
Revenue and Net Income of Shin-Etsu Chemical, FY2011-FY2014
Sales Structure of Shin-Etsu Chemical (by Business), FY2014
Sales Structure of Shin-Etsu Chemical (by Region), FY2013-FY2014
Revenue and Operating Income of Electronics & Functional Materials Division of Shin-Etsu Chemical, FY2010-FY2014
Revenue of Shin-Etsu Chemical in China and % of Total Revenue, FY2012-FY2014
Fujikura’s Sales and Net Income, FY2010-FY2014
Fujikura’s Sales Structure (by Business), FY2013-FY2014
Fujikura’s Sales Structure (by Region), FY2012-FY2014
Fujikura’s Sales in China, FY2012-FY2014
Revenue and Net Income of FFOE, 2011-2013
Prysmian’s Revenue and Net Income, 2011-2014
Prysmian’s Revenue Structure (by Business), 2013
Prysmian’s Revenue Structure (by Region), 2013
Prysmian’s Telecommunications Service Sales Structure (by Region), 2013
Prysmian’s Telecommunications Service Sales Structure (by Product), 2013
Distribution of Prysmian's Subsidiaries in China
Revenue and Net Income of Furukawa Electric, FY2009-FY2014
Telecommunications Service Sales and Operating Income of Furukawa Electric, FY2010-FY2014
Telecommunications Service Sales Structure of Furukawa Electric (by Product), FY2012-FY2014
Operating Revenue and Total Profit of SFPOC, 2007-2009
TKH’s Revenue and Net Income, 2009-2013
TKH’s Revenue Structure (by Business), 2012-2013
TKH’s Revenue Structure (by Region), 2012-2013
TKH’s Telecommunications Service Revenue Structure (by Product), Business Models and Markets, 2013
Operating Revenue and Total Profit of TFO, 2005-2009
Operating Revenue and Total Profit of ZTC, 2007-2009
Revenue and Net Income of YOFC, 2007-2013
Optical Fiber Preform Output of YOFC, 2006-2013
Key R&D and Investment Projects of YOFC, 2010-2014
Revenue and Net Income of YOFC, 2012-2016E
Revenue and Net Income of Hengtong Optic-electric, 2008-2014
Output, Sales Volume and Sales-Output Ratio of Hengtong Optic-electric (by Product), 2011-2013
Operating Revenue Structure of Hengtong Optic-electric (by Product), 2011-2013
Operating Revenue Structure of Hengtong Optic-electric (by Region), 2009-2013
Gross Margin of Optical Communication Products of Hengtong Optic-electric, 2011-2013
R&D Costs and % of Total Revenue of Hengtong Optic-electric, 2009-2013
Major Projects under Construction of Hengtong Optic-electric, 2014
Optical Fiber Preform Capacity of Hengtong Optic-electric, 2010-2015E
Optical Fiber Preform Output and Sales Volume of Hengtong Optic-electric, 2010-2014
Revenue and Net Income of Hengtong Optic-electric, 2012-2016E
Revenue and Net Income of Jiangsu Zhongtian Technology, 2008-2014
Operating Revenue Structure of Jiangsu Zhongtian Technology (by Product), 2009-2013
Operating Revenue Structure of Jiangsu Zhongtian Technology (by Region), 2008-2013
Gross Margin of Major Products of Jiangsu Zhongtian Technology, 2008-2013
Revenue of Jiangsu Zhongtian Technology’s Revenue from Top 5 Clients and % of Total Revenue, 2009-2013
Procurement of Jiangsu Zhongtian Technology from Top 5 Suppliers and % of Total Procurement, 2009-2013
R&D Costs and % of Total Revenue of Jiangsu Zhongtian Technology, 2009-2013
Optical Fiber Preform Output of Jiangsu Zhongtian Technology, 2010-2014
Revenue and Net Income of Jiangsu Zhongtian Technology, 2012-2016E
Revenue and Net Income of FiberHome Telecommunication Technologies, 2008-2014
Operating Revenue of FiberHome Telecommunication Technologies (by Product), 2008-2013
Operating Revenue of FiberHome Telecommunication Technologies (by Region), 2008-2013
Gross Margin of FiberHome Telecommunication Technologies (by Product), 2008-2013
R&D Costs and % of Total Revenue of FiberHome Telecommunication Technologies, 2011-2013
Optical Fiber Preform Output of FiberHome Telecommunication Technologies, 2010-2014
Revenue and Net Income of FiberHome Telecommunication Technologies, 2012-2016E
Revenue and Net Income of Futong Group, 2009-2014
Operating Revenue Structure of Futong Group (by Business), 2010-2013
Operating Revenue Structure of Futong Group (by Product), 2012-2013
Gross Margin of Futong Group (by Product), 2009-2013
Major Projects under Construction of Futong Group, 2014
Optical Fiber Preform Capacity and Output of Futong Group, 2009-2016E
Revenue and Net Income of Futong Group, 2012-2016E
Optical Fiber Preform Capacity and Output of PUTIAN-FASTEN, 2006-2014
Market Share of Chinese Optical Fiber Preform Enterprises by Capacity, 2013-2014
Revenue and YoY Growth of Major Chinese Optical Fiber Preform Enterprises, 2013-2014
Global Optical Fiber Preform Output and Demand, 2013-2016E
China’s Optical Fiber Preform Output and Demand, 2013-2016E
如果这份报告不能满足您的要求,我们还可以为您定制报告,请 留言说明您的详细需求。
|