|
|
|
报告导航:研究报告—
制造业—化工
|
|
2013-2016年中国润滑油行业研究报告 |
 |
字数:3.4万 |
页数:104 |
图表数:109 |
|
中文电子版:8000元 |
中文纸版:4000元 |
中文(电子+纸)版:8500元 |
|
英文电子版:2250美元 |
英文纸版:2400美元 |
英文(电子+纸)版:2550美元 |
|
编号:ZLC-005
|
发布日期:2014-07 |
附件:下载 |
 |
|
|
在全球经济低速增长大环境下,虽然中国汽车产量与保有量保持较快增长,但工程机械制造业、运输业、建筑业等产业发展放缓,大大降低了中国润滑油市场景气度。2013年中国润滑油产销大幅下滑,其中产量同比下降30.2%,仅为589.69万吨。
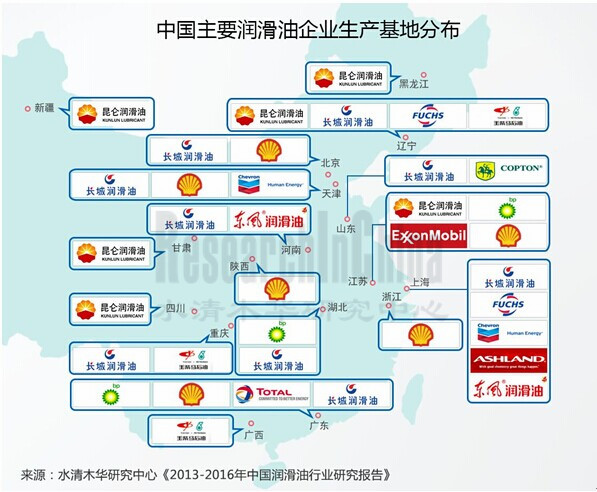
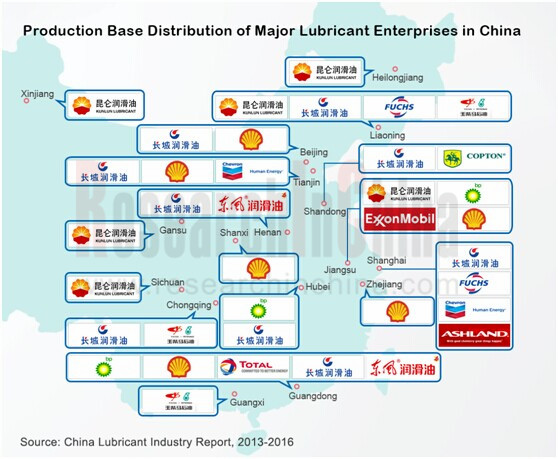
受资源分布影响,中国润滑油行业区域特性明显,产区主要分布在华东、东北及华北地区。2013年,中国润滑油产量位列前四的省市分别为辽宁、山东、上海和广东。其中辽宁省产量为139.11万吨,占全国产量的23.8%。
截至2013年底,中国润滑油生产企业达4000家以上。以长城(中石化)、昆仑(中石油)为代表的国营品牌和包括壳牌(Shell)、美孚、BP、福斯、道达尔在内的外资品牌占据着中国润滑油绝大部分市场。2013年,长城和昆仑润滑油市场份额合计占比51.2%,而外资企业共占29.9%。
与此同时,中国民营润滑油企业也不断发挥各自的优势,在竞争激烈的中国润滑油市场中占据了一席之地如德联集团、高科石化、舜能科技等。
德联集团通过建立“贴厂基地”,与上游企业和下游整车厂建立长期稳定的合作关系。目前,公司拥有长春、上海、成都、佛山四个基地,并已成为上海大众、一汽大众、上海通用等多家知名汽车生产厂的润滑油定点供应商。
高科石化是国内变压器油重要供应商之一,客户包括徐工集团、钱江电气、申达电气、长城电器等。通过淘汰落后产能、设备改造、募投建设新厂等措施,2013年底其润滑油总产能达12.16万吨。但受下游变压器需求下滑等影响,同期公司产能利用率仅为80.6%。
《2013-2016年中国润滑油行业研究报告》包括以下内容:
 中国润滑油行业市场供给、市场需求、进出口分析、竞争格局等; 中国润滑油行业市场供给、市场需求、进出口分析、竞争格局等;
中国润滑油上游(包括基础油和添加剂)市场供需、竞争格局、进出口分析等;
中国废润滑油回收市场发展现状、政策与法规、再生项目和市场供需等;
全球8家、中国8家润滑油企业经营情况、润滑油业务等。
近年来,中国对废润滑油的回收利用越来越重视,并颁布了一系列的利好政策。但目前中国废油回收再利用率较低,仅占润滑油消费市场的6%-8%。不过,中国废润滑油的理论年产量在300万吨以上,发展潜力较大。目前已有多项废润滑油再生项目在建或投产如宝钢发展投资建设的年再生能力7000吨的宝钢废旧油处理项目、福建三钢集团研发的废旧机油再生项目、唐山优艺胜星再生资源有限公司年处理6万吨的废机油再生项目等。
Amid the slow growth of the global economy, although China's automobile output and ownership maintain rapid growth, the development of construction machinery manufacturing industry, transportation industry, construction industry and other industries slows down, which greatly depresses the boom of Chinese lubricant market. In 2013, China’s lubricant output and sales volume fell sharply, wherein the output plunged by 30.2% year on year to 5,896,900 tons.
Affected by the distribution of resources, China lubricant industry is featured with apparent regional characteristics. Production areas mainly concentrate in East China, Northeast China and North China. In 2013, Liaoning, Shandong, Shanghai and Guangdong ranked the top four Chinese provinces by lubricant output. Particularly, Liaoning produced 1,391,100 tons, accounting for 23.8% of the national output.
By the end of 2013, there had been over 4,000 Chinese lubricant production enterprises. State-owned brands represented by Great Wall (Sinopec) and Kunlun (CNPC) as well as foreign brands including Shell, Mobil, BP, FUCHS and Total occupied most share of Chinese lubricant market. In 2013, Great Wall and Kunlun seized 51.2% market share together, while foreign companies grasped 29.9%.
At the same time, Chinese private lubricant companies also showed their strengths to take places in the fiercely competitive Chinese lubricant market, such as Delian Group, Tech petrochemical and Sure Energy Tech.
Delian Group has established long-term stable cooperative relations with upstream and downstream enterprises through “parts production bases near downstream vehicle plants”. Currently, the company has four bases in Changchun, Shanghai, Chengdu and Foshan, and has become the designated lubricant supplier of Shanghai Volkswagen, FAW-Volkswagen, Shanghai GM and many other well-known automakers.
Gaoke Petrochemical, one of important suppliers of transformer oil, serves XCMG, Qianjiang Electric, Shenda Electric and CNC Electric. Through the elimination of backward capacity, equipment modification, building of new plants and other measures, the company’s total lubricant capacity amounted to 121,600 tons at the end of 2013. But due to the decreasing demand for downstream transformers and other factors, the company’s capacity utilization rate was only 80.6% at that time.
The report highlights:
 Market supply & demand, competition pattern, import & export of China lubricant industry; Market supply & demand, competition pattern, import & export of China lubricant industry;
Market supply & demand, competition pattern, import & export of raw materials (base oil and additive) of China lubricant industry;
Status quo, policies and regulations, regeneration projects, supply and demand of China waste lubricant recycling market;
Operation and lubricant business of 8 global and 8 Chinese lubricant companies.
In recent years, China has attached more importance to the recycling of waste lubricant, and issued a series of favorable policies. However, China only recycles and reuses 6% -8% of lubricant. In theory, China's annual output of waste lubricant hit 3 million tons or more, embodying huge development potentials. At present, a number of waste lubricant regeneration projects are under construction or go into operation, such as Baosteel’s 7,000 t/a waste lubricant project, Fujian Sanming Steel’s waste lubricant regeneration project, Tangshan You Yi Sheng Xing's 60,000 t/a waste lubricant regeneration project.
第一章 润滑油及润滑油基础油概述
1.1 润滑油的定义
1.2 主要润滑油简介
1.2.1 内燃机油
1.2.2 齿轮油
1.2.3 液压油
第二章 中国润滑油市场发展概况
2.1 国际市场环境
2.1.1 总体概况
2.1.2 原油市场
2.2 国内市场环境
2.2.1 市场供给
2.2.2 市场需求
2.2.3 宏观经济环境
2.3 进出口分析
2.3.1 进口分析
2.3.2 出口分析
2.4 竞争格局
第三章 中国润滑油行业上游行业发展概况
3.1 基础油
3.1.1 市场供需
3.1.2 竞争格局
3.1.3 进出口分析
3.2 添加剂
第四章 中国废润滑油回收市场发展概况
4.1 政策与法规
4.2 发展现状
4.3 再生项目
4.4 市场供需
第五章 全球供应商
5.1 Shell
5.1.1 公司简介
5.1.2 经营情况
5.1.3 在华润滑油业务
5.1.4 壳牌统一
5.2 BP
5.2.1 公司简介
5.2.2 经营情况
5.2.3 BP润滑油
5.2.4 在华润滑油业务
5.3 ExxonMobil
5.3.1 公司简介
5.3.2 经营情况
5.3.3 润滑油业务
5.3.4 在华润滑油业务
5.4 Chevron
5.4.1 公司简介
5.4.2 经营情况
5.4.3 在华润滑油业务
5.5 Total
5.5.1 公司简介
5.5.2 经营情况
5.5.3 在华润滑油业务
5.6 FUCHS
5.6.1 公司简介
5.6.2 在华润滑油业务
5.7 ASHLAND
5.7.1 公司简介
5.7.2 经营情况
5.7.3 在华润滑油业务
5.8 康菲
5.8.1 公司简介
5.8.2 经营情况
5.8.3 在华润滑油业务
第六章 中国生产商
6.1 中国石油
6.1.1 公司简介
6.1.2 经营情况
6.1.3 营收构成
6.1.4 毛利率
6.1.5 润滑油业务
6.1.6 预测与展望
6.2 中国石化
6.2.1 公司简介
6.2.2 经营情况
6.2.3 营收构成
6.2.4 毛利率
6.2.5 润滑油业务
6.2.6 预测与展望
6.3 德联集团
6.3.1 公司简介
6.3.2 经营情况
6.3.3 营收构成
6.3.4 毛利率
6.3.5 润滑油业务
6.3.6 研发与投资
6.3.7 预测与展望
6.4 高科石化
6.4.1 公司简介
6.4.2 经营情况
6.4.3 营收构成
6.4.4 毛利率
6.4.5 研发
6.4.6 产能与产销
6.4.7 采购情况
6.4.8 预测与展望
6.5 康普顿
6.5.1 公司简介
6.5.2 经营情况
6.5.3 营收构成
6.5.4 毛利率
6.5.5 研发
6.5.6 产能与产销
6.5.7 供销情况
6.5.8 预测与展望
6.6 舜能科技
6.6.1 公司简介
6.6.2 经营情况
6.6.3 毛利率
6.6.4 供销情况
6.7 其他企业
6.7.1 龙蟠科技
6.7.2 利迪欣科
第七章 预测与展望
7.1 润滑油产量预测
7.2 主要公司经营对比
7.2.1 营业收入
7.2.2 净利润
7.2.3 毛利率
1. Overview of Lubricant and Lubricant Base Oil
1.1 Definition of Lubricant
1.2 Major Lubricant
1.2.1 Internal Combustion Engine Oil
1.2.2 Gear Oil
1.2.3 Hydraulic Oil
2. Development of China Lubricant Market
2.1 International Market Environment
2.1.1 Overview
2.1.2 Crude Oil Market
2.2 Domestic Market Environment
2.2.1 Supply
2.2.2 Demand
2.2.3 Macroeconomic Environment
2.3 Import and Export
2.3.1 Import
2.3.2 Export
2.4 Competition Pattern
3. Overview of Chinese Lubricant Upstream Industries
3.1 Base Oil
3.1.1 Supply & Demand
3.1.2 Competition Pattern
3.1.3 Import & Export
3.2 Additive
4. Overview of Chinese Waste Lubricant Recovery Market
4.1 Policies and Regulations
4.2 Current Development
4.3 Regeneration Projects
4.4 Supply & Demand
5. Global Suppliers
5.1 Shell
5.1.1 Profile
5.1.2 Operation
5.1.3 Lubricant Business in China
5.1.4 Shell Tongyi
5.2 BP
5.2.1 Profile
5.2.2 Operation
5.2.3 BP Lubricant
5.2.4 Lubricant Business in China
5.3 ExxonMobil
5.3.1 Profile
5.3.2 Operation
5.3.3 Lubricant Business
5.3.4 Lubricant Business in China
5.4 Chevron
5.4.1 Profile
5.4.2 Operation
5.4.3 Lubricant Business in China
5.5 Total
5.5.1 Profile
5.5.2 Operation
5.5.3 Lubricant Business in China
5.6 FUCHS
5.6.1 Profile
5.6.2 Lubricant Business in China
5.7 ASHLAND
5.7.1 Profile
5.7.2 Operation
5.7.3 Lubricant Business in China
5.8 ConocoPhillips
5.8.1 Profile
5.8.2 Operation
5.8.3 Lubricant Business in China
6. Chinese Producers
6.1 CNPC
6.1.1 Profile
6.1.2 Operation
6.1.3 Revenue Structure
6.1.4 Gross Margin
6.1.5 Lubricant Business
6.1.6 Forecast and Outlook
6.2 Sinopec
6.2.1 Profile
6.2.2 Operation
6.2.3 Revenue Structure
6.2.4 Gross Margin
6.2.5 Lubricant Business
6.2.6 Forecast and Outlook
6.3 Delian Group
6.3.1 Profile
6.3.2 Operation
6.3.3 Revenue Structure
6.3.4 Gross Margin
6.3.5 Lubricant Business
6.3.6 R & D and Investment
6.3.7 Forecast and Outlook
6.4 Gaoke Petrochemical
6.4.1 Profile
6.4.2 Operation
6.4.3 Revenue Structure
6.4.4 Gross Margin
6.4.5 R & D
6.4.6 Capacity, Output and Sales Volume
6.4.7 Procurement
6.4.8 Forecast and Outlook
6.5 Copton
6.5.1 Profile
6.5.2 Operation
6.5.3 Revenue Structure
6.5.4 Gross Margin
6.5.5 R & D
6.5.6 Capacity, Output and Sales Volume
6.5.7 Supply and Marketing
6.5.8 Forecast and Outlook
6.6 Sure Energy Tech.
6.6.1 Profile
6.6.2 Operation
6.6.3 Gross Margin
6.6.4 Supply and Marketing
6.7 Other Enterprises
6.7.1 Lopal
6.7.2 Lidi
7 Forecast and Outlook
7.1 Prediction of Lubricant Output
7.2 Performance Comparison between Major Companies
7.2.1 Revenue
7.2.2 Net Income
7.2.3 Gross Margin
表:API-1509基础油分类标准
表:Q/SHR001-95润滑油基础油分类 及代号
图:2013年全球润滑油市场消费结构(按用途)
图:2004-2013年全球润滑油需求量及同比变化情况
图:2013年世界主要地区润滑油需求比重
图:1990-2014E世界原油价格波动情况
图:1990-2013年中国润滑油产量及同比增长率
图:2008-2013年中国润滑油主产区产量(分省市)
图:2009-2013年中国润滑油表观消费量及同比增长率
图:2003-2013年中国GDP及同比增长率
图:1980-2013年中国城市和农村家庭恩格尔系数
图:2013年1-12月中国润滑油进口依赖度和自给率
图:2009-2013年中国润滑油进口量及同比增长率
图:2009-2013年中国润滑油进口总额
表:2013中国润滑油主要进口国家和地区前5位
图:2009-2013年中国润滑油出口量
图:2009-2013年中国润滑油出口总额
表:2013年中国润滑油主要出口国家和地区前5名
图:2013年中国润滑油市场份额
表:2013年中国主要润滑油企业产能
表:中国部分车企初装油和4S售后用油品牌
图:2013年全球基础油品种占比(按产能)
表:2013年中国基础油进口量前十国家和地区(按进口量)
表:2013年中国基础油出口量前十国家和地区(按出口量)
图:中国润滑油添加剂消费比例(按用途)
表:2013年中国润滑油添加剂进口量及金额
表:2013年中国润滑油添加剂出口量及金额
表:2013年中国润滑油添加剂出口前十的国家及出口量
表:中国废润滑油回收与利用相关政策规定
图:2009-2013年中国废润滑油理论供应量
图:2011-2013年壳牌营业收入及净利润
表:2012-2013年壳牌润滑油品牌及平均价格
表:2012-2013年统一润滑油品牌及平均价格
图:2011-2013年BP营业收入和净利润
图:2011-2013年嘉实多润滑油息税前利润
表:2012-2013年嘉实多主要汽车用润滑油产品及平均价格
表:2012-2013年嘉实多和BP主要工业润滑油品牌及平均价格
图:2009-2013年埃克森美孚营业收入及净利润
表:埃克森美孚润滑油应用领域及产品
表:2012-2013年美孚润滑油品牌及平均价格
图:2009-2013年雪佛龙营业收入及净利润
表:雪佛龙加德士旗下润滑油产品系列
表:2012-2013年雪佛龙旗下润滑油品牌及平均价格
图:2009-2013年道达尔营业收入及净利润
表:2012-2013年道达尔润滑油品牌及平均价格
表:福斯在华发展历程
图:福斯(中国)润滑油产品结构
表:福斯润滑油部分下游客户
表:2012-2013年福斯润滑油品牌及平均价格
图:2009-2013年亚什兰营业收入及净利润
表:2012-2013年胜牌润滑油主要品牌及平均价格
图:2009-2013年康菲营业收入及净利润
表:2012-2013年美国康菲润滑油主要产品及平均价格
图:2009-2013年中国石油营业收入及净利润
图:2009-2013年中国石油营业收入(按地区)
图:2009-2013年中国石油营业收入构成(按地区)
图:2009-2013年中国石油毛利率
图:2009-2013年中国石油毛利率(按业务)
图:2009-2013年中国石油润滑油销售量及平均价格
图:2012-2016E中国石油营业收入及净利润预测
图:2009-2013年中国石化营业收入及净利润
图:2009-2013年中国石化营业收入(按业务)
图:2009-2013年中国石化营业收入构成(按业务)
图:2009-2013年中国石化毛利率
图:2009-2013年中国石化毛利率(按业务)
表:长城润滑油产品系列及应用领域
图:2012-2016E中国石化营业收入及净利润预测
图:德联集团服务品牌
图:2009-2013年德联集团营业收入及净利润
图:2009-2013年德联集团营业收入(按地区)
图:2009-2013年德联集团营业收入构成(按地区)
图:2009-2013年德联集团毛利率
图:2009-2012年德联集团润滑油产品营业收入及所占营业收入比例
图:2012-2013年德联集团研发投入及所占营业收入比例
图:德联集团贴厂基地分布
图:2012-2016E德联集团营业收入及净利润预测
图:2009-2013年高科石化营业收入及净利润
图:2011-2013年高科石化营业收入(按产品)
图:2011-2013年高科石化营业收入(按地区)
图:2011-2013年高科石化营业收入构成(按产品)
图:2011-2013年高科石化营业收入构成(按地区)
图:2009-2013年高科石化毛利率
图:2009-2013年高科石化毛利率(按产品)
图:2011-2013年高科石化研发投入及所占营业收入比例
表:2011-2013年高科石化产能及产量
表:2011-2013年高科石化产销情况(按产品)
表:2011-2013年高科石化基础油采购情况
图:2012-2016年高科石化营业收入及净利润
图:2011-2013年康普顿营业收入及净利润
图:2011-2013年康普顿营业收入(按产品)
图:2011-2013年康普顿营业收入(按地区)
图:2011-2013年康普顿营业收入构成(按产品)
图:2011-2013年康普顿营业收入构成(按地区)
图:2011-2013年康普顿毛利率
图:2011-2013年康普顿毛利率(按产品)
图:2011-2013年康普顿研发投入及所占营业收入比例
表:2011-2013年康普顿产能及产销情况(按产品)
表:2011-2013年康普顿前五名供应商情况
表:2011-2013年康普顿前五名销售客户情况
图:2012-2016E康普顿营业收入及净利润预测
图:2010-2013年舜能科技营业收入及净利润
图:2010-2013年舜能科技毛利率
表:2010-2012年舜能科技前五大供应商及采购情况
表:2010-2012年舜能科技前五大客户情况
图:2012-2016E中国润滑油产量预测
图:2009-2013年中国润滑油行业主要公司营业收入
图:2009-2013年中国润滑油行业主要公司净利润
图:2009-2013年中国润滑油行业主要公司净利润率
图:2009-2013年中国润滑油行业主要公司毛利率
Classification Criteria of API-1509 Base Oil
Classification and Code of Q/SHR001-95 Lubricant Base Oil
Consumption Structure of Global Lubricant Market (by Application), 2013
Global Lubricant Demand and YoY Change, 2004-2013
Lubricant Demand Proportion in Major Regions of the World, 2013
Price Trend of Crude Oil Worldwide, 1990-2014E
Lubricant Output and YoY Growth Rate in China, 1990-2013
Output of Major Lubricant Producing Areas in China (by Province/Municipality), 2008-2013
Apparent Consumption of Lubricant and YoY Growth Rate in China, 2009-2013
China’s GDP and Growth Rate, 2003-2013
Engel Coefficient of Urban and Rural Households in China, 1980-2013
Lubricant Import Dependence and Self-sufficiency Rate in China, Jan.-Dec.2013
Lubricant Import Volume and YoY Growth in China, 2009-2013
Lubricant Import Value in China, 2009-2013
Top Five Import Countries (Regions) of China’s Lubricant, 2013
Lubricant Export Volume in China, 2009-2013
Lubricant Export Value in China, 2009-2013
Top Five Export Destinations of China’s Lubricant, 2013
China's Lubricant Market Share, 2013
Capacity of Major Lubricant Enterprises in China, 2013
Prefilled Lubricant & 4S After-service Lubricant Brands of Some Automobile Companies in China
Proportion of Base Oil Types Worldwide (by Capacity), 2013
China's Top 10 Base Oil Import Sources (by Import Volume), 2013
China's Top 10 Base Oil Export Destinations (by Export Volume), 2013
China’s Lubricant Additive Consumption Structure (by Application)
China’s Lubricant Additive Import Volume and Value, 2013
China’s Lubricant Additive Export Volume and Value, 2013
China’s Top 10 Lubricant Additive Export Destinations and Export Volume, 2013
Relevant Policies on Waste Lubricant Recycling and Utilization in China
China’s Theoretical Waste Lubricant Supply, 2009-2013
Shell’s Revenue and Net Income, 2011-2013
Shell’s Lubricant Brands and Average Price, 2012-2013
Tongyi’s Lubricant Brands and Average Price, 2012-2013
BP’s Revenue and Net Income, 2011-2013
Castrol’s Lubricant EBIT, 2011-2013
Castrol’s Main Automotive Lubricant Products and Average Price, 2012-2013
Major Industrial Lubricant Brands and Average Price of Castrol and BP, 2012-2013
Exxon Mobil’s Revenue and Net Income, 2009-2013
Exxon Mobil’s Lubricant Applications and Products
Mobil’s Lubricant Brands and Average Price, 2012-2013
Chevron’s Revenue and Net Income, 2009-2013
Lubricant Product Series of Chevron Caltex
Chevron’s Lubricant Brands and Average Price, 2012-2013
Total’s Revenue and Net Income, 2009-2013
Total’s Lubricant Brands and Average Price, 2012-2013
Development Course of FUCHS in China
Lubricant Product Structure of FUCHS (China)
Some Lubricant Downstream Customers of FUCHS
Lubricant Brands and Average Price of FUCHS, 2012-2013
Ashland’s Revenue and Net Income, 2009-2013
Valvoline’s Major Lubricant Brands and Average Price, 2012-2013
Revenue and Net Income of ConocoPhillips, 2009-2013
Major Lubricant Products and Average Price of ConocoPhillips, 2012-2013
PetroChina’s Revenue and Net Income, 2009-2013
PetroChina’s Revenue (by Region), 2009-2013
PetroChina’s Revenue Structure (by Region), 2009-2013
PetroChina’s Gross Margin, 2009-2013
PetroChina’s Gross Margin (by Business), 2009-2013
PetroChina’s Lubricant Sales Volume and Average Price, 2009-2013
PetroChina’s Revenue and Net Income, 2012-2016E
Sinopec’s Revenue and Net Income, 2009-2013
Sinopec’s Revenue (by Business), 2009-2013
Sinopec’s Revenue Structure (by Business), 2009-2013
Sinopec’s Gross Margin, 2009-2013
Sinopec’s Gross Margin (by Business), 2009-2013
Great Wall's Lubricant Product Series and Applications
Sinopec’s Revenue and Net Income, 2012-2016E
Delian Group’s Service Brands
Delian Group’s Revenue and Net Income, 2009-2013
Delian Group’s Revenue (by Region), 2009-2013
Delian Group’s Revenue Structure (by Region), 2009-2013
Delian Group’s Gross Margin, 2009-2013
Delian Group’s Lubricant Product Revenue and % of Total Revenue, 2009-2012
Delian Group’s R & D Costs and % of Total Revenue, 2012-2013
Distribution of Delian Group’s Parts Production Bases near Downstream Vehicle Plants
Delian Group’s Revenue and Net Income, 2012-2016E
Gaoke Petrochemical’s Revenue and Net Income, 2009-2013
Gaoke Petrochemical’s Revenue (by Product), 2011-2013
Gaoke Petrochemical’s Revenue (by Region), 2011-2013
Gaoke Petrochemical’s Revenue Structure (by Product), 2011-2013
Gaoke Petrochemical’s Revenue Structure (by Region), 2011-2013
Gaoke Petrochemical’s Gross Margin, 2009-2013
Gaoke Petrochemical’s Gross Margin (by Product), 2009-2013
Gaoke Petrochemical’s R & D Costs and % of Total Revenue, 2011-2013
Gaoke Petrochemical’s Capacity and Output, 2011-2013
Gaoke Petrochemical’s Output and Sales Volume (by Product), 2011-2013
Gaoke Petrochemical’s Base Oil Procurement, 2011-2013
Gaoke Petrochemical’s Revenue and Net Income, 2012-2016E
Copton’s Revenue and Net Income, 2011-2013
Copton’s Revenue (by Product), 2011-2013
Copton’s Revenue (by Region), 2011-2013
Copton’s Revenue Structure (by Product), 2011-2013
Copton’s Revenue Structure (by Region), 2011-2013
Copton’s Gross Margin, 2011-2013
Copton’s Gross Margin (by Product), 2011-2013
Copton’s R & D Costs and % of Total Revenue, 2011-2013
Copton’s Capacity, Output and Sales Volume (by Product), 2011-2013
Copton’s Top Five Suppliers, 2011-2013
Copton’s Top Five Clients, 2011-2013
Copton’s Revenue and Net Income, 2012-2016E
Revenue and Net Income of Sure Energy, 2010-2013
Gross Margin of Sure Energy, 2010-2013
Top Five Suppliers and Procurement of Sure Energy, 2010-2012
Top Five Clients of Sure Energy, 2010-2012
China’s Lubricant Output, 2012-2016E
Revenue of Major Companies in China Lubricant Industry, 2009-2013
Net Income of Major Companies in China Lubricant Industry, 2009-2013
Net Profit Margin of Major Companies in China Lubricant Industry, 2009-2013
Gross Margin of Major Companies in China Lubricant Industry, 2009-2013
如果这份报告不能满足您的要求,我们还可以为您定制报告,请 留言说明您的详细需求。
|