|
|
|
报告导航:研究报告—
TMT产业—电子半导体
|
|
2013-2014年全球及中国IC载板行业研究报告 |
 |
字数:1.1万 |
页数:100 |
图表数:126 |
|
中文电子版:8000元 |
中文纸版:4000元 |
中文(电子+纸)版:8500元 |
|
英文电子版:2200美元 |
英文纸版:2400美元 |
英文(电子+纸)版:2500美元 |
|
编号:ZYW185
|
发布日期:2014-07 |
附件:下载 |
 |
|
|
《2013-2014年全球及中国IC载板行业研究报告》包含以下内容:
1、全球半导体产业现状
2、IC载板简介
3、IC载板市场分析
4、IC载板产业分析
5、11家IC载板厂家研究
6、全球前4大IC封装厂家研究
PCB行业可分硬板(Rigid PCB)、软板(FPCB)、载板(Substrate)三大类。IC载板行业在2012和2013年两年连续下滑,根源在两方面:一是因为PC出货量下降,而CPU用载板是IC载板的主要类型,是单价(ASP)最高的载板;二是韩国企业为压制日本和台湾IC载板厂家的发展,大幅度降价,尤其是三星旗下的三星电机(SEMCO)大幅度降价近30%。这导致2013年全球IC载板行业市场规模下跌10.3%,至75.68亿美元。不过苦尽甘来,预计2014和2015年IC载板行业将迎来增长。
2014年增长的动力有几方面。首先是联发科的8核芯片MT6592采用FC-CSP封装,该芯片在2013年10月推出,预计2014年出货量会大增。随着联发科进入28nm时代,联发科会全面采用FC-CSP封装,接下来中国大陆的展讯也会采用。其次是LTE 4G网络开始兴建,BASESTATION 芯片需要IC载板。
其三,是可穿戴设备(wearable devices)大量进入市场,这会刺激SiP模块封装,也需要IC载板。其四是手机追求超薄,就需要芯片具备良好的散热,FC-CSP封装在散热和厚度方面优势明显,未来手机的主要芯片都会是FC-CSP封装或SiP模块封装,包括电源管理和存储器。
其五,PC行业在2014年复苏。平板电脑在2014年高增长不再来,甚至会下滑,消费者意识到平板电脑只能做玩具,完全无法和PC比性能,PC行业将复苏。最后三星电机(SEMCO)不再杀价竞争,因为苹果下一代处理器A8确定会由台湾TSMC代工,而非三星电子代工。三星电机(SEMCO)即便杀价,也不可能让台湾TSMC给予其订单。
预计2014年全球IC载板行业市场规模增长9.8%,2015年会加速增长,增幅达11.6%。
IC载板行业可以分为日韩台三大阵营。日本企业是IC载板的开创者,技术实力最强,掌握利润最丰厚的CPU载板。韩国和台湾企业则依靠产业链配合,韩国拥有全球70%左右的内存产能,三星一直为苹果代工处理器,三星也能够生产部分手机芯片。
台湾企业则在产业链上更强大,台湾拥有全球65%的晶圆代工产能,80%的手机高级芯片由台湾TSMC或UMC代工,这些代工的利润率远高于传统电子产品的利润率,毛利率在50%以上。以联发科的MT6592为例,代工由TSMC或UMC完成,封装由ASE和SPIL完成,载板由景硕提供,测试由KYEC完成,这些厂家都在一个厂区内,效率极高。
大陆企业在产业链完全没有任何优势,缺乏晶圆代工厂家和封装厂家支持,落后台湾数年乃至十几年。即便有海思和展讯这样出货量不低的大陆企业,台湾厂家仍然占据供应链的话语权。
Global and China IC Substrate Industry Report, 2014-2015 contains the followings
1. Status quo of global semiconductor industry
2. Introduction of IC substrate
3. Analysis on IC substrate market
4. Analysis on IC substrate industry
5. Research on 11 IC substrate vendors
6. Research on the world’s top 4 IC substrate packaging companies.
PCB (printed circuit board) industry can be divided into three broad categories i.e. rigid PCB, flexible PCB (FPCB) and substrate. IC substrate industry suffered a continuous decline in 2012 and 2013, rooted in two aspects: first, the PC shipment declined, and CPU substrate as the main type of IC substrate enjoyed the highest average selling price (ASP); second, to suppress the development of Japanese and Taiwanese IC substrate vendors, Korean companies slashed price, Samsung Electro-Mechanics (SEMCO), in particular, implemented a nearly 30% price cut. This led to the global IC substrate industry market scale down 10.3% to USD7.568 billion in 2013. But after suffering comes happiness, IC substrate industry is expected to bloom in 2014 and 2015.
There are several factors for the growth in 2014.
 First, MediaTek’s 8-core MT6592 adopts FC-CSP packaging. Released in October 2013, the chip will see shipment boost-up in 2014. Entering the age of 28nm, MediaTek will ensure uniform adoption of FC-CSP packaging; Spreadtrum from Mainland China will follow in its footsteps. First, MediaTek’s 8-core MT6592 adopts FC-CSP packaging. Released in October 2013, the chip will see shipment boost-up in 2014. Entering the age of 28nm, MediaTek will ensure uniform adoption of FC-CSP packaging; Spreadtrum from Mainland China will follow in its footsteps.
Second, LTE 4G networks are under construction, thereof IC substrate is needed by BASESTATION chip.
Third, wearable devices are invading the market, which will stimulate SiP module packaging, also needs IC substrate.
Fourth, the pursuit of ultra-thin mobile phone requires chip with good heat dissipation, FC-CSP packaging boasts obvious advantages in terms of heat dissipation and thickness. Main chip for mobile phone of the future will be the FC-CSP packaging or SiP module packaging, involving power management and memory.
Fifth, PC industry will revive in 2014. Tablet PC will not see high growth, even fall in 2014, since consumers have been aware of its function only as a toy but completely unable to compare with PC in performance, PC industry will usher in recovery. At last, SEMCO will not fall back on price-cutting competition, because it is Taiwan’s TSMC not Samsung Electronics that on track to produce Apple’s next-generation processor A8. Even slashing price, it is impossible for TSMC to turn over the order.
The global IC substrate industry market scale is expected to grow at a rate of 9.8% in 2014, and then speed up to 11.6% in 2015.
IC substrate industry falls into three camps i.e. Japan, Korea and Taiwan. Japanese companies as the IC substrate pioneer have the strongest technical strength, mastering the most profitable CPU substrate. Korean and Taiwanese companies rely on the industrial chain cooperation, the former hold about 70% of the world's memory capacity, the Apple’s processor foundry provider Samsung also can produce part of mobile phone chips.
Taiwanese companies are more powerful in the industrial chain by possessing 65% of global foundry production capacity and 80% of senior mobile phone chip foundry (by TSMC or UMC), whose margin is much higher than that of traditional electronic products, (gross margin) exceeding 50%. MediaTek’s MT6592, for instance, the foundry is charged by TSMC or UMC, the packaging is completed by ASE and SPIL, the substrate is offered by Kinsus and testing by KYEC; sharing the same factory, these vendors are pretty high-efficient.
The utterly disadvantaged Mainland Chinese companies in the industrial chain lack support from foundries and packaging companies, lagging behind Taiwanese counterparts several even a dozen years. Even Hisilicon and Spreadtrum have impressive shipments, Taiwanese companies still hold the discourse right of the supply chain.
第一章、全球半导体产业
1.1、全球半导体产业概况
1.2、IC封装概况
1.3、IC封测产业概况
第二章、IC载板简介
2.1、IC载板简介
2.2、FLIP CHIP IC 载板
2.3、IC载板趋势
第三章、IC载板市场与产业
3.1、IC载板市场
3.2、手机市场
3.3、WLCSP市场
3.4、PC市场
3.5、平板电脑市场
3.6、FPGA与CPLD市场
3.7、IC载板产业
3.8、晶圆代工FOUNDRY市场规模
3.9、晶圆代工行业竞争分析
第四章、IC载板厂家研究
4.1、欣兴
4.2、IBIDEN
4.3、大德电子
4.4、SIMMTECH
4.5、LG INNOTEK
4.6、SEMCO
4.7、南亚电路板
4.8、景硕KINSUS
4.9、SHINKO
4.10、KYOCERA SLC
4.11、AT&S
第五章、IC载板封装厂家研究
5.1、日月光
5.2、AMKOR
5.3、矽品精密
5.4、星科金朋
5.5、三菱瓦斯化学
1. Global Semiconductor Industry
1.1 Overview
1.2 IC Packaging
1.3 IC Packaging and Testing
2. IC Substrate
2.1 Introduction
2.2 Flip Chip IC Substrate
2.3 Trends
3. IC Substrate Market and Industry
3.1 IC Substrate Market
3.2 Mobile Phone Market
3.3 WLCSP Market
3.4 PC Market
3.5 Tablet PC Market
3.6 FPGA and CPLD Market
3.7 IC Substrate Industry
3.8 Wafer Foundry Market Size
3.9 Wafer Foundry Industry Competition
4. IC Substrate Vendors
4.1 Unimicron
4.2 IBIDEN
4.3 Daeduck Electronics
4.4 SIMMTECH
4.5 LG INNOTEK
4.6 SEMCO
4.7 Nan Ya PCB
4.8 Kinsus
4.9 Shinko
4.10 Kyocera SLC
4.11 AT&S
5. IC Substrate Packaging Companies
5.1 ASE
5.2 Amkor
5.3 Siliconware Precision
5.4 STATS ChipPAC
5.5 MITSUBISHI GAS CHEMICAL COMPANY
2009-2014年全球半导体产业季度收入
2008-2017年全球半导体产业年度收入
2012-2017年全球半导体市场产品分布
2012-2017年各种半导体产品市场规模增幅
主要电子产品使用IC的封装类型
2012-2017年全球IC Packaging and Test市场规模
2012-2017年全球Outsourcing IC Packaging and Test市场规模
2012-2017年全球IC Packaging 市场规模
2012-2017年全球IC Test市场规模
2009-2013年台湾封测产业收入
2013年全球前10大封装企业收入
2009-2016年IC载板市场规模
IC载板具体应用产品
2011-2016 IC载板 by node
2007-2015年全球手机出货量
Worldwide Smartphone Sales to End Users by Vendor in 2013 (Thousands of Units)
Worldwide Smartphone Sales to End Users by Operating System in 2013 (Thousands of Units)
Worldwide Mobile Phone Sales to End Users by Vendor in 2013 (Thousands of Units)
2010-2016年WLCSP封装市场规模
2010-2016年WLCSP出货量下游应用分布
2008-2015年全球PC用CPU与Discrete GPU 出货量
2011-2016年全球平板电脑出货量
2013年平板电脑主要品牌市场占有率
2012、2013年全球平板电脑制造厂家产量
2011年FPGA、CPLD市场下游分布与地域分布
1999-2013年主要FPGA厂家市场占有率
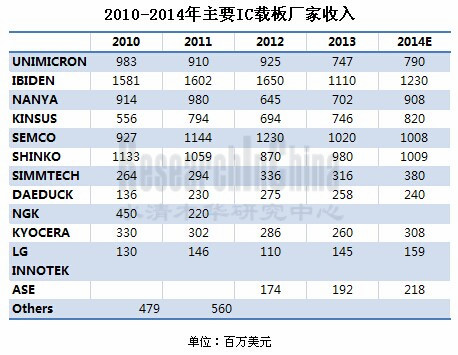
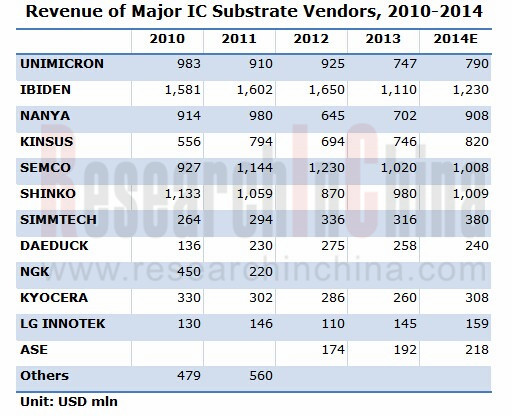
2010-2014年主要IC载板厂家收入
2008-2017年全球Foundry市场规模
2012-2017 Foundry Revenue of Advanced Nodes
2012-2018 Global Foundry capacity by node
2012-2018 Global Foundry revenue by node
Global ranking by foundry
2003-2014年欣兴收入与毛利率
2009-2014年欣兴收入与营业利润率
2012年1季度-2014年1季度欣兴季度收入与毛利率
2010-2014年欣兴销售额技术分布
2010-2014年欣兴收下游应用分布
2010-2014欣兴产能Capacity
2004-2013年欣兴CAPEX
欣兴历年合并
2012年2季度-2014年1季度IBIDEN季度收入业务分布
2012年2季度-2014年1季度IBIDEN季度营业利润业务分布
2010-2015财年ibiden电子事业部收入产品分布
2010-2015财年ibiden CAPEX与depreciation
SIMM TECH组织结构
2009-2013年SIMMTECH资产负债表
2013年1季度-2014年4季度SIMMTECH季度收入产品分布
2012-2015年SIMMTECH收入产品分布
2013年1季度-2014年4季度SIMMTECH季度毛利率与运营利润率
2013年1季度-2014年4季度SIMMTECH季度出货量
2012-2015年SIMMTECH出货量
2013年1季度-2014年4季度SIMMTECH季度产能利用率
2012-2015年SIMMTECH产能利用率
2008-2014年SIMMTECH收入by application
2012-2014年SIMMTECH Substrate收入by application
2006-2014年LG INNOTEK收入与运营利润率
2013-2015年SEMCO IC Substrate sales by technology
2013-2015年SEMCO IC Substrate operatio profit by technology
南亚电路板组织结构
2006-2014年南亚电路板收入与毛利率
2009-2014年南亚电路板收入与营业利润率
2012年5月-2014年5月南亚电路板每月收入与增幅
2004-2014年景硕收入与毛利率
2009-2014年景硕收入与营业利润率
2012年5月-2014年5月景硕每月收入与增幅
2011-2014年景硕收入产品分布
2011年景硕收入下游应用分布
Q1/2014景硕收入BY Applications
2013\2014 KINSUS客户分布
2007-2015财年Shinko收入与净利润
2010-2014财年Shinko收入业务分布
2005-2014财年 AT&S与EBITDA率
AT&S重庆substrate厂ramp
FY2014 AT&S收入地域分布
FY2014 AT&S资产负债表
20092-2014年日月光收入与营业利润率
2012年5月-2014年5月日月光月度收入
2010-2013年ASE收入业务分布
2013年1季度-2014年1季度ASE封装部门收入与毛利率
2013年1季度-2014年1季度ASE封装部门收入类型分布
2013年1季度-2014年1季度ASE材料部门收入与毛利率
2013年1季度-2014年1季度ASE EMS收入与毛利率
2013年1季度-2014年1季度ASE EMS收入breakdown
2014年1季度ASE收入下游应用
2007-2012年Amkor收入封装类型分布
矽品精密工业组织结构
2012年5月-2014年5月SPIL月度收入
2012年1季度-2014年1季度SPIL季度收入、毛利率与营业利润率
2005-2014年矽品收入地域分布
2005-2014年矽品收入下游应用分布
2005-2014年矽品收入业务分布
矽品2006-2014年产能统计
三菱瓦斯化学Organization Chart
2009-2015财年MGC收入与营业利润
2009-2015财年MGC收入by segment
2009-2015财年MGC operation income by segment
2011-2014年全球3G/4G手机出货量地域分布
欣兴组织结构
2006-2015财年IBIDEN收入与运营利润率
2006-2015财年IBIDEN收入业务分布
2005-2014年大德电子收入与运营利润率
2009-2014年大德电子收入by bunesiss
2004-2014年SIMMTECH收入与运营利润率
2009-2014年SIMMTECH收入、毛利率与净利率
SIMMTECH厂区
2011年1季度-2014年1季度LG INNOTEK收入与运营利润率
2011-2014年LG INNOTEK 收入业务分布
2011-2013年LG INNOTEK 运营利润业务分布
2010-2014年SEMCO收入部门分布
2012-2014年SEMCO营业利润部门分布
2013年1季度-2014年4季度SEMCO ACI事业部收入与运营利润率
南亚电路板产能与全球分布
日月光组织结构
2001-2014年日月光收入与毛利率
2005-2014年Amkor收入与毛利率、运营利润率
2003-2014年矽品收入、毛利率、运营利润率
2004-2014年星科金朋收入与毛利率
2006-2013年星科金朋收入封装类型分布
2006-2013年星科金朋收入下游应用分布
2006-2013年星科金朋收入 地域分布
Quarterly Revenue of Global Semiconductor Industry, 2009-2014
Revenue of Global Semiconductor Industry, 2008-2017E
Revenue of Global Semiconductor Industry by Product, 2012-2017E
Market Size Growth of Global Semiconductor Industry by Product, 2012-2017E
Annual Capital Expenditure of Semiconductor Industry, 2008-2017E
Capital Expenditure of Global Semiconductor Industry by Downstream Application, 2008-2017E
IC Packaging Types Used by Major Electronic Products
Global IC Packaging and Testing Market Size, 2012-2017E
Global Outsourcing IC Packaging and Testing Market Size, 2012-2017E
Global IC Packaging Market Size, 2012-2017E
Global IC Testing Market Size, 2012-2017E
Revenue of Taiwan Semiconductor Packaging & Testing Service Revenue, 2009-2013
Revenue of Global Top Ten Packaging Vendors, 2013
Global IC Substrate Market Size, 2009-2016E
Application Products of IC Substrate
IC Substrate by Node, 2011-2016E
Global Mobile Phone Shipment, 2007-2015E
Global 3G/4G Mobile Phone Shipment by Region, 2011-2014
Worldwide Smartphone Sales to End Users by Vendor, 2013 (Thousands of Units)
Worldwide Smartphone Sales to End Users by Operating System, 2013 (Thousands of Units)
Worldwide Mobile Phone Sales to End Users by Vendor, 2013 (Thousands of Units)
WLCSP Packaging Market Size, 2010-2016
WLCSP’s Shipment by Application, 2010-2016
Global PC-use CPU and Discrete GPU Shipment, 2008-2015
Global Tablet PC Shipment, 20011-2016
Market Share of Major Tablet PC Brands,2013
Shipment of Major Global Tablet PC Vendors, 2012-2013
Application Distribution and Geographical Distribution of FPGA and CPLD Market, 2011
Market Share of Major FPGA Vendors, 1999-2013
Revenue of Major IC Substrate Vendors, 2010-2014
Global Foundry Market Size, 2008-2017
Foundry Revenue of Advanced Nodes, 2012-2017
Global Foundry Capacity by Node, 2012-2018
Global Foundry Revenue by Node, 2012-2018
Global Ranking by Foundry, 2013
Unimicron’s Organizational Structure
Unimicron’s Revenue and Gross Margin, 2003-2014
Unimicron’s Revenue and Operating Margin, 2009-2014
Unimicron’s Quarterly Revenue and Gross Margin, Q1 2012-Q1 2014
Unimicron’s Sales Breakdown by Technology, 2010-2014
Unimicron’s Sales Breakdown by Application, 2010-2014
Unimicron’s Capacity by Product, 2010-2014
Unimicron’s CAPEX, 2004-2013
Unimicron's M & A
IBIDEN Revenue and Operating Margin, FY2006-FY2015
Revenue of IBIDEN by Business, FY2006-FY2015
Revenue of IBIDEN by Business, Q2 FY2012-Q1 FY2014
Operating Income of IBIDEN by Business,Q2 FY2012-Q1 FY2014
Revenue of IBIDEN ‘s Electronics Business by Product, FY2010-FY2015
IBIDEN’s CAPEX and Depreciation, FY2010-FY2015
Major Projects of IBIDEN in 2014
Revenue and Operating Margin of Daeduck Electronics, 2005-2014
Revenue of Daeduck Electronics by Business, 2009-2014
SIMMTECH’s Organizational Structure
SIMMTECH’s Revenue and Operating Margin, 2004-2014
Revenue, Gross Margin and Net Margin of SIMMTECH, 2009-2014
SIMMTECH’s Balance Sheet, 2009-2013
Quarterly Revenue of SIMMTECH by Product, Q3 2013-Q4 2014
Revenue of SIMMTECH by Product, 2012- 2015
Quarterly Gross Margin and Operating Margin of SIMMTECH, Q1 2013-Q4 2014
Quarterly Shipment of SIMMTECH, Q1 2013-Q4 2014
SIMMTECH’s Shipment, 2012-2015
Quarterly Capacity Utilization of SIMMTECH, Q1 2013-Q4 2014
Capacity Utilization of SIMMTECH, 2012- 2015
SIMMTECH’s Revenue by Application, 2008-2014
Substrate Revenue of SIMMTECH by Application, 2012-2014
SIMMTECH’s Plants
Revenue and Operating Margin of LG INNOTEK, 2006-2014
Quarterly Revenue and Operating Margin of LG INNOTEK, Q1 2011-Q1 2014
Revenue of LG INNOTEK by Business, 2011-2014
Operating Income of LG INNOTEK by Business, 2011-2013
Revenue and Operating Margin of SEMCO, 2009-2014
Revenue of SEMCO by Segment, 2010-2014
Operating Income of SEMCO by Segment, 2012-2014
Quarterly Revenue and Operating Margin of SEMCO’s ACI Segment, Q1 2013- Q4 2014
SEMCO’s IC Substrate Sales by Technology, 2013-2015
Operating Income of SEMCO’s IC Substrate by Technology, 2013-2015
Organizational Structure of Nan Ya PCB
Revenue and Gross Margin of Nan Ya PCB, 2006-2014
Revenue and Operating Margin of Nan Ya PCB, 2009-2014
Monthly Revenue and Growth Rate of Nan Ya PCB, May 2012-May 2014
Production Allocation and Monthly Capacity of Nan Ya PCB
Revenue and Gross Margin of Kinsus, 2004-2014
Revenue and Operating Margin of Kinsus, 2009-2014
Monthly Revenue and Growth Rate of Kinsus, May 2012-May 2014
Revenue of Kinsus by Product, 2011-2014
Revenue of Kinsus by Downstream Application, 2011
Revenue of Kinsus by Applications, Q1 2014
Client Structure of KINSUS, 2013-2014
Shinko’s Revenue and Net Income, FY2007-FY2015
Shinko’s Revenue by Business, FY2011-FY2014
Revenue and EBITDA Margin of AT&S, FY2005-FY2014
Global Presence of AT&S
Substrate Plant Ramp of AT&S in Chongqing
Revenue of AT&S by Region, FY2014
Balance Sheet of AT&S, FY2014
ASE Group Organization Chart
ASE’s Revenue and Gross Margin, 2001-2014
ASE’s Revenue and Operating Margin, 2009-2014
Monthly Revenue of ASE, May 2012-May 2014
ASE’s Revenue by Business, 2010-2013
Revenue and Gross Margin of ASE’s Packaging Division, Q1 2013-Q1 2014
Revenue of ASE’s Packaging Division by Type, Q1 2013-Q1 2014
Revenue and Gross Margin of ASE’s Materials Division, Q1 2013-Q1 2014
Revenue and Gross Margin of ASE’s EMS, Q1 2013-Q1 2014
Revenue of ASE’s EMS by Application, Q1 2013-Q1 2014
ASE’s Revenue by Application, Q1 2014
Amkor’s Revenue and Gross Margin and Operating Margin, 2005-2014
Amkor’s Revenue by Packaging Type, 2007-2012
Amkor’s Revenue by Product, 2012-2014Q1
Organizational Structure of Siliconware Precision
Revenue, Gross Margin, Operating Margin of Siliconware Precision, 2003-2014
Monthly Revenue of SPIL, May 2012-May 2014
Quarterly Revenue, Gross Margin and Operating Margin of SPIL, Q1 2012-Q1 2014
Revenue of SPIL by Region, 2005-2014
Revenue of SPIL by Downstream Application, 2005-2014
Revenue of SPIL by Business, 2005-2014
Capacity of SPIL, 2006-2014
Revenue and Gross Margin of STATS ChipPAC, 2004-2014
Revenue of STATS ChipPAC by Packaging Type, 2006-2013
Revenue of STATS ChipPAC by Application, 2006-2013
Revenue of STATS ChipPAC by Region, 2006-2013
Organization Chart of Mitsubishi Gas Chemical
Revenue and Operating Income of Mitsubishi Gas Chemical, FY2009-FY2015
Revenue of Mitsubishi Gas Chemical by Segment, FY2009-FY2015
Operating Income of Mitsubishi Gas Chemical by Segment, FY2009-FY2015
如果这份报告不能满足您的要求,我们还可以为您定制报告,请 留言说明您的详细需求。
|