|
|
|
报告导航:研究报告—
生命科学—生物科技
|
|
2014-2017年中国血液制品行业研究报告 |
 |
字数:4.2万 |
页数:122 |
图表数:130 |
|
中文电子版:8500元 |
中文纸版:4250元 |
中文(电子+纸)版:9000元 |
|
英文电子版:2600美元 |
英文纸版:2800美元 |
英文(电子+纸)版:2900美元 |
|
编号:ZYM056
|
发布日期:2014-07 |
附件:下载 |
 |
|
|
血液制品行业发展的关键之一就是血浆资源的储备和控制。虽然2011贵州关停16家采血浆张未对国内血液制品市场造成较大震荡,但受库存消耗、新建浆站利用率不足、部分企业停产(如贵州泰邦、广州卫伦生物等停产升级改造、上海莱士因水灾停产)等影响,2013年中国血液制品行业投浆量同比下降2.8%,批发签总量同比下滑7%。
不过一些小品种血液制品批签发量仍保持了较高增长,如需求一直紧俏的人凝血因子VIII。2013年山东泰邦、上海所的人凝血因子VIII批签发上市,使得同期该产品批签发总量达到52.6万瓶,同比增长44.5%。
由于中国血液制品市场需求旺盛,2013年中国进口人血白蛋白批签发总量达到1439万瓶(折合10g/瓶),同比增长24.1%,占同期人血白蛋白批签发总量的53.4%(2012年为45.3%)。Behring、Baxter、基立福和奥克特珐玛以绝对优势,仍占据中国人血白蛋白进口企业前四位。
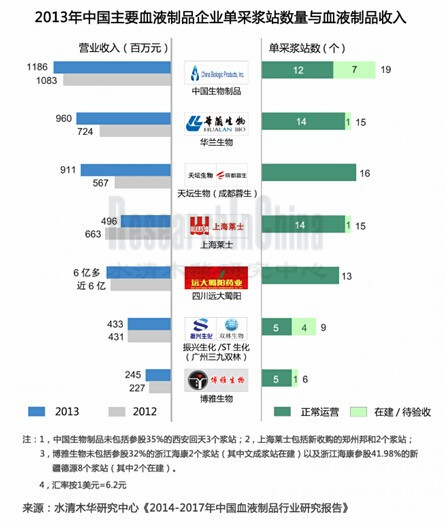
虽然产销量同比略有下滑,但是由于血液制品价格上涨(如纤维蛋白原、凝血因子Ⅷ最高零售价在2013年同比上涨50%以上),2013年中国主要血液制品企业营业收入基本保持了稳定增长。投浆量合计占比60%的中国生物制品、华兰生物、天坛生物、上海莱士、远大蜀阳, 2013年其血液制品合计销售收入约42亿元,同比增长13.5%。不过,由于水灾停产,2013年上海莱士营业收入仅有4.96亿元,同比下滑25.1%。
由于国家政策扶持以及市场高景气度吸引,有资质的中国血液制品企业均在积极兴建新浆站,并且部分企业新浆站有望于2014年底前开始采浆。2014年6月,中原瑞德(人福医药控股100%)赤壁瑞祥单采血浆站获得采浆批准;2014年5月,华兰生物河南滑县浆站获批设站;2014年4月,河北大安(沃森生物控股90%)魏县浆站进行了现场GMP认证;2013年底,广东双林生物的隰县血站、绛县血站完成建设。
此外,由于卫生部规定,血液制品生产单位注册的血液制品少于6个品种的,承担国家计划免疫任务的血液制品生产单位少于5个品种的,不得申请设置新的单采血浆站。因此,部分血液制品优势企业正通过收购那些产品结构单一但拥有浆站的小型企业来进一步提高其竞争力。2013年6月,博雅生物收购浙江海康32%的股权,海康生物拥有2个浆站,其参股41.98%的新疆德源拥有6个浆站。2013年3月,上海莱士着手以18亿元收购郑州邦和(现名郑州莱士),2014年1月完成资产交割。
2014-2017年中国血液制品行业研究报告》主要包括以下几个方面:
 中国血液制品行业市场规模、投浆量和浆站分布、市场供需、进出口等; 中国血液制品行业市场规模、投浆量和浆站分布、市场供需、进出口等;
中国血液制品行业竞争格局、政策环境及发展预测等;
中国人血白蛋白、静丙、凝血因子、人狂犬病免疫球蛋白等8类血液制品细分产品的市场供需、竞争格局等;
中国12家主要血液制品企业的经营状况、血液制品业务及发展前景等。
Plasma resource reserves and control are crucial to the development of blood products industry. Although the closure of 16 plasma collection stations in Guizhou in 2011 didn’t cause major disruption to domestic blood products market, the total plasma volume in China blood products industry reduced by 2.8% year on year and total lot release volume declined by 7% from a year earlier in 2013, due to stock consumption, insufficient utilization of new plasma stations and production break of some companies (e.g. Guizhou Taibang Biological Products Co., Ltd and Guangdong Wellen Biological Pharmaceutical Co., Ltd. on account of upgrading and reconstruction, Shanghai RAAS Blood Products Co., Ltd. affected by floods).
However, some niche varieties of blood products, such as scarce human coagulation factor VIII, maintained higher growth in lot release volume. In 2013, the human coagulation factor VIII produced by Shandong Taibang and CNBG Shanghai Institute of Biological Products were approved for release and came into the market, making the lot release volume of the product during the same period amount to 526,000 bottles, soaring by 44.5% on year-on-year basis.
Because of robust demand from China blood products market, the total lot release volume of imported human albumin reached 14.39 million bottles (about 10g/bottle) in 2013, a year-on-year increase of 24.1%, accounting for 53.4% (45.3% in 2012) of the total lot release volume of human albumin during the same period. Assuming absolute superiority, Behring, Baxter, Grifols and Octapharma still held the ground as the top four exporters of human albumin to China.
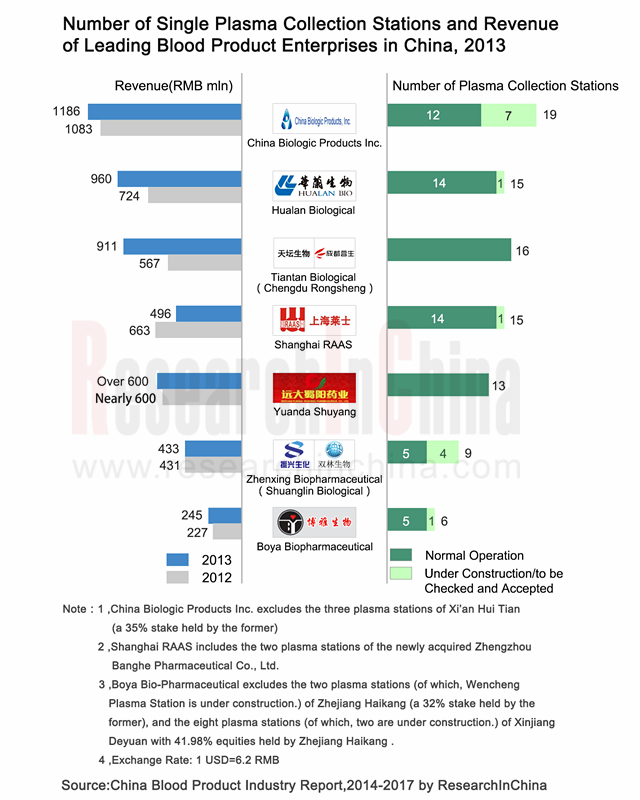
Despite a slight year-on-year decline in output and sales volume, major Chinese blood products companies, by and large, maintained steady revenue growth in 2013, thanks to rising prices of blood products (the highest retail prices of fibrinogen and blood coagulation factor VIII rose over 50% year on year). China Biologic Products, Hualan Bio, Tiantan Biological Products, Shanghai RAAS and Yuanda Shuyang Pharmaceutical, which hold combined 60% of the total plasma volume, generated total revenue of about RMB4.2 billion in 2013, up 13.5% year on year. Among them, Shanghai RAAS, due to production halt caused by flood, earned only RMB496 million, down 25.1% year on year.
Attracted by national policy support and high market prosperity, qualified Chinese blood products companies are actively engaged in construction of new plasma stations, some of which are expected to collect plasma by the end of 2014. In June 2014, Wuhan Zhongyuan Ruide Biological Product Co., Ltd. (100% controlled by Humanwell Healthcare (Group) Co., Ltd.)’s plasmapheresis center in Chibi was approved to collect plasma; In May 2014, Hualan Bio’s plasma station in Hua County, Henan Province was approved to be set up; In April 2014, Hebei Da'an Pharmaceutical (90% stake controlled by Walvax Biotechnology Co., Ltd.) carried out on-site GMP compliance certification for its plasma station in Wei County; At the end of 2013, Guangdong Shuanglin Bio-pharmacy’s plasma stations in Xi County and Jiang County of Shanxi were completed.
In addition, as the Ministry of Health stipulates that the blood products production units with registered varieties of blood products less than 6, and the blood products production units, which undertake national planned immunization task, with registered varieties of blood products less than 5, shall not apply to set up new plasmapheresis centers. Therefore, some superior blood products companies are improving their competitiveness by acquiring small ones which have single product mix but plasma stations. In June 2013, Jiangxi Boya Bio-pharmaceutical Co., Ltd. acquired 32% stake in Zhejiang Haikang Biological Products Co., Ltd., which had two plasma stations and held 41.98% stake in Xinjiang Deyuan Bioengineering Co., Ltd., which possessed 6 plasma stations. In March 2013, Shanghai RAAS set about purchasing Zhengzhou Banghe Pharmaceutical (now known as Zhengzhou RAAS) with RMB1.8 billion, with capital settlement completed in January 2014.
China Blood Products Industry Report, 2014-2017 focuses on the following:
 Market size, plasma volume, distribution of plasma stations, supply and demand, import and export, etc. of China blood products industry; Market size, plasma volume, distribution of plasma stations, supply and demand, import and export, etc. of China blood products industry;
Competitive landscape, policy environment, development forecast, etc. of China blood products industry;
Supply and demand, competitive landscape, etc. of 8 blood product segments, including human albumin, Human Immunoglobulin (pH4) for Intravenous Injection, blood coagulation factor and human rabies immunoglobulin (HRIG).
Operation, blood products business and development prospects of 12 major Chinese blood products companies.
第一章 血液制品行业概述
1.1血液制品定义
1.2血液制品分类
1.3重组血液制品
1.4血液制品产业链
1.5血液制品特点
第二章 中国血液制品行业总体概述
2.1市场规模
2.2发展现状
2.3 市场供需
2.3.1 市场供给
2.3.2 市场需求
2.4 市场竞争
2.5运行环境
2.5.1国际市场
2.5.2政策环境
2.5.3国内生物制药市场
2.6进出口分析
第三章 中国血液制品细分市场分析
3.1人血白蛋白
3.1.1 市场供需
3.1.2 竞争格局
3.1.3 发展前景
3.2静注人免疫球蛋白(ph4)
3.2.1 市场供需
3.2.2竞争格局
3.3凝血因子VIII
3.3.1 市场供需
3.3.2 竞争格局
3.3.3 发展前景
3.4乙肝免疫球蛋白
3.4.1 市场供需
3.4.2竞争格局
3.5人免疫球蛋白
3.5.1 市场供需
3.5.2 竞争格局
3.6人凝血酶原复合物
3.6.1 市场供需
3.6.2竞争格局
3.7破伤风免疫球蛋白
3.7.1 市场供需
3.7.2竞争格局
3.8狂犬病人免疫球蛋白
3.8.1 市场供需
3.8.2 竞争格局
第四章 中国主要厂商
4.1中国生物制品有限公司
4.1.1公司介绍
4.1.2经营状况
4.1.3 营收构成
4.1.4 客户及供应商
4.1.5 研发与投资
4.1.6 山东泰邦生物制品有限公司
4.1.7 贵州泰邦生物制品有限公司
4.1.8 西安回天血液制品有限责任公司
4.1.9 前景及预测
4.2华兰生物工程股份有限公司
4.2.1公司介绍
4.2.2 经营状况
4.2.3 营收构成
4.2.4 毛利率
4.2.5 客户及供应商
4.2.6 研发及投资
4.2.7 血液制品
4.2.8 前景及预测
4.3上海莱士血液制品股份有限公司
4.3.1 公司介绍
4.3.2 经营状况
4.3.3 营收构成
4.3.4 毛利率
4.3.5 客户及供应商
4.3.6 研发及投资
4.3.7 前景及预测
4.4北京天坛生物制品股份有限公司
4.4.1公司介绍
4.4.2 经营状况
4.4.3 营收构成
4.4.4 毛利率
4.4.5 客户及供应商
4.4.6 研发与投资
4.4.7 血液制品(成都蓉生药业有限公司)
4.4.8 前景及预测
4.5振兴生化股份有限公司
4.5.1 公司介绍
4.5.2 经营状况
4.5.3 营收构成
4.5.4 毛利率
4.5.5 客户及供应商
4.5.6 研发及投资
4.5.7 血液制品(广东双林生物制药有限公司)
4.5.8 前景及预测
4.6江西博雅生物制药有限公司
4.6.1公司介绍
4.6.2经营状况
4.6.3 营收构成
4.6.4 毛利率
4.6.5 客户及供应商
4.6.6 研发及投资
4.6.7 前景及预测
4.7四川远大蜀阳药业股份有限公司
4.7.1公司介绍
4.7.2血液制品业务
4.8上海生物制品研究所
4.8.1公司介绍
4.8.2血液制品业务
4.9山西康宝生物制品股份有限公司
4.9.1公司介绍
4.9.2血液制品业务
4.10绿十字
4.10.1公司介绍
4.10.2血液制品业务
4.11 武汉人福医药集团股份有限公司
4.11.1公司简介
4.11.2 经营状况
4.11.3 血液制品(武汉中原瑞德生物制品有限责任公司)
4.12 云南沃森生物技术股份有限公司
4.12.1 公司简介
4. 12.2 经营状况
4.12.3 血液制品(河北大安制药有限公司)
第五章 总结与预测
5.1 公司分析
5.2 发展预测
1. Overview of Blood Product Industry
1.1 Definition
1.2 Classification
1.3 Recombinant Blood Products
1.4 Industry Chain
1.5 Features
2. Overview of China Blood Product Industry
2.1 Market Size
2.2 Development
2.3 Supply & Demand
2.3.1 Supply
2.3.2 Demand
2.4 Competition
2.5 Operating Environment
2.5.1 International Market
2.5.2 Policy Environment
2.5.3 Domestic Biopharmaceutical Market
2.6 Import & Export
3. Blood Product Market Segments in China
3.1 Human Albumin
3.1.1 Supply & Demand
3.1.2 Competitive Landscape
3.1.3 Development Prospects
3.2 Human Immunoglobulin (pH4) for Intravenous Injection
3.2.1 Supply & Demand
3.2.2 Competitive Landscape
3.3 Blood Coagulation Factor VIII
3.3.1 Supply & Demand
3.3.2 Competitive Landscape
3.3.3 Development Prospects
3.4 Hepatitis B Immunoglobulin
3.4.1 Supply & Demand
3.4.2 Competitive Landscape
3.5 Human Immunoglobulin
3.5.1 Supply & Demand
3.5.2 Competitive Landscape
3.6 Human Prothrombin Complex
3.6.1 Supply & Demand
3.6.2 Competitive Landscape
3.7 Tetanus Immunoglobulin
3.7.1 Supply & Demand
3.7.2 Competitive Landscape
3.8 Human Rabies Immunoglobulin
3.8.1 Supply & Demand
3.8.2 Competitive Landscape
4. Major Chinese Manufacturers
4.1 China Biologic Products Inc.
4.1.1 Profile
4.1.2 Operation
4.1.3 Revenue Structure
4.1.4 Customers and Suppliers
4.1.5 R&D and Investment
4.1.6 Shandong Taibang Biological Products Co., Ltd.
4.1.7 Guizhou Taibang Biological Products Co., Ltd.
4.1.8 Xi'an Huitian Blood Products Co., Ltd.
4.1.9 Outlook and Prediction
4.2 Hualan Biological Engineering Inc.
4.2.1 Profile
4.2.2 Operation
4.2.3 Revenue Structure
4.2.4 Gross Margin
4.2.5 Customers and Suppliers
4.2.6 R&D and Investment
4.2.7 Blood Products
4.2.8 Outlook and Prediction
4.3 Shanghai RAAS Blood Products Co., Ltd.
4.3.1 Profile
4.3.2 Operation
4.3.3 Revenue Structure
4.3.4 Gross Margin
4.3.5 Customers and Suppliers
4.3.6 R&D and Investment
4.3.7 Outlook and Prediction
4.4 Beijing Tiantan Biological Products Co., Ltd.
4.4.1 Profile
4.4.2 Operation
4.4.3 Revenue Structure
4.4.4 Gross Margin
4.4.5 Customers and Suppliers
4.4.6 R&D and Investment
4.4.7 Blood Products (Chengdu Rongsheng Pharmaceutical Co., Ltd.)
4.4.8 Outlook and Prediction
4.5 Zhenxing Biopharmaceutical and Chemical Co., Ltd.
4.5.1 Profile
4.5.2 Operation
4.5.3 Revenue Structure
4.5.4 Gross Margin
4.5.5 Customers and Suppliers
4.5.6 R&D and Investment
4.5.7 Blood Products (Guangdong Shuanglin Bio-Pharmacy Co., Ltd.)
4.5.8 Outlook and Prediction
4.6 Jiangxi Boya Bio-Pharmaceutical Co., Ltd.
4.6.1 Profile
4.6.2 Operation
4.6.3 Revenue Structure
4.6.4 Gross Margin
4.6.5 Customers and Suppliers
4.6.6 R&D and Investment
4.6.7 Outlook and Prediction
4.7 Sichuan Yuanda Shuyang Pharmaceutical Co., Ltd.
4.7.1 Profile
4.7.2 Blood Products
4.8 Shanghai Institute of Biological Products Co., Ltd.
4.8.1 Profile
4.8.2 Blood Products
4.9 Shanxi Kangbao Biological Product Co., Ltd.
4.9.1 Profile
4.9.2 Blood Products
4.10 Green Cross
4.10.1 Profile
4.10.2 Blood Products
4.11 Humanwell Healthcare Group Co., Ltd.
4.11.1 Profile
4.11.2 Operation
4.11.3 Blood Products (Wuhan Zhongyuan Ruide Biological Product Co., Ltd.)
4.12 Walvax Biotechnology Co, Ltd.
4.12.1 Profile
4.12.2 Operation
4.12.3 Blood Products (Hebei Da’an Pharmaceutical Co., Ltd.)
5. Summary and Forecast
5.1 Company Analysis
5.2 Forecast
图:血液的基本组成
表:血液制品的分类及作用
表:基因重组类血制品与传统血制品对比
表:国内外重组血液制品产品种类及对比
图:血液制品产业链
表:2013年中国部分血液制品价格
图:2003-2013年中国血液制品市场规模
表:2008-2013年中国血液制品(分产品)批签发量
图:2009-2013年中国血液制品产品结构(按批签发量计)
图:2002-2013年中国年投浆量
图:截止2014年6中国血浆站资源地域分布
表:中国主流血液制品医保覆盖情况
表:中国与发达国家血液制品人均使用量的对比
表:2013年中国主要血液制品企业血浆站分布、投浆量及血液制品业务收入
图:全球血液制品产品结构
表:国外上市的血液制品
表:目前国外正在进行的新适应症临床试验
表:全球血液制品生产商
表:中国血液制品主要政策
图:2003-2012年中国人血白蛋白价格
图:2007-2013年中国人血白蛋白国产与进口比例(按批签发量计)
表:2008-2013年中国人血白蛋白主要厂商市场份额(按批签发量计)
表:2010年中国与美国静注人免疫球蛋白消耗量比较
图:2007-2013年中国静丙(ph4)的批签发数量及增长率
图:中国与其他国家静丙(ph4)价格对比
图:2007-2013年中国静注人免疫球蛋白主要厂商市场份额(按批签发量计)
图:2008-2013年中国凝血因子VIII批签发数量及增长率
图:2008-2013年中国人凝血因子VIII厂商市场份额(按批签发量计)
表:人源性凝血因子VIII与重组凝血因子VIII的比较
图:2009-2013年中国乙肝免疫球蛋白的批签发数量及增长率
图:2008-2013年中国乙肝免疫球蛋白市场主要厂商市场份额(按批签发量计)
表:2013年中国各剂型人免疫球蛋白价格
图:2008-2013年中国人免疫球蛋白批签发数量及增长率
图:2008-2013年中国人免疫球蛋白批签发量主要厂商市场份额(按批签发量计)
图:2008-2013年中国人凝血酶原复合物批发签量及增长率
图:2008-2013年中国人凝血酶原复合物厂商市场份额(按批签发量计)
图:2008-2012年中国破伤风免疫球蛋白批签发数量及增长率
图:2008-2013年中国破伤风免疫球蛋白主要厂商市场份额(按批签发数量计)
图:2008-2013年中国狂犬病人免疫球蛋白批签发数量及增长率
图:2008-2013年中国狂犬病人免疫球蛋白主要厂商市场份额(按批签发量计)
图:截至2013年底中国生物制品股权结构图
图:2007-2014年中国生物制品营业收入和营业利润
图:2011-2013年中国生物制品毛利率
表:2011-2013年中国生物制品(分产品)营业收入
图:2010-2012年中国生物制品(分产品)营业收入构成
图:2008-2013年中国生物制品前五客户收入贡献及占总营业收入的比重
图:2010-2013年中国生物制品研发投入及占营业收入的比重
表:截止2013年底中国生物制品在研新品
表:2008-2013年山东泰邦血液制品批签发量
表:2008-2013年贵阳黔峰血液制品批签发量
表:2008-2013年西安回天血液制品批签发量
图:2012-2017年中国生物制品营业收入与营业利润
图:2007-2013年华兰生物营业收入和营业利润
表:2007-2013年华兰生物(分行业)营业收入
表:2007-2013年华兰生物(分产品)营业收入
表:2007-2012年华兰生物(分产品)毛利率
图:2007-2013年华兰生物前五客户收入贡献及占总营业收入的比重
图:2007-2012年华兰生物前五供应商采购金额及占总采购金额的比重
图:2007-2013年华兰生物研发投入及占营业收入的比重
表:华兰生物血液制品种类及规格
表:截止2014年5月华兰生物采浆站分布
表:2008-2012年华兰生物血液制品批发签量
图:2007-2013年华兰生物血液制品营业收入及毛利率
表:2007-2013年华兰生物血液制品(分产品)营业收入及毛利率
图:2012-2017年华兰生物营业收入与营业利润
表:截止2013年底上海莱士血浆站分布情况
图:2008-2014年上海莱士营业收入和营业利润
表:2008- 2013 年上海莱士血液制品批发签量
表:2008-2013年上海莱士(分产品)主营业收入
表: 2007-2013年上海莱士(分地区)营业收入
图:2007-2013年上海莱士(分产品)毛利率
图:2007-2013年上海莱士前五客户收入贡献及其占比
图:2007-2012年上海莱士前五供应商采购额占总采购金额的比重
图:2007-2013年上海莱士研发投入及占营业收入的比重
图:2012-2017年上海莱士营业收入与营业利润预测
表:2013年天坛生物主要参股公司及其营收、净利润
图:2007-2014年天坛生物营业收入和营业利润
图:2007-2013年天坛生物(分行业)营业收入
表:2007-2013年天坛生物(分地区)营业收入
图: 2007-2013年天坛生物(分行业)毛利率
图:2007-2013年天坛生物前五供应商及其采购金额占总采购金额比重
图:2007-2013年天坛生物前五客户收入贡献及占总营业收入的比重
表:2013年天坛生物前五客户名称、收入贡献及其占比
图:2009-2013年天坛生物研发成本及占营业收入的比重
表:截至2013年底天坛生物采浆站分布
图:2007-2012年天坛生物血液制品营业收入及毛利率
表:2008-2013年成都蓉生和天坛重庆血液制品批发签量
图:2012-2017年天坛生物营业收入与营业利润
图:2008-2014年ST生化营业收入与营业利润
表:2009-2013年ST生化(分产品)主营业收入
表:2009-2013年ST生化(分产品)毛利率
图:2009-2013年ST生化前五客户收入贡献及占同期营业收入的比重
表:2013年ST生化前五供应商购金额及占同期采购总额的比重
图:2009-2013年ST生化研发投入及占同期营业收入的比重
表:截至2013年底ST生化在研产品进度
图:2010-2013年双林生物投浆量
表:截至2013年底双林生物采浆站分布
表:2008-2013年双林生物血液制品批发签量
图:2009-2013年ST生化血液制品营业收入与毛利率
图:2012-2017年ST生化营业收入与营业利润预测
图:2008-2013年博雅生物采浆量
图:2008-2014年博雅生物营业收入和营业利润
表:2009-2013年博雅生物(分产品)营业收入
表:2011-2013年博雅生物主要血液制品批签发量
表:2009-2013年博雅生物(分地区)主营业收入
图:2009-2012年博雅生物(分产品)毛利率
图:2009-2013年博雅生物前五客户收入贡献及占营业收入的比重
表:2013年博雅生物前五客户名称、收入贡献及占比
图:2009-2012年博雅生物前五供应商采购金额及占总采购金额的比重
图:2009-2013年博雅生物研发投入及占营业收入比重
图:2012-2017年博雅生物营业收入与营业利润预测
表:截止2013年底蜀阳药业血浆站分布
表:2008-2013年远大蜀阳血液制品批签发量
表:2008-2013年上海所血液制品批签发量
表:截止2012年底上海所血浆站分布
表:截止2013年底山西康宝血浆站分布
表:2008-2013年康宝生物血液制品批签发量
表:截止2013年底绿十字(中国)血浆站分布
表:2008-2013年绿十字(中国)血液制品批签发量
图:2009-2013年人福医药营业收入与营业利润
表:2008-2013年武汉瑞德血液制品批发签量
图:沃森生产产业布局
图:2009-2014年沃森生物营业收入与营业利润
表:2009-2013年沃森生物(分行业)营业收入
图:截止2014年6月中国主要血液制品企业浆站分布
图:2013年中国主要血液制品企业投浆量
图:2011-2013年中国主要血液制品企业的血液制品收入
表:中国血液制品生产企业产品线对比
图:2012-2017年中国血液制品市场规模
图:2011-2013年中国主要血液制品企业毛利率
Basic Components of Blood
Classification and Efficacy of Blood Products
Comparison between Gene Recombinant Blood Products and Traditional Blood Products
Comparison between Gene Recombinant Blood Products and Traditional Blood Products in China and Overseas
Blood Product Industry Chain
Prices of Some Blood Products in China, 2013
Market Size of Blood Products in China, 2003-2013
Lot Release Volume of Blood Products (by Product) in China, 2008-2013
Product Structure of Blood Products in China (by Lot Release Volume), 2009-2013
Annual Plasma Volume in China, 2002-2013
Geographical Distribution of Plasma Collection Stations in China as of June 2014
Main Blood Products with Medical Insurance Coverage in China
Comparison of Per Capita Usage of Blood Products in China and Developed Countries
Plasma Station Distribution, Plasma Volume and Blood Product Revenue of Major Blood Product Manufacturers in China, 2013
Product Structure of Global Blood Products
Blood Products on Sale in Foreign Countries
On-going Clinical Trial of New Indications Overseas
Global Blood Product Manufacturers
Major Policies on Blood Products in China
Price of Human Albumin in China, 2003-2012
Ratio of Domestically-produced to Imported Human Albumin in China (by Lot Release Volume), 2007-2013
Market Share of Major Human Albumin Manufacturers in China (by Lot Release Volume), 2008-2013
Comparison between Consumption of Human Immunoglobulin (pH4) for Intravenous Injection in China and the United States, 2010
Lot Release Volume and Growth Rate of Human Immunoglobulin (pH4) for Intravenous Injection in China, 2007-2013
Prices of Human Immunoglobulin (pH4) for Intravenous Injection in China and Other Countries
Market Share of Major Manufacturers of Human Immunoglobulin (pH4) for Intravenous Injection in China (by Lot Release Volume), 2007-2013
Lot Release Volume and Growth Rate of Blood Coagulation Factor VIII in China, 2008-2013
Market Share of Major Blood Coagulation Factor VIII Manufacturers in China (by Lot Release Volume), 2008-2013
Comparison between Human Blood Coagulation Factor VIII and Recombinant Blood Coagulation Factor VIII
Lot Release Volume and Growth Rate of Hepatitis B Immunoglobulin in China, 2009-2013
Market Share of Major Hepatitis B Immunoglobulin Manufacturers in China (by Lot Release Volume), 2008-2013
Prices of Human Immunoglobulin in China by Dosage, 2013
Lot Release Volume and Growth Rate of Human Immunoglobulin in China, 2008-2013
Market Share of Major Human Immunoglobulin Manufacturers in China (by Lot Release Volume), 2008-2013
Lot Release Volume and Growth Rate of Human Prothrombin Complex in China, 2008-2013
Market Share of Major Human Prothrombin Complex Manufacturers in China (by Lot Release Volume), 2008-2013
Lot Release Volume and Growth Rate of Tetanus Immunoglobulin in China, 2008-2012
Market Share of Major Tetanus Immunoglobulin Manufacturers in China (by Lot Release Volume), 2008-2013
Lot Release Volume and Growth Rate of Human Rabies Immunoglobulin in China, 2008-2013
Market Share of Major Human Rabies Immunoglobulin Manufacturers in China (by Lot Release Volume), 2008-2013
Equity Structure of China Biologic Products by the End of 2013
Revenue and Operating Income of China Biologic Products, 2007-2014
Gross Margin of China Biologic Products, 2011-2013
Revenue Breakdown of China Biologic Products by Product, 2011-2013
Revenue Structure of China Biologic Products by Product, 2010-2012
China Biologic Products’ Revenue from Top 5 Customers and % of Total Revenue, 2008-2013
R&D Costs and % of Total Revenue of China Biologic Products, 2010-2013
New Products of China Biologic Products under Research by the End of 2013
Lot Release Volume of Blood Products of Shandong Taibang, 2008-2013
Lot Release Volume of Blood Products of Guiyang Qianfeng, 2008-2013
Lot Release Volume of Blood Products of Xi’an Huitian Blood Products, 2008-2013
Revenue and Operating Income of China Biologic Products, 2012-2017E
Revenue and Operating Income of Hualan Biological, 2007-2013
Revenue Breakdown of Hualan Biological by Sector, 2007-2013
Revenue Breakdown of Hualan Biological by Product, 2007-2013
Gross Margin of Hualan Biological by Product, 2007-2012
Hualan Biological‘s Revenue from Top 5 Customers and % of Total Revenue, 2007-2013
Hualan Biological’ Procurement from Top Five Suppliers and % of Total Procurement, 2007-2012
R&D Costs and % of Total Revenue of Hualan Biological, 2007-2013
Varieties and Specifications of Blood Products of Hualan Biological
Plasma Collection Station Distribution of Hualan Biological by May 2014
Lot Release Volume of Blood Products of Hualan Biological, 2008-2012
Revenue from and Gross Margin of Blood Products of Hualan Biological, 2007-2013
Revenue and Gross Margin of Hualan Biological by Product, 2007-2013
Revenue and Operating Income of Hualan Biological, 2012-2017E
Distribution of Plasma Collection Stations of Shanghai RAAS by the End of 2013
Revenue and Operating Income of Shanghai RAAS, 2008-2014
Lot Release Volume of Shanghai RAAS’s Blood Products, 2008-2013
Operating Revenue Breakdown of Shanghai RAAS by Product, 2008-2013
Revenue Breakdown of Shanghai RAAS by Region, 2007-2013
Gross Margin of Shanghai RAAS by Product, 2007-2013
Shanghai RAAS’s Revenue from Top 5 Customers and % of Total Revenue, 2007-2013
Shanghai RAAS’s Procurement from Top 5 Suppliers and % of Total Procurement, 2007-2012
R&D Costs and % of Total Revenue of Shanghai RAAS, 2007-2013
Revenue and Operating Income of Shanghai RAAS, 2012-2017E
Major Shareholding Companies of Tiantan Biological and Their Revenue, Net Income, 2013
Revenue and Operating Income of Tiantan Biological, 2007-2014
Revenue Breakdown of Tiantan Biological by Sector, 2007-2013
Revenue Breakdown of Tiantan Biological by Region, 2007-2013
Gross Margin of Tiantan Biological by Sector, 2007-2013
Tiantan Biological’s Procurement from Top 5 Suppliers and % of Total Procurement, 2007-2013
Tiantan Biological’s Revenue from Top 5 Customers and % of Total Revenue, 2007-2013
Name List and Revenue Contribution of Tiantan Biological’s Top 5 Customers, 2013
R&D Costs and % of Total Revenue of Tiantan Biological, 2009-2013
Distribution of Blood Plasma Collection Stations of Tiantan Biological by the End of 2013
Revenue from and Gross Margin of Blood Products Business of Tiantan Biological, 2007-2012
Lot Release Volume of Blood Products of Tiantan Biological, 2008-2013
Revenue and Operating Income of Tiantan Biological, 2012-2017E
Revenue and Operating Income of Zhenxing Biopharmaceutical and Chemical, 2008-2014
Operating Revenue Breakdown of Zhenxing Biopharmaceutical and Chemical by Product, 2009-2013
Gross Margin of Zhenxing Biopharmaceutical and Chemical by Product, 2009-2013
Zhenxing Biopharmaceutical and Chemical’s Revenue from Top 5 Customers and % of Total Revenue, 2009-2013
Zhenxing Biopharmaceutical and Chemical’s Procurement from Top 5 Suppliers and % of Total Procurement, 2013
R&D Costs and % of Total Revenue of Zhenxing Biopharmaceutical and Chemical, 2009-2013
Progress of Products under Research of Zhenxing Biopharmaceutical and Chemical by the end of 2013
Plasma Volume of Shuanglin Bio-Pharmacy, 2010-2013
Distribution of Plasma Collection Stations of Shuanglin Bio-Pharmacy by the End of 2013
Lot Release Volume of Blood Products of Shuanglin Bio-Pharmacy, 2008-2013
Revenue from and Gross Margin of Blood Products Business of Zhenxing Biopharmaceutical and Chemical, 2009-2013
Revenue and Operating Income of Zhenxing Biopharmaceutical and Chemical, 2012-2017E
Plasma Collection Volume of Jiangxi Boya Bio-Pharmaceutical, 2008-2013
Revenue and Operating Income of Jiangxi Boya Bio-Pharmaceutical, 2008-2014
Revenue Breakdown of Jiangxi Boya Bio-Pharmaceutical by Product, 2009-2013
Lot Release Volume of Main Blood Products of Jiangxi Boya Bio-Pharmaceutical, 2011-2013
Operating Revenue Breakdown of Jiangxi Boya Bio-Pharmaceutical by Region, 2009-2013
Gross Margin of Jiangxi Boya Bio-Pharmaceutical by Product, 2009-2012
Jiangxi Boya Bio-Pharmaceutical’s Revenue from Top 5 Customers and % of Total Revenue, 2009-2013
Name List and Revenue Contribution of Jiangxi Boya Bio-Pharmaceutical’s Top 5 Customers, 2013
Jiangxi Boya Bio-Pharmaceutical’s Procurement from Top 5 Suppliers and % of Total Procurement, 2009-2012
R&D Costs and % of Total Revenue of Jiangxi Boya Bio-Pharmaceutical, 2009-2013
Revenue and Operating Income of Jiangxi Boya Bio-Pharmaceutical, 2012-2017E
Distribution of Blood Plasma Collection Stations of Yuanda Shuyang by the End of 2013
Lot Release Volume of Blood Products of Yuanda Shuyang, 2008-2013
Lot Release Volume of Blood Products of CNBG Shanghai Institute of Biological Products, 2008-2013
Distribution of Blood Plasma Collection Stations of CNBG Shanghai Institute of Biological Products by the End of 2012
Distribution of Blood Plasma Collection Stations of Shanxi Kangbao Biological Product by the End of 2013
Lot Release Volume of Blood Products of Shanxi Kangbao Biological Product, 2008-2013
Distribution of Blood Plasma Collection Stations of Green Cross China by the End of 2013
Lot Release Volume of Blood Products of Green Cross China, 2008-2013
Revenue and Operating Income of Humanwell Healthcare (Group), 2009-2013
Lot Release Volume of Blood Products of Wuhan Zhongyuan Ruide Biological Product, 2008-2013
Production Industry Layout of Walvax Biotechnology
Revenue and Operating Income of Walvax Biotechnology, 2009-2014
Revenue Breakdown of Walvax Biotechnology by Sector, 2009-2013
Distribution of Plasma Stations of Major Blood Products Manufacturers in China by June 2014
Plasma Volume of Major Blood Products Manufacturers in China, 2013
Revenue from Blood Products of Major Blood Products Manufacturers in China, 2011-2013
Production Lines Comparison of Blood Products Manufacturers in China
China Blood Products Market Size, 2012-2017E
Gross Margin of Major Blood Products Manufacturers in China, 2011-2013
如果这份报告不能满足您的要求,我们还可以为您定制报告,请 留言说明您的详细需求。
|