|
|
|
报告导航:研究报告—
TMT产业—电子半导体
|
|
2014-2015年全球及中国硬质PCB行业研究报告 |
 |
字数:2.7万 |
页数:185 |
图表数:218 |
|
中文电子版:9000元 |
中文纸版:4500元 |
中文(电子+纸)版:9500元 |
|
英文电子版:2600美元 |
英文纸版:2800美元 |
英文(电子+纸)版:2900美元 |
|
编号:ZYW176
|
发布日期:2014-07 |
附件:下载 |
 |
|
|
《2013-2014年全球及中国硬质PCB行业研究报告》包含以下内容:
1、全球PCB产业简介
2、PCB下游市场分析
3、PCB发展趋势
4、光电、笔记本电脑、汽车、内存PCB产业分析
5、PCB行业排名
6、33家PCB厂家研究
PCB行业可分硬板(Rigid PCB)、软板(FPCB)、载板(Substrate)三大类。软板和载板属于新兴领域,早期PCB行业只有硬板,虽然近年来软板和载板发展迅速,但是硬板所占比例仍然超过50%,并且不少硬板PCB厂家的利润率并不比软板和载板低。
PCB行业是成熟的行业,市场增幅一般不超过6%,而硬板厂家的产值一直以来都处于下滑趋势中。2012年是硬板厂家尤其难过的一年,智能手机和平板电脑市场爆发,让硬板厂家展开激烈的价格战,导致利润和收入下滑,大型PCB厂家认为传统硬板缺乏成长空间,纷纷投入软板或载板。2013年除大陆以外的硬板厂家几乎全面回暖,2014年硬板厂家效益更好,回暖更明显。
大型PCB厂家未来的拓展方向集中在载板和软板领域,对硬板则只是维持现状,主要拓展载板的厂家有欣兴、SEMCO、LG INNOTEK、AT&S、DAEDUCK、深南电路、SIMMTECH。主要拓展软板的厂家有臻鼎、young pong集团、DAEDUCK GDS。唯一致力于拓展硬板领域的PCB大厂只有Ibiden。还有部分大厂垂直拓展进入EMS领域,如笔记本电脑PCB第一大厂瀚宇博德(Hannstar Board)和健鼎。这将导致未来传统硬板领域供需更加平衡,而高端的Any layer乃至HDI出现明显的供不应求。
2014年硬板行业加速回暖的另一个原因是日系PCB厂家开始退出。
2013年11月日本松下(Panasonic)宣布大举缩减全球PCB产能,预计2015年第1季以前停产约九成。2013年松下的PCB事业收入大约3.1亿美元,松下的PCB业务,主要是自行研发的ALIVH(Any Layer Interstitial Via Hole)制程,应用在智能型手机领域。2013年3月松下就已传出将缩减台湾、越南的PCB产能,位在桃园县大园乡工厂更是2012年3月中旬才开幕,当时应是争食HTC订单而新设。然而2013年HTC出货量锐减,导致松下产能利用率极低,遂决议退出。
日本汽车PCB大厂CMK也效仿松下,2014年1月宣布2014 年 4 月 30 日关闭旗下 PCB 生产据点YAMANASHI SANKO 、并停止生产手机用多层PCB ALIVH 产品。目前还在使用ALIVH技术只剩下奥地利的AT&S。
日系PCB也出现并购趋势,京瓷在2013年8月收购了NEC-TOPPAN,未来富士通的PCB业务也有可能出售,Daisho Denshi 可能和Hitachi Chemical的PCB业务合并。
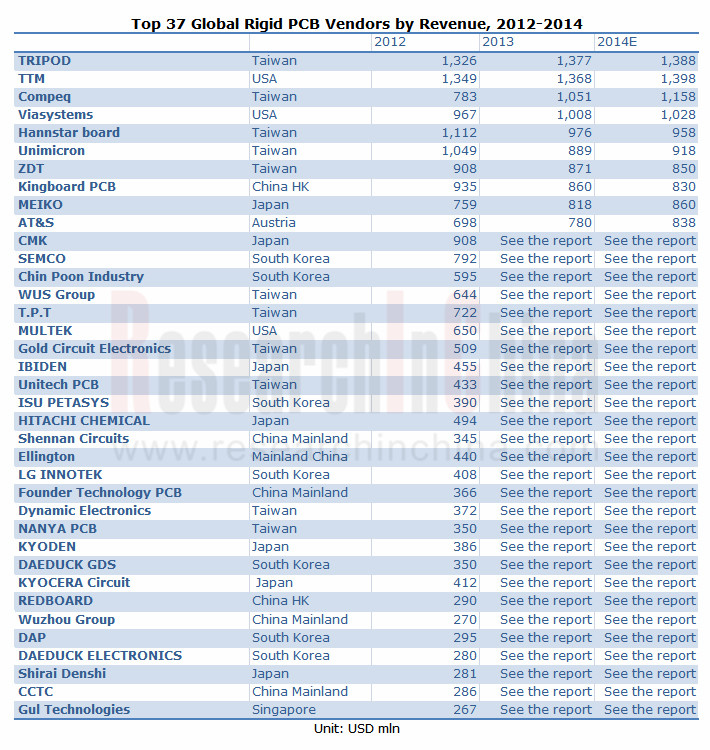
2012-2014年全球PCB硬板厂家收入前37名
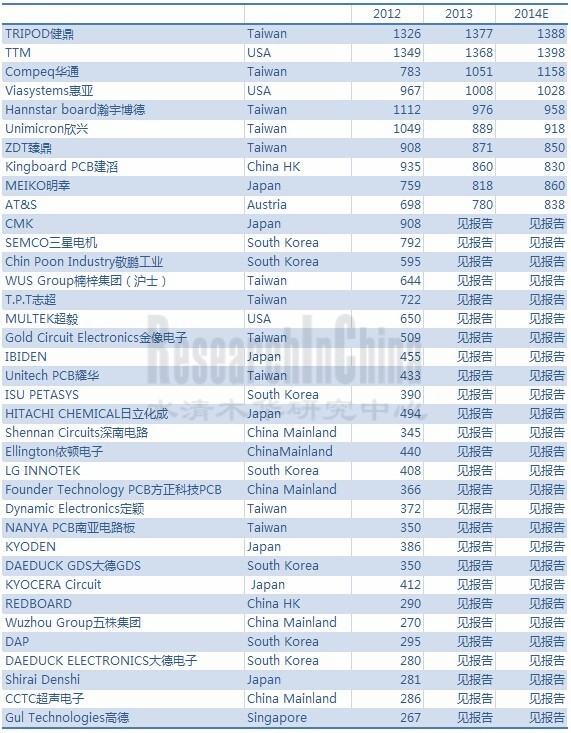
单位:百万美元
Global and China Rigid PCB Industry Report, 2014-2015 is primarily concerned about the followings:
1. Overview of global rigid PCB industry
2. Analysis of PCB downstream market
3. PCB development trend
4. Analysis of photoelectricity, laptop computer, auto and memory PCB industry
5. Ranking of PCB industry
6. 33 PCB Companies
PCB industry can be divided into three categories: rigid PCB, FPCB and substrate. And FPCB and substrate are the emerging industries, for there was only rigid PCB in the early stage. Despite the rapid growth in FPCB and substrate in recent years, rigid PCB has still occupied over 50% of the total industry. And quite a few rigid PCB vendors have gained profits that are not less than that of FPCB and substrate.
PCB industry is fairly mature, with the growth rate generally not more than 6%. And the output value of rigid PCB vendors has long been declining. The year 2012 witnessed a hard time of rigid PCB vendors at a time when smartphone and tablet PC market showed an unexpectedly rapid growth, which sent rigid PCB vendors into fierce price war, thus leading to a drop in profit and revenue. Meanwhile, large PCB companies believed that the traditional rigid PCB had not enough growth potential so that they were beginning to shift their focus to FPCB and substrate. In 2013, almost all the rigid PCB vendors outside mainland China turned around, and even better in 2014 with a higher profit.
In the future, large PCB vendors will concentrate on FPCB and substrate while maintain the status quo for rigid PCB. The major vendors to expand substrate include Unimicron, SEMCO, LG INNOTEK, AT&S, DAEDUCK, Shennan Circuit, SIMMTECH, and the companies, such as Zhen Ding Technology, Young Pong and DAEDUCK GDS will go to the field of FPCB. However, only Ibiden will be committed to development of rigid PCB. In addition, some large vendors go directly into EMS field, such as Tripod Technology and Hannstar Board, the largest laptop PCB giant. This would make the future demand and supply of traditional rigid PCB more balanced, but the high-end Any layer and HDI will be obviously in short supply.
In 2014, the accelerated recovery of rigid PCB industry arises out of another reason—the retreat of Japanese PCB companies.
In November 2013, Japan's Panasonic announced its decision to sharply reduce its PCB capacity globally, with 90% of its global capacity closed down by Q1 2015. In 2013, Panasonic’s revenue from PCB business, mainly involved the R&D of ALIVH (Any Layer Interstitial Via Hole) applied in smartphones, was approximately USD310 million. In March 2013, Panasonic was reported to cut down its PCB capacity in Taiwan and Vietnam. In mid-March 2012, the company established a factory in Dayuan Township of Taoyuan County, a move that was designed to compete for HTC orders. In 2013, however, the shipments of HTC presented a sharp decline, thus resulting in fairly low capacity utilization, hence the determination to withdraw the market.
Still, the Japanese automobile PCB vendor CMK also followed suit and announced in January 2014 that it would shut down its PCB factory YAMANASHI SANKO on April 30, 2014. Meanwhile, it would suspend the production of mobile phone multilayer PCB ALIVH products. Currently, it is Austria’s AT&S alone that uses ALIVH technology.
Japanese PCB also showed the tendency of mergers and acquisitions, with NEC-TOPPAN acquired by Kyocera in August 2013. In future, Fujitsu will also be very likely to sell its PCB business. And Daisho Denshi may merge with PCB business of Hitachi Chemical.
第一章、PCB产业概况
1.1、全球PCB产业产值
1.2、PCB产业近况与未来趋势
1.3、台湾PCB产业
1.4、中国大陆PCB产业
1.4.1、中国大陆PCB产业规模
1.4.2、中国大陆PCB政策
1.5、大陆PCB厂家排名
1.6、欧洲PCB产业
1.7、北美PCB产业
第二章、PCB下游市场
2.1、手机
2.1.1、全球手机市场规模
2.1.2、手机品牌市场占有率
2.1.3、智能手机市场与产业
2.1.4、中国手机市场
2.1.5、中国手机产业
2.2、PC市场
2.2.1、笔记本电脑产业
2.2.2、笔记本电脑代工
2.2.3、平板电脑产业
2.2.4、中国移动PC产业
第三章、PCB产业分析
3.1、PCB技术趋势
3.1.1、手机PCB厂家排名
3.1.2、手机PCB配套关系
3.2、内存模块PCB
3.3、光电板
3.4、汽车电子PCB
3.5、笔记本电脑PCB
3.6、全球PCB厂家排名
第四章、主要PCB厂家研究
4.1、欣兴
4.2、华通
4.3、瀚宇博德
4.4、金像电子
4.5、健鼎
4.6、名幸MEIKO
4.7、CMK
4.7.1、无锡希门凯
4.7.2、瑞升科技
4.7.3、旗利得电子
4.8、IBIDEN
4.9、大德电子
4.10、TTM
4.11、耀华
4.12、AT&S
4.13、建滔
4.13.1、依利安达
4.13.2、科惠线路板
4.13.3、扬宣电子Express Electronics
4.14、SIMMTECH
4.15、志超T.P.T
4.16、依顿电子
4.17、敬鹏
4.18、LG INNOTEK
4.19、SEMCO
4.20、方正电路板
4.21、高德电子
4.22、定颖
4.23、惠亚
4.24、南亚电路板
4.25、深南电路
4.26、沪士电子
4.27、超声电子
4.28、臻鼎ZDT
4.29、MULTEK
4.30、景硕
4.31、SHINKO
4.32、ISU PETASYS
4.33、KYOCERA CIRCUIT SOLUTIONS
1. Overview of PCB Industry
1.1 Output Value of Global PCB Industry
1.2 Recent Developments and Future Trends of PCB Industry
1.3 Taiwan PCB Industry
1.4 Chinese Mainland PCB Industry
1.4.1 Industrial Scale
1.4.2 Policy on PCB
1.5 Ranking of Chinese Mainland PCB Vendors
1.6 European PCB Industry
1.7 North American PCB Industry
2. PCB Downstream Market
2.1 Mobile Phone
2.1.1 Global Mobile Phone Market Size
2.1.2 Market Share of Mobile Phone by Brand
2.1.3 Smartphone Market and Industry
2.1.4 China Mobile Phone Market
2.1.5 China Mobile Phone Industry
2.2 PC Market
2.2.1 Notebook Computer Industry
2.2.2 Notebook Computer Foundry
2.2.3 Tablet PC Industry
2.2.4 China Mobile PC Industry
3. Analysis of PCB Industry
3.1 PCB Technology Trend
3.1.1 Ranking of PCB Companies for Mobile Phone
3.1.2 Supporting Relationship of Mobile Phone PCB
3.2 Memory Module PCB
3.3 Photonics PCB
3.4 PCB for Automotive Electronics
3.5 PCB for Notebook Computer
3.6 Ranking of Global PCB Companies
4. Major PCB Companies
4.1 Unimicron
4.2 Compeq
4.3 Hannstar Board PCB
4.4 Gold Circuit Electronics
4.5 Tripod Technology
4.6 Meiko
4.7 CMK
4.7.1 WUXI CMK
4.7.2 CMK GBM
4.7.3 CMKC DONGGUAN
4.8 IBIDEN
4.9 Daeduck Electronics
4.10 TTM
4.11 Unitech PCB
4.12 AT&S
4.13 Kingboard
4.13.1 Elec&Eltek
4.13.2 Tech-Wise Circuit
4.13.3 Express Electronics
4.14 SIMMTECH
4.15 T.P.T
4.16 Ellington Electronics
4.17 Chinpoon Industrial
4.18 LG INNOTEK
4.19 SEMCO
4.20 Founder PCB
4.21 Gul Technologies
4.22 Dynamic PCB
4.23 Viasystems
4.24 Nanya PCB
4.25 Shennan Circuit
4.26 WUS Electronics
4.27 Guangdong Goworld
4.28 ZDT
4.29 Multek
4.30 Kinsus
4.31 Shinko
4.32 ISU PETASYS
4.33 KYOCERA Circuit Solutions
2001-2015年PCB产业产值
1980-2001年全球PCB产值
PCB产业链
2009-2015年PCB产业收入分布(分技术)
2013年全球PCB产值by layer
2013、2017年全球PCB产业收入地域分布
2012-2014年全球PCB产业收入地域分布
2010-2013年台湾PCB产业收入产品分布
2001年1月-2014年4月台湾PCB厂家收入
2010-2011年中国大陆PCB企业投资结构
2011-2013年大陆PCB产业产值技术分布
2013年大陆PCB厂家收入排名
2013 European PCB Production by End Market
2013年欧洲PCB厂家收入国别分布
2000-2013年欧洲PCB厂家收入国别分布
2009-2013年欧洲主要PCB厂家季度收入
2005-2017年欧洲PCB厂家产值增幅
2013年欧洲TOP50 -PCB厂家
2008年1季度-2014年1季度北美主要PCB厂家收入
2005-2017年北美PCB产值增幅
2007-2014年全球手机出货量
Worldwide Mobile Phone Sales to End Users by Vendor in 2013
2011-2013中国主要厂家智能手机出货量
Worldwide Smartphone Sales to End Users by Vendor in 2013
Worldwide Smartphone Sales to End Users by Operating System in 2013
2013年1月-2014年5月中国手机市场出货量
2014年1季度中国手机市场主要厂家市场占有率
2013年2-12月中国手机月度产量
2008-2015年全球PC出货量
1999年-2013年全球PC出货量
2014年1季度全球PC出货量地域分布
2008-2015年笔记本电脑出货量
2010-2013年全球主要笔记本电脑ODM厂家出货量
2006、2008年主要笔记本电脑代工厂家市场占有率
2010年全球笔记本电脑品牌厂家与代工厂家之间配套关系及出货比例
2011年全球笔记本电脑品牌厂家与代工厂家之间配套关系及出货比例
2011-2016年全球平板电脑出货量
2013年平板电脑主要品牌市场占有率
2012、2013年全球平板电脑制造厂家产量
2004-2012年中国笔记本电脑(包括平板电脑)产量
2010-2012年中国笔记本电脑产量(包括平板电脑)地域分布
2012-2013年主要HDI厂家收入排名
2010-2013年NOKIA手机PCB供应商供应比例
2010-2013年SAMSUNG手机PCB供应商供应比例
2012年LG手机PCB供应商供应比例
2010-2013年ZTE手机PCB供应商供应比例
2010-2011年RIM手机PCB供应商供应比例
2010-2013年APPLE PCB供应商供应比例
2010-2013年内存PCB厂家市场占有率
2006\2010\2011\2012年光电板主要厂家市场占有率
2010-2013年汽车电子PCB厂家收入市场占有率
2011-2012年笔记本电脑PCB板主要厂家市场占有率(按出货量)
2012-2014年全球PCB硬板厂家收入前37名
2012-2014年主要PCB厂家毛利率
2012-2014年25大PCB厂家营业利润率
2003-2014年欣兴收入与毛利率
2009-2014年欣兴收入与营业利润率
2012年1季度-2014年1季度欣兴季度收入与毛利率
2010-2014年欣兴销售额技术分布
2010-2014年欣兴收入下游应用分布
2010-2014欣兴产能Capacity
2004-2013年欣兴CAPEX
欣兴历年合并
2013年欣兴大陆子公司财务数据
2006-2014年华通收入与毛利率
2009-2014年华通收入与营业利润率
2012年5月-2014年5月华通每月收入与增幅
2009-2013年华通主要子公司财务数据
瀚宇博德关系企业图
2006-2014年瀚宇博德收入与毛利率
2009-2014年瀚宇博德收入与营业利润率
2012年5月-2014年5月瀚宇博月度收入与增幅
2009-2012年瀚宇博收入下游应用分布
2009-2012年瀚宇博收入Layer分布
2013年瀚宇博德主要子公司财务数据
2005-2014年金像电子收入与毛利率
2009-2014年金像电子收入与营业利润率
2012年5月-2014年5月金像电子 每月收入与增幅
2010-2012年金像电子收入产品分布
2006-2014年健鼎收入与毛利率
2012-2014年健鼎收入与营业利润率
2013年健鼎收入by application
2013年健鼎收入by layer
2012年5月-2014年5月健鼎每月收入与增幅
2006-2011年健鼎产能
2013年健鼎大陆子公司财务数据
2006-2013财年名幸电子收入与运营利润率
FY 2014名幸电子营业利润分析
2009-2012财年名幸电子大陆子公司收入与运营利润率
2013财年-2015财年名幸电子收入下游应用分布
2010财年-2015财年名幸电子收入技术分布by layer
2005-2015财年CMK收入与运营利润率
2007-2014财年CMK收入下游应用分布
2007-2014财年 CMK收入by layer
2007-2014财年 CMK收入地域分布
2003-2010年无锡希门凯收入与产量
2012年2季度-2014年1季度IBIDEN季度收入业务分布
2012年2季度-2014年1季度IBIDEN季度营业利润业务分布
2010-2015财年ibiden电子事业部收入产品分布
2010-2015财年ibiden CAPEX与depreciation
2005-2014年大德GDS收入与运营利润率
2010-2014年大德GDS收入业务分布
2005-2014年TTM收入与运营利润率
2011-2013年TTM收入地域分布
2013年TTM Revenues by technology
2008-2013年TTM收入下游应用分布
TTM全球工厂分布
2006-2014年耀华收入与毛利率
2009-2014年耀华收入与营业利润率
2012年5月-2014年5月耀华月度收入与增幅
硬板技术路线图
软硬板技术路线图
上海展华电子2010、2013 财务数据
2005-2014财年 AT&S与EBITDA率
AT&S重庆substrate厂ramp
FY2014 AT&S收入地域分布
FY2014 AT&S资产负债表
建滔集团组织结构
2002-2012年建滔集团收入与股东应占利润率
2009-2014年建滔集团收入与税前利润率
2008-2013年建滔集团收入业务分布
依利安达组织结构
2005-2013年依利安达收入与运营利润率
2009-2013年依利安达资产负债表
2006-2013年依利安达收入地域分布
2006-2013年依利安达收入技术分布by layer
依利安达各厂产能
依利安达技术能力
2009-2013年Express Electronics东莞厂收入
2009-2013年Express Electronics苏州厂收入
SIMM TECH组织结构
2009-2013年SIMMTECH资产负债表
2013年1季度-2014年4季度SIMMTECH季度收入产品分布
2012-2015年SIMMTECH收入产品分布
2013年1季度-2014年4季度SIMMTECH季度毛利率与运营利润率
2013年1季度-2014年4季度SIMMTECH季度出货量
2012-2015年SIMMTECH出货量
2013年1季度-2014年4季度SIMMTECH季度产能利用率
2012-2015年SIMMTECH产能利用率
2008-2014年SIMMTECH收入by application
2012-2014年SIMMTECH Substrate收入by application
2005-2014年志超收入与毛利率
2005-2014年志超收入与营业利润率
2012年5月-2014年5月志超每月收入与增幅
2012年志超客户结构
2012年志超收入下游分布
TPT大陆子公司财务数据
依顿电子股权结构
2007-2011年依顿电子收入与毛利率
2009-2013年 依顿电子收入Layer分布
2009-2012依顿电子收入by Region
2007-2012年 依顿电子收入客户结构
2005-2013年敬鹏收入与毛利率
2005-2014年敬鹏收入与营业利润率
2012年5月-2014年5月敬鹏每月收入与增幅
2006-2014年LG INNOTEK收入与运营利润率
2009-2014年SEMCO收入与营业利润率
2007-2012年方正PCB收入与运营利润率
2013年方正PCB子公司财务数据
2010年方正PCB下游应用分布
方正重庆厂产能
珠海方正一厂产能
珠海方正三厂产能
珠海方正五厂产能
方正杭州二厂产能by technology
珠海方正四厂产能
方正HDI技术能力
2005-2013年高德电子收入与运营利润
高德电子关系企业
2006-2014年定颖收入与毛利率
2009-2014年定颖收入与营业利润率
2012年5月-2014年5月定颖每月收入与增幅
2009-2012年定颖产能
2006-2014年惠亚收入与运营利润率
2008-2013年惠亚收入业务分布
惠亚全球分布
2008-2013年惠亚集团收入下游应用分布
惠亚主要客户
2010-2012年惠亚集团收入
DDI收入地域和终端市场分布
DDI工厂分布
DDI主要客户
南亚电路板组织结构
2006-2014年南亚电路板收入与毛利率
2009-2014年南亚电路板收入与营业利润率
2012年5月-2014年5月南亚电路板每月收入与增幅
深南电路技术能力
2007-2014年沪士电子收入与运营利润
2010-2014年沪士电子收入by layer
2007-2013年沪士电子收入下游分布
2012\2013年沪士电子毛利率by applicatio
2013年沪士电子主要客户
2005-2014年超声电子收入与运营利润率
超声电子组织结构
2007-2013年超声电子收入业务分布
2008-2014年臻鼎收入与运营利润率
2008-2014年臻鼎收入与毛利率
2012年5月-2014年5月ZDT月度收入
2012年臻鼎大陆子公司财务报表
2013年臻鼎大陆子公司财务报表
2011-2013年Multek ELIC技术路线图
2011-2013年Multek 软硬板 技术路线图
2011-2013年Multek Microvias技术路线图
2004-2014年景硕收入与毛利率
2009-2014年景硕收入与营业利润率
2012年5月-2014年5月景硕每月收入与增幅
2011-2014年景硕收入产品分布
2011年景硕收入下游应用分布
Q1/2014景硕收入BY Applications
2013\2014 KINSUS客户分布
2007-2015财年Shinko收入与净利润
2010-2014财年Shinko收入业务分布
2008-2014年ISU PETASYS收入与营业利润率
2012-2014年ISU PETASYS收入by technology
Output Value of PCB Industry, 2001-2015
Global PCB Output Value, 1980-2001
PCB Industry Chain
Revenue of PCB Industry by Technology, 2009-2015E
Global PCB Output Value by Layer, 2013
Revenue of Global PCB Industry by Region, 2013 & 2017E
Revenue of Global PCB Industry by Region, 2012-2014
Revenue of PCB Industry in Taiwan by Product, 2010-2013
Revenue of PCB Industry in Taiwan, Jan.2001-Apr.2014
Investment Structure of PCB Companies in Mainland China, 2010-2011
Output Value of PCB Industry in Mainland China by Technology, 2011-2013
Ranking of Chinese Mainland PCB Vendors by Revenue, 2013
European PCB Production by End Market, 2013
Revenue of European PCB Vendors by Country, 2013
Revenue of European PCB Vendors by Country, 2000-2013
Quarterly Revenue of Major European PCB Vendors, 2009-2013
Output Value Growth of European PCB Vendors, 2005-2017E
TOP 50 PCB Vendors in Europe, 2013
Quarterly Revenue of Major North American PCB Vendors, Q1 2008-Q12014
Output Value Growth of North American PCB Vendors, 2005-2017E
Worldwide Mobile Phone Sales to End Users by Vendor in 2013
Smartphone Shipment of Major Chinese Mobile Phone Vendors, 2011-2013
Worldwide Smartphone Sales to End Users by Vendor, 2013
Worldwide Smartphone Sales to End Users by Operating System, 2013
Monthly Shipment of Mobile Phone in China, Jan.2013-May 2014
Market Share of Major Chinese Mobile Phone Vendors, 2014Q1
China's Monthly Mobile Phone Output, Feb-Dec 2013
China's Monthly Mobile Phone Export Value, 2013
Monthly Revenue and Profit of China Communication Terminal Equipment Manufacturing Industry, Feb-Dec 2013
Monthly Investment of China Communication Terminal Equipment Manufacturing Industry, Feb-Dec 2013
Global PC Shipment, 2008-2015
Global PC Shipment, 1999-2013
Global PC Shipment by Region, 2014 Q1
Global PC Shipment by Brand, 2014 Q1
Notebook Computer Shipment, 2008-2015E
Shipment of Major Notebook Computer ODM Vendors, 2010-2013
Market Share of Major Notebook Computer Foundries, 2006 vs.2008
Supporting Relationship and Shipment Ratio between Notebook Computer Brands and OEMs, 2010
Supporting Relationship and Shipment Ratio between Notebook Computer Brands and OEMs, 2011
Supporting Relationship and Shipment Ratio between Notebook Computer Brands and OEMs, 2012-2013
Global Tablet PC Shipment, 2011-2016E
Market Share of Major Tablet PC Brands, 2013
Shipment of Major Tablet PC Vendors, 2012-2013
Output of Notebook Computer (including Tablet PC) in China, 2004-2012
Output of Notebook Computer (including Tablet PC) in China by Region, 2010-2012
Ranking of HDI Vendors by Revenue, 2012-2013
Supply Structure of PCB for NOKIA Mobile Phone, 2010-2013
Supply Structure of PCB for SAMSUNG Mobile Phone, 2010-2013
Supply Structure of PCB for LG Mobile Phone, 2012
Supply Structure of PCB for ZTE Mobile Phone, 2010-2013
Supply Structure of PCB for RIM Mobile Phone, 2010-2011
Supply Structure of PCB for APPLE, 2010-2013
Ranking of DRAM Vendors by Revenue, 2014Q1
Market Share of DRAM Vendors Worldwide, 2014Q1
Market Share of NAND Vendors Worldwide, 2014Q1
Market Share of Memory Module PCB Vendors Worldwide, 2007-2013
Market Share of Major PV Panel Businesses in China, 2006/2010/2011/2012
Market Share of Automotive Electronic PCB Businesses, 2010-2013
Market Share of Major Notebook PCB Vendors by Shipment, 2011-2012
Top 20 PCB Vendors Worldwide by Revenue, 2012-2013
Top 37 Rigid PCB Vendors Worldwide by Revenue, 2012-2014
Gross Margin of Major PCB Vendors, 2012-2014
Gross Margin of Top 25 PCB Vendors, 2012-2014
Unimicron's M & A
Financial Data of Unimicron’s Subsidiariea in Mainland China, 2013
Revenue and Gross Margin of Compeq, 2006-2014
Revenue and Operating Margin of Compeq, 2009-2014
Monthly Revenue and Growth Rate of Compeq, May 2012-May 2014
Financial Data of Major Subsidiaries under Compeq, 2009-2013
Revenue and Gross Margin of Hannstar Board PCB, 2006-2014
Revenue and Operating Margin of Hannstar Board PCB, 2009-2014
Monthly Revenue and Growth Rate of Hannstar Board PCB, May 2012-May 2014
Revenue of Hannstar Board PCB by Application, 2009-2012
Revenue of Hannstar Board PCB by Layer, 2009-2012
Financial Data of Major Subsidiaries under Hannstar Board PCB, 20112
Financial Data of Major Subsidiaries under Hannstar Board PCB, 2013
Revenue and Gross Margin of Gold Circuit Electronics, 2005-2014
Revenue and Operating Margin of Gold Circuit Electronics, 2009-2014
Monthly Revenue and Growth Rate of Gold Circuit Electronics, May 2012-May 2014
Revenue of Gold Circuit Electronics by Product, 2010-2012
Revenue and Gross Margin of Tripod Technology, 2006-2014
Revenue and Operating Margin of Tripod Technology, 2012-2014
Revenue of Tripod Technology by Application, 2013
Revenue of Tripod Technology by Layer, 2013
Monthly Revenue and Growth Rate of Tripod Technology, May 2012-May 2014
Capacity of Tripod Technology, 2006-2011 (Unit: 1,000 m2)
Financial Data of Major Subsidiaries under Tripod Technology in Mainland China, 2013
Revenue and Operating Margin of Meiko, FY2006-FY2015
Operating Income Analysis of Meiko, FY2014
Revenue and Operating Margin of Chinese Mainland Subsidiaries under Meiko, FY2009-FY2014
Revenue of Meiko by Application, FY2013-FY2015
Revenue of Meiko by Layer, FY2013-FY2015
Revenue and Operating Margin of CMK, FY2005-FY2015
Revenue of CMK by Application, FY2007-FY2014
Revenue of CMK by Layer, FY2007-FY2014
Revenue of CMK by Region, FY2007-FY2014
Revenue and Output of WUXI CMK, 2003-2010
Revenue and Operating Margin of TTM, 2005-2014
Revenue of TTM by Region, 2011-2013
Revenue of TTM by Technology, 2013
Revenue of TTM by Application, 2008-2013
Global Presence of TTM Plants
Revenue and Gross Margin of Unitech PCB, 2006-2014
Revenue and Operating Margin of Unitech PCB, 2009-2014
Monthly Revenue and Growth Rate of Unitech PCB, May 2012-May 2014
Technology Roadmap of Rigid PCB
Technology Roadmap of Rigid-Flex PCB
Financial Data of Shanghai Unitech Electronics Co., Ltd, 2012-2013
Revenue and Profit before Taxation Margin of Kingboard, 2009-2013
Balance Sheet of Kingboard, 2009-2013
Revenue of Kingboard by Business, 2008-2013
Revenue and Operating Margin of Elec & Eltek, 2005-2013
Balance Sheet of Elec & Eltek, 2009-2013
Revenue of Elec & Eltek by Region, 2006-2013
Revenue of Elec & Eltek by Layer, 2006-2013
Capacity of Plants under Elec & Eltek
Technology Capability of Elec & Eltek
Revenue from Dongguan Plant of Express Electronics, 2009-2013
Capacity of Dongguan Plant of Express Electronics
Revenue from Suzhou Plant of Express Electronics, 2008-2013
Capacity of Suzhou Plant of Express Electronics
Capacity of Qingyuan Plant of Express Electronics
SIMMTECH’s Balance Sheet, 2009-2013
Revenue and Gross Margin of T.P.T, 2005-2014
Revenue and Operating Margin of T.P.T, 2009-2014
Monthly Revenue and Growth Rate of T.P.T, May 2012-May 2014
Client Structure of T.P.T, 2012
Revenue of T.P.T by Application, 2012
Financial Data of Major Subsidiaries under T.P.T in Mainland China
Revenue and Gross Margin of Ellington Electronics, 2009-2014
Revenue of Ellington Electronics by Layer, 2009-2013
Revenue of Ellington Electronics by Application, 2009-2012H1
Revenue of Ellington Electronics by Region, 2009-2012H1 141
Revenue Structure by Client of Ellington Electronics, 2007-2012
Revenue and Gross Margin of ChinPoon Industrial, 2005-2014
Revenue and Operating Margin of ChinPoon Industrial, 2009-2014
Monthly Revenue and Growth Rate of Chin-Poon Industrial, May 2012-May 2014
Revenue and Operating Margin of Founder PCB, 2007-2013
Financial Data of Founder PCB’s Subsidiaries, 2013
Downstream Application of Founder PCB, 2010-2012
HDI Technology Capability of Founder PCB
Revenue and Operating Income of Gul Technologies, 2005-2013
Revenue and Gross Margin of Dynamic PCB, 2006-2014
Revenue and Operating Margin of Dynamic PCB, 2009-2014
Monthly Revenue and Growth Rate of Dynamic PCB, May 2012-May 2014
Capacity of Dynamic PCB, 2009-2012
Revenue and Operating Margin of Viasystems, 2006-2014
Revenue of Viasystems by Business, 2008-2013
Global Distribution of Viasystems
Revenue of Viasystems by Application, 2008-2013
Revenue of Viasystems, 2010-2012
Revenue of DDI by End Market and Region
Major Clients of DDI
Technology Capabilities of Shennan Circuit
Revenue and Operating Income of WUS Electronics, 2007-2014
Revenue of WUS Electronics by Layer, 2010-2013
Revenue of Wus Electronics by Application, 2007-2013
Gross Margin of Wus Electronics by Application, 2012-2013
Major Clients of WUS Electronics, 2010/2011/2013
Revenue and Operating Margin of Guangdong Goworld, 2005-2014
Revenue of Guangdong Goworld by Business, 2007-2013
Revenue and Operating Margin of ZDT, 2008-2014
Revenue and Gross Margin of ZDT, 2009-2014
Monthly Revenue and Growth Rate of ZDT, May 2012-May 2014
Financial Data of Major Subsidiaries under ZDT in Mainland China, 2012
Financial Data of Major Subsidiaries under ZDT in Mainland China, 2013
Technology Roadmap of Multek ELIC, 2011-2013
Technology Roadmap of Rigid-Flex PCB of Multek, 2011-2013
Technology Roadmap of Multek Microvias, 2011-2013
Revenue and Operating Margin of ISU PETASYS, 2008-2014
Revenue of ISU PETASYS by Technology, 2012-2014
如果这份报告不能满足您的要求,我们还可以为您定制报告,请 留言说明您的详细需求。
|