|
|
|
报告导航:研究报告—
制造业—材料
|
|
2013-2016年全球及中国覆铜板行业研究报告 |
 |
字数:3.2万 |
页数:95 |
图表数:111 |
|
中文电子版:8500元 |
中文纸版:4250元 |
中文(电子+纸)版:9000元 |
|
英文电子版:2200美元 |
英文纸版:2350美元 |
英文(电子+纸)版:2500美元 |
|
编号:ZHP007
|
发布日期:2014-07 |
附件:下载 |
 |
|
|
覆铜板(CCL)是电子工业基础材料,主要用于印制电路板(PCB)的制造,被广泛应用在电视机、收音机、电脑、计算机、移动通讯等电子产品中。
2013年,全球覆铜板产量为7.2亿平方米,同比增长17.9%。其产量主要来自亚洲(占比95.6%),其中又以中国为主。2013年,中国生产覆铜板4.8亿平方米,同比增长6.8%,占全球总产量的 67.1%
就覆铜板细分产品看,玻纤布基覆铜板和纸基覆铜板是目前产量最大的两种产品。2013年,以上两种产品分别占中国覆铜板总产量的61.6%、17.2%。
近几年,覆铜板行业已经进入新一轮增长期,亚洲尤其是中国和东南亚成为了增长最快的两个地区。相关厂商纷纷采取覆铜板产能扩张、产品改造等措施加强覆铜板业务。
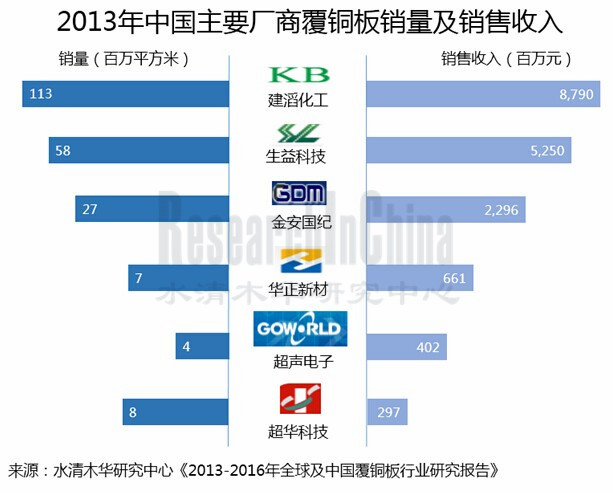
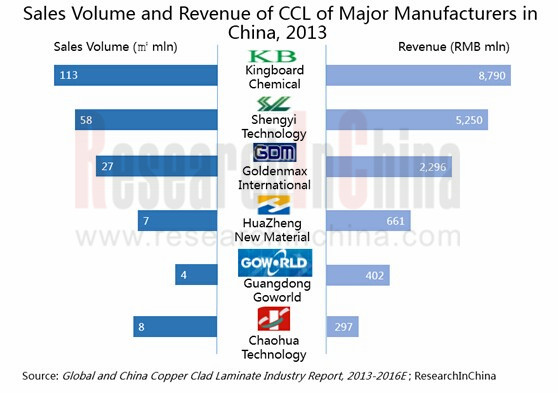
生益科技:2013年8月,开建高性能印制线路板用覆铜板产业化项目。该项目总投资8.3亿元,预计2015年投产。届时,公司将形成年产FR-4 360万张、CEM-3 360万张的能力。
金安国纪:2013年4月,投资3.5亿元建设“年产1,020万张中高等级覆铜板和出售半固化片600万米项目”。目前,该项目的主厂房建设基本完成,一期设备正在安装,预计2014年10月投产。
超华科技:2013年3月,公司“扩建年产240万平方米环保布基覆铜板项目”顺利完工。项目扩建完成后,公司覆铜板生产能力将达到370万平方米/年。
超声电子:2014年4月,投资7,333万元对覆铜板产品结构进行优化升级改造,将新增覆铜板及半固化片产能330万平方米,该项目预计2015年6月达产。
水清木华研究中心《2013-2016年全球及中国覆铜板行业研究报告》着重研究了以下内容:
 全球覆铜板生产、销售、市场结构情况; 全球覆铜板生产、销售、市场结构情况;
中国覆铜板行业发展环境;
中国覆铜板生产、销售、市场结构、竞争格局、进出口情况;
覆铜板主要上下游行业现状;
全球5家、中国14家覆铜板厂商经营情况。
Copper clad laminate (CCL) is the electronic industrial base material, mainly used for the manufacture of printed circuit board (PCB), widely applied in television, radio, computer, mobile communications and other electronic products.
In 2013, the global copper clad laminate output saw a year-on-year increase of 17.9% to 720 million square meters, primarily from Asia (95.6%), especially China, which made 480 million square meters of copper clad laminate that year, up 6.8% from a year earlier, accounting for 67.1% of global production.
Glass-fabric-base copper clad laminate and paper-base copper clad laminate are two biggest niche products by output, respectively making up 61.6% and 17.2% of the total output of China’s copper clad laminate in 2013.
The copper clad laminate industry has entered a new round of growth in recent years, Asia especially China and Southeast Asia are showing the fastest development. Relevant manufacturers have successively taken measures e.g. capacity expansion and product transformation to reinforce the copper clad laminate business.
Guangdong Shengyi Sci. Tech Co., Ltd. embarked on the construction of high-performance PCB copper clad laminate industrialization project in August 2013. The project, with total investment of RMB830 million, is expected to go into operation in 2015. Then the company will form annual production capacity of 3.6-million-piece FR-4 and 3.6-million-piece CEM-3.
In April 2013, Goldenmax International Technology Ltd. invested RMB350 million in building the “10.2-million-piece/a Middle-high-grade CCL Production and 6-million-meter Prepreg Sales Project”. At present, the main workshop construction is almost done, the Phase I equipment is being installed, expected to go into operation in October 2014.
The “2.4-million-square-meter/a Environmental-protection-cloth-base CCL Expansion Project” of Guangdong ChaoHua Technology Co., Ltd. was successfully completed in March 2013. Thereby, the company’s copper clad laminate production capacity will attain 3.7 million square meters/a.
In April 2014, Guangdong Goworld Co., Ltd. spent RMB73.33 million on the optimization and upgrading of copper clad laminate product mix, which, expected to reach design capacity in June 2015, would generate 3.3 million square meters/a copper clad laminate and prepreg.
Global and China Copper Clad Laminate Industry Report, 2013-2016 focuses on the followings:
Global copper clad laminate production, sales and market structure;
China’s copper clad laminate industry development environment;
China’s copper clad laminate production, sales, market structure, competitive structure, import and export;
Main upstream and downstream industries of copper clad laminate;
Operation of 5 global and 14 Chinese copper clad laminate manufacturers.
第一章 覆铜板行业简介
1.1 覆铜板种类
1.2 行业特点
1.3 产业链
第二章 全球覆铜板行业现状
2.1 市场规模
2.2 市场结构
第三章 中国覆铜板行业发展环境
3.1 产业政策
3.2 影响因素
3.2.1 有利因素
3.2.2 不利因素
3.3 进入壁垒
第四章 中国覆铜板市场分析
4.1 市场规模
4.2 市场结构
4.2.1 刚性覆铜板
4.2.2 挠性覆铜板
4.3 竞争格局
4.4 市场趋势
4.5 进出口
4.5.1 进口
4.5.2 出口
第五章 中国覆铜板上下游市场分析
5.1 铜箔市场
5.2 PCB市场
5.2.1 全球
5.2.2 中国
第六章 国外主要覆铜板生产商
6.1 日立化成株式会社
6.1.1 公司简介
6.1.2 经营情况
6.1.3 营收结构
6.1.4 研发情况
6.1.5 覆铜板业务
6.2 罗杰斯集团(Rogers)
6.2.1 公司简介
6.2.2 经营情况
6.2.3 营收结构
6.2.4 覆铜板业务
6.3 其他厂商
6.3.1 伊索拉集团(Isola)
6.3.2 雅龙科技集团(Arlon)
6.3.3 松下电工株式会社
第七章 中国主要覆铜板生产商
7.1 建滔化工集团有限公司
7.1.1 公司简介
7.1.2 经营情况
7.1.3 营收结构
7.1.4 毛利率
7.1.5 覆铜板业务
7.2 广东生益科技股份有限公司
7.2.1 公司简介
7.2.2 经营情况
7.2.3 营收结构
7.2.4 毛利率
7.2.5 覆铜板业务
7.2.6 竞争优势
7.2.7 主要项目
7.3 金安国纪科技股份有限公司
7.3.1 公司简介
7.3.2 经营情况
7.3.3 营收结构
7.3.4 毛利率
7.3.5 覆铜板业务
7.3.6 竞争优势
7.3.7 主要项目
7.4 广东超华科技股份有限公司
7.4.1 公司简介
7.4.2 经营情况
7.4.3 营收结构
7.4.4 毛利率
7.4.5 覆铜板业务
7.4.6 主要项目
7.5 联茂电子股份有限公司
7.5.1 公司简介
7.5.2 经营情况
7.5.3 营收结构
7.5.4 覆铜板业务
7.6 广东汕头超声电子股份有限公司
7.6.1 公司简介
7.6.2 经营情况
7.6.3 主要客户及供应商
7.6.4 营收结构
7.6.5 毛利率
7.6.6 覆铜板业务
7.6.7 主要项目
7.7 浙江华正新材料股份有限公司
7.7.1 公司简介
7.7.2 经营情况
7.7.3 主要客户及供应商
7.7.4 营收结构
7.7.5 毛利率
7.7.6 覆铜板业务
7.7.7 竞争优势
7.8 上海南亚覆铜箔板有限公司
7.8.1 公司简介
7.8.2 经营情况
7.8.3 覆铜板业务
7.9 台光电子材料股份有限公司
7.9.1 公司简介
7.9.2 经营情况
7.9.3 营收结构
7.9.4 毛利率
7.9.5 覆铜板业务
7.10 其他厂商
7.10.1 台耀化学股份有限公司
7.10.2 广东宏仁电子工业有限公司
7.10.3 山东金宝电子股份有限公司
7.10.4 腾辉电子(苏州)有限公司
7.10.5 莱芜金鼎电子材料有限公司
第八章 总结与预测
8.1 市场
8.2 企业
1. Copper Clad Laminate Industry Overview
1.1 Type of Copper Clad Laminate
1.2 Industry Characteristics
1.3 Industry Chain
2. Global Copper Clad Laminate Industry Status
2.1 Market Size
2.2 Market Structure
3. Development Environment of China Copper Clad Laminate Industry
3.1 Industry Policy
3.2 Influencing Factors
3.2.1 Favorable Factors
3.2.2 Negative Factors
3.3 Entry Barriers
4. China Copper Clad Laminate Market
4.1 Market Size
4.2 Market Structure
4.2.1 Rigid Copper Clad Laminate
4.2.2 Flexible Copper Clad Laminate
4.3 Competitive Structure
4.4 Market Trend
4.5 Import & Export
4.5.1 Import
4.5.2 Export
5. Upstream and Downstream of China Copper Clad Laminate Market
5.1 Copper Foil Market
5.2 PCB Market
5.2.1 Global
5.2.2 China
6. Main Foreign Copper Clad Laminate Manufactures
6.1 Hitachi Chemical
6.1.1 Profile
6.1.2 Operation
6.1.3 Revenue Structure
6.1.4 Research & Development
6.1.5 Copper Clad Laminate Business
6.2 Rogers
6.2.1 Profile
6.2.2 Operation
6.2.3 Revenue Structure
6.2.4 Copper Clad Laminate Business
6.3 Other Manufactures
6.3.1 Isola
6.3.2 Arlon
6.3.3 Panasonic
7. Main Chinese Copper Clad Laminate Manufactures
7.1 Kingboard Chemical Holdings Ltd.
7.1.1 Profile
7.1.2 Operation
7.1.3 Revenue Structure
7.1.4 Gross Margin
7.1.5 Copper Clad Laminate Business
7.2 Guangdong Shengyi Sci. Tech Co., Ltd.
7.2.1 Profile
7.2.2 Operation
7.2.3 Revenue Structure
7.2.4 Gross Margin
7.2.5 Copper Clad Laminate Business
7.2.6 Competitive Advantage
7.2.7 Major Project
7.3 Goldenmax International Technology Ltd.
7.3.1 Profile
7.3.2 Operation
7.3.3 Revenue Structure
7.3.4 Gross Margin
7.3.5 Copper Clad Laminate Business
7.3.6 Competitive Advantage
7.3.7 Major Project
7.4 Guangdong ChaoHua Technology Co., Ltd.
7.4.1 Profile
7.4.2 Operation
7.4.3 Revenue Structure
7.4.4 Gross Margin
7.4.5 Copper Clad Laminate Business
7.4.6 Major Project
7.5 ITEQ Corporation
7.5.1 Profile
7.5.2 Operation
7.5.3 Revenue Structure
7.5.4 Copper Clad Laminate Business
7.6 Guangdong Goworld Co., Ltd.
7.6.1 Profile
7.6.2 Operation
7.6.3 Major Customers and Suppliers
7.6.4 Revenue Structure
7.6.5 Gross Margin
7.6.6 Copper Clad Laminate Business
7.6.7 Major Project
7.7 ZheJiang Huazheng New Material Co.,Ltd
7.7.1 Profile
7.7.2 Operation
7.7.3 Major Customers and Suppliers
7.7.4 Revenue Structure
7.7.5 Gross Margin
7.7.6 Copper Clad Laminate Business
7.7.7 Competitive Advantage
7.8 Shanghai Nanya Copper Clad Laminate Co.,Ltd.
7.8.1 Profile
7.8.2 Operation
7.8.3 Copper Clad Laminate Business
7.9 Elite Material Co., Ltd.
7.9.1 Profile
7.9.2 Operation
7.9.3 Revenue Structure
7.9.4 Gross Margin
7.9.5 Copper Clad Laminate Business
7.10 Other Manufactures
7.10.1 Formosa Laboratories, Inc.
7.10.2 Grace Electron Corp. (Guangzhou)
7.10.3 Shandong Jinbao Electronics Co., Ltd
7.10.4 VENTEC Electronics (Suzhou) Co., Ltd.
7.10.5 Shandong Laiwu Jinding Electronic Materials Co., Ltd.
8. Summary and Forecast
8.1 Market
8.2 Enterprise
表:主要覆铜板的结构和材料
图:覆铜板分类
图:覆铜板产业链
图:2008-2016年全球覆铜板行业销售收入及增长率
图:2007-2016年全球覆铜板产量
图:2013年全球覆铜板(分产品)销售收入构成
图:2013年全球覆铜板(分地区)产量构成
表:2008-2013年中国覆铜板相关产业政策
图:2011-2013年中国(大陆)覆铜板产销量
图:2009-2016年中国(大陆)覆铜板行业销售收入及增长率
图:2013年中国(大陆)覆铜板(分产品)产量构成
图:2011-2013年中国(大陆)刚性覆铜板(分产品)产量
图:20008-2013年中国(大陆)挠性覆铜板产量及增速
表:2013年中国覆铜板市场竞争格局
表:2011-2013年中国(大陆)覆铜板进出口
图:2013年中国(大陆)覆铜板(分国家/地区)进口量构成
图:2013年中国(大陆)覆铜板(分国家/地区)进口额构成
图:2013年中国(大陆)覆铜板(分国家/地区)出口量构成
图:2013年中国(大陆)覆铜板(分国家/地区)出口额构成
表:中国铜箔行业主要生产商
图:2009-2013年中国铜箔产量
图:2012-2013年中国铜箔(分产品)销售额构成
图:2009-2016年全球PCB行业产值及增速
图:2006/2013年全球PCB(分地区)产值构成
图:2012-2013年全球PCB(分产品)产值构成
表:PCB行业主要国际生产商
图:2010-2013年中国PCB行业产值
表:2013年中国PCB产业分布
表:中国主要PCB生产商
图:日立化成全球营销网点
图:FY2009-FY2013日立化成净收入及净利润
图:FY2013/FY2015年日立化成(分产品)营业收入构成
图:2009-2013年日立化成(分地区)营业收入
图:2013年日立化成主要研发中心
图:FY2012-FY2013年日立化成(分产品)研发投入构成
图:2013年日立化成全球覆铜板产品营销网络
图:日立化成中国营销网点
表:日立化成中国覆铜板子公司
图:2009-2013年罗杰斯营业收入及净利润
图:2012-2013年罗杰斯(分产品)主营业务收入构成
图:2013年罗杰斯(分地区)主营业务收入构成
图:2011-2013年罗杰斯覆铜板业务收入
图:Isola集团全球营销网络
图:2007-2013年建滔化工营业收入及净利润
图:2012-2013年建滔化工(分产品)营业收入构成
图:2012-2013年建滔化工(分地区)营业收入构成
图:2008-2013年建滔化工毛利及毛利率
表:建滔化工主要覆铜板产品类别
图:2010-2013年建滔化工覆铜板销量
图:2008-2013年建滔化工覆铜板业务收入及增长率
图:2012-2013年建滔化工覆铜板业务收入构成
表:建滔化工主要覆铜板生产工厂/公司
图:2009-2014年生益科技营业收入及净利润
图:2012-2013年生益科技(分产品)主营业务收入构成
图:2012-2013年生益科技(分地区)主营业务收入构成
图:2010-2013年生益科技(分产品)毛利率
表:生益科技主要覆铜板产品类别
图:2009-2013年生益科技覆铜板产销量
图:2009-2013年生益科技覆铜板业务收入及增长率
图:2014年生益科技覆铜板业务收入构成
表:生益科技主要覆铜板生产基地
图:2009-2013年金安国纪营业收入及净利润
图:2012-2013年金安国纪(分产品)主营业务收入构成
图:2012-2013年金安国纪(分地区)主营业务收入构成
图:2010-2013年金安国纪(分产品)毛利率
图:2010-2013年金安国纪覆铜板产销量
图:2010-2013年金安国纪覆铜板业务收入及增长率
表:金安国纪主要覆铜板生产基地
图:2008-2014年超华科技营业收入及净利润
图:2012-2013年超华科技(分产品)主营业务收入构成
图:2013年超华科技(分地区)主营业务收入构成
图:2010-2013年超华科技(分产品)毛利率
图:2011-2013年超华科技覆铜板产品产销量
图:2008-2013年超华科技覆铜板业务收入及增长率
图:联茂电子全球营销网点
图:2010-2013年联茂电子营业收入及净利润
图:2012-2013年联茂电子(分产品)主营业务收入构成
图:2012-2013年联茂电子(分地区)主营业务收入构成
图:2011-2013年联茂电子覆铜板业务收入
图:2013年联茂电子覆铜板产量构成
图:2009-2014年超声电子营业收入及净利润
表:2012-2013年超声电子前五大客户销售额及占比
表:2012-2013年超声电子前五大供应商采购额及占比
图:2012-2013年超声电子(分产品)主营业务收入构成
图:2012-2013年超声电子(分地区)主营业务收入构成
图:2011-2013年超声电子(分产品)毛利率
图:2011-2013年超声电子覆铜板产销量
图:2011-2013年超声电子覆铜板业务收入
图:2011-2013年华正新材营业收入及净利润
表:2013年华正新材前五名客户销售额及占比
表:2013年华正新材前五名供应商采购额及占比
图:2012-2013年华正新材(分产品)主营业务收入构成
图:2012-2013年华正新材(分地区)主营业务收入构成
图:2011-2013年华正新材(分产品)毛利率
表:华正新材主要覆铜板相关子公司
图:2011-2013年华正新材覆铜板产销量
图:2011-2013年华正新材覆铜板业务收入
图:2003-2013年上海南亚营业收入及增速
图:2011-2013年上海南亚覆铜板业务收入
图:台光电子全球营销网络
图:2010-2014年台光电子营业收入及净利润
图:2012-2013年台光电子(分产品)营业收入构成
图:2010-2014年台光电子综合毛利率
表:台光电子覆铜板生产基地及产能分布
图:2010-2013年台光电子覆铜板业务收入
图:台耀集团全球营销网络
图:台耀集团覆铜板生产基地
图:2009-2016年全球及中国覆铜板行业销售收入增速
图:2011-2013年中国覆铜板出口增速
图:2009-2013年全球主要覆铜板生产商营业收入增速
图:2013年中国主要覆铜板生产商市场占有率
Main Contractions and Materials of Copper Clad Laminate
Classification of Copper Clad Laminate
Industry Chain of Copper Clad Laminate
Sales and Growth Rate of Global Copper Clad Laminate, 2008-2016E
Output of Global Copper Clad Laminate, 2007-2016E
Sales Structure of Global Copper Clad Laminate (by Product), 2013
Output Structure of Global Copper Clad Laminate (by Region), 2013
Industry Policy of China Copper Clad Laminate, 2008-2013
Output and Sale Volume of China (Mainland) Copper Clad Laminate, 2011-2013
Sales and Growth Rate of China (Mainland) Copper Clad Laminate, 2009-2016E
Output Structure of China (Mainland) Copper Clad Laminate (by Product), 2013
Output of China (Mainland) Rigid Copper Clad Laminate (by Product), 2011-2013
Output and Growth Rate of China (Mainland) Flexible Copper Clad Laminate, 2008-2013
Competitive Structure of China Copper Clad Laminate Market, 2013
Import and Export of China (Mainland) Copper Clad Laminate, 2011-2013
Import Volume Structure of China (Mainland) Copper Clad Laminate (by Country/Region), 2013
Import Value Structure of China (Mainland) Copper Clad Laminate (by Country/Region), 2013
Export Volume Structure of China (Mainland) Copper Clad Laminate (by Country/Region), 2013
Export Value Structure of China (Mainland) Copper Clad Laminate (by Country/Region), 2013
Main Copper Foil Manufactures of China
Output and of China Copper Foil, 2009-2013
Sales Structure of China Copper Foil (by Product), 2012-2013
Output Value and Growth Rate of Global PCB Industry, 2009-2016E
Output Value Structure of Global PCB Industry (by Region), 2006/2013
Output Value Structure of Global PCB Industry (by Product), 2012-2013
Main International PCB Manufactures
Output Value of China PCB Industry, 2010-2013
Distribution of China PCB Industry, 2013
Main Chinese PCB Manufactures
Global Market Network of Hitachi Chemical
Net Sales and Net Income of Hitachi Chemical, FY2009-FY2013
Revenue Structure of Hitachi Chemical (by Product), FY2013/FY2015E
Revenue of Hitachi Chemical (by Region), 2009-2013
Main R&D Centers of Hitachi Chemical, 2013
R&D Input Structure of Hitachi Chemical (by Product), FY2012-FY2013
Global Copper Clad Laminate Market Network of Hitachi Chemical, 2013
Market Network of Hitachi Chemical in China
Copper Clad Laminate Subsidiaries of Hitachi Chemical in China
Revenue and Net Income of Rogers, 2009-2013
Operating Revenue Structure of Rogers (by Product), 2012-2013
Operating Revenue Structure of Rogers (by Region), 2013
Copper Clad Laminate Revenue of Rogers, 2011-2013
Global Market Network of Isola
Revenue and Net Income of Kingboard Chemical, 2007-2013
Revenue Structure of Kingboard Chemical (by Product), 2012-2013
Revenue Structure of Kingboard Chemical (by Region), 2012-2013
Gross Profit and Gross Margin of Kingboard Chemical, 2008-2013
Main Copper Clad Laminate Products of Kingboard Chemical
Copper Clad Laminate Sales Volume of Kingboard Chemical, 2010-2013
Copper Clad Laminate Revenue and Growth Rate of Kingboard Chemical, 2008-2013
Copper Clad Laminate Revenue Structure of Kingboard Chemical, 2012-2013
Main Copper Clad Laminate Factories/Companies of Kingboard Chemical
Revenue and Net Income of Shengyi, 2009-2013
Operating Revenue Structure of Shengyi (by Product), 2012-2013
Operating Revenue Structure of Shengyi (by Region), 2012-2013
Gross Margin of Shengyi (by Product), 2010-2013
Main Copper Clad Laminate Products of Shengyi
Copper Clad Laminate Output and Sales Volume of Shengyi, 2009-2013
Copper Clad Laminate Revenue and Growth Rate of Shengyi, 2009-2013
Copper Clad Laminate Revenue Structure of Shengyi, 2014
Main Copper Clad Laminate Production Bases of Shengyi
Revenue and Net Income of Goldenmax, 2009-2013
Operating Revenue Structure of Goldenmax (by Product), 2012-2013
Operating Revenue Structure of Goldenmax (by Region), 2012-2013
Gross Margin of Goldenmax (by Product), 2010-2013
Copper Clad Laminate Output and Sales Volume of Goldenmax, 2010-2013
Copper Clad Laminate Revenue and Growth Rate of Goldenmax, 2010-2013
Main Copper Clad Laminate Production Bases of Goldenmax
Revenue and Net Income of Chaohua Tech, 2008-2014
Operating Revenue Structure of Chaohua Tech (by Product), 2012-2013
Operating Revenue Structure of Chaohua Tech (by Region), 2013
Gross Margin of Chaohua Tech (by Product), 2010-2013
Copper Clad Laminate Output and Sales Volume of Chaohua Tech, 2011-2013
Copper Clad Laminate Revenue and Growth Rate of Chaohua Tech, 2008-2013
Global Market Network of ITEQ
Revenue and Net Income of ITEQ, 2010-2013
Operating Revenue Structure of ITEQ (by Product), 2012-2013
Operating Revenue Structure of ITEQ (by Region), 2012-2013
Copper Clad Laminate Revenue of ITEQ, 2011-2013
Copper Clad Laminate Output Structure of ITEQ, 2014
Revenue and Net Income of Goworld, 2009-2014
Goworld’s Sales from Top 5 Customers and % of Total Sales, 2012-2013
Goworld’s Procurement from Top 5 Suppliers and % of Total Procurement, 2012-2013
Operating Revenue Structure of Goworld (by Product), 2012-2013
Operating Revenue Structure of Goworld (by Region), 2012-2013
Gross Margin of Goworld (by Product), 2011-2013
Copper Clad Laminate Output and Sales Volume of Goworld, 2011-2013
Copper Clad Laminate Revenue of Goworld, 2011-2013
Revenue and Net Income of HuaZheng New Material, 2011-2013
HuaZheng New Material’s Sales from Top 5 Customers and % of Total Sales, 2013
HuaZheng New Material’s Procurement from Top 5 Suppliers and % of Total Procurement, 2013
Operating Revenue Structure of HuaZheng New Material (by Product), 2012-2013
Operating Revenue Structure of HuaZheng New Material (by Region), 2012-2013
Gross Margin of HuaZheng New Material (by Product), 2011-2013
Main Copper Clad Laminate Related Subsidiaries of HuaZheng New Material
Copper Clad Laminate Output and Sales Volume of HuaZheng New Material, 2011-2013
Copper Clad Laminate Revenue of HuaZheng New Material, 2011-2013
Revenue and Growth Rate of Nanya, 2003-2013
Copper Clad Laminate Revenue of Nanya, 2011-2013
Global Market Network of Elite Material
Revenue and Net Income of Elite Material, 2010-2014
Revenue Structure of Elite Material (by Product), 2012-2013
Consolidated Gross Margin of Elite Material, 2010-2014
Copper Clad Laminate Production Base and Capacity Distribution of Elite Material
Copper Clad Laminate Revenue of Elite Material, 2010-2013
Global Market Network of Formosa Laboratories
Copper Clad Laminate Production Bases of Formosa Laboratories
Sales Growth Rate of Global and China Copper Clad Laminate Industry, 2009-2016E
Export Growth Rate of China Copper Clad Laminate, 2011-2013
Revenue Growth Rate of Major Global Copper Clad Laminate Manufactures, 2009-2013
Market Share of Major Chinese Copper Clad Laminate Manufacturers, 2013
如果这份报告不能满足您的要求,我们还可以为您定制报告,请 留言说明您的详细需求。
|