|
|
|
报告导航:研究报告—
制造业—材料
|
|
2013-2014年全球及中国锂电池正极材料行业研究报告 |
 |
字数:2.2万 |
页数:130 |
图表数:143 |
|
中文电子版:8000元 |
中文纸版:4000元 |
中文(电子+纸)版:8500元 |
|
英文电子版:2200美元 |
英文纸版:2400美元 |
英文(电子+纸)版:2500美元 |
|
编号:ZYW185
|
发布日期:2014-07 |
附件:下载 |
 |
|
|
《2013-2014年全球及中国锂电池正极材料行业研究报告》包含以下内容:
1、锂电池简介
2、锂电池产业概况
3、锂电池市场
4、锂电池正极材料市场与产业
5、锂电池正极材料发展趋势
6、14家锂电池正极材料厂家研究
7、13家锂电池厂家研究
由于对电动车市场前景看好,众多厂家蜂拥进入锂电池领域,尤其是中国厂家。与全球其他厂家不同,大部分中国厂家产品单一,高度依赖锂电池市场,风险极高。而中国之外的厂家,锂电池所占其收入比例往往都非常低。
近年来虽然手机、平板电脑出货量大增,电池容量也大增,但市场竞争激烈,锂电池平均价格反而下滑。而电动车市场迟迟未能真正启动。锂电池厂家效益下滑明显,对上游原材料领域压力也不小。从2011年起美国QE导致金属价格逐渐降低,锂电池正极材料厂家有能力降低价格,但随着美国宽松货币政策逐渐退出,金属价格有触底反弹的迹象,未来锂电池正极材料厂家如果继续降价,就会减少利润,而下游需求不足,锂电池正极材料厂家仍然不得不降价。
价格是阻碍xEV车市场发展的主要因素,其次还有行驶里程和充电基础设施。政府不可能长期补贴xEV车市场,一旦补贴消失,而xEV车仍然无法和传统汽油车竞争,那么xEV车必然会遭遇严重的市场下滑。2014和2015年xEV电池仍然缺乏成本下降空间,因为市场规模还是太小,即便是产量最大的xEV电池厂家仍然无法供应超过15万辆xEV。进入50万辆级别后,电池成本有望出现明显下滑,xEV价格也有望明显下降,预计在2017年市场出现大幅度增长,达到69.8万辆,预计到2019年达到132万辆。
电动车用锂电池正极材料未来发展方向是NMC,中国厂家最看好的LFP不适合电动车用途,目前业内一致的看法是LFP适合储能(ESS)市场,而不是电动车市场。NMC材料则分为两个类型,一类是以松下为特斯拉供应的LiNi0.8-xCo0.2AlxO2(NCA)为代表,添加镍的比例来提高能量密度,进而提高性能。一类是以LG化学为代表的,减少钴的比例来降低成本。随着特斯拉的成功,高镍NMC材料被认为潜力巨大,全球目前主要生产厂家是日本住友金属矿山和户田工业。ESS市场方面,目前锂电池成本太高,竞争力极低,目前市场局限在通信基站用电源中。
即便电动车市场逐渐扩大,但也并非所有的锂电池供应厂家都能从中受益,LG化学、松下、AESC这三家占据了超过70%的市场份额,三星SDI、LEJ则属于第二梯队。三星SDI垄断供应宝马和大众的电动车电池,未来有望跻身第一梯队。
Global and China Lithium Battery Cathode Material Industry Report, 2013-2014 mainly contains the followings:
1. Brief introduction to lithium battery
2. Overview of lithium battery industry
3. Lithium battery market
4. Lithium battery cathode material market and industry
5. Trends in lithium battery cathode material development
6. 14 lithium battery cathode material manufacturers
7. 13 lithium battery companies
Given bright prospects in electric vehicle market, many manufacturers, especially those from China, have crowded into the lithium battery industry. Unlike competitors from other countries, most Chinese manufacturers have a single type of product, which leaves them highly dependent on lithium battery market and thus brings with it extremely high risks. And as for the manufacturers outside of China, lithium battery typically occupies a rather low proportion of the total revenue.
Despite a sharp rise in shipments of mobile phones and tablet PCs as well as battery capacity in recent years, the average price of lithium batteries declined amid the fierce market competition. The electric vehicle market hasn't really started, and the significant decline in benefits of lithium battery companies has brought great pressure to the upstream raw materials. The US QE has led to a gradual fall in metal prices starting from 2011, lithium battery cathode material manufacturers have the ability to lower the prices. However, as the US QE programme is being phased out, the metal prices are very likely to bottom out. In future, if lithium battery cathode material manufacturers continue to lower the prices, their profits will shrink, but in face of the insufficient demand from downstream sectors, the manufacturers still have to cut prices.
The price is one of the main factors that hinder the development of xEV vehicle market, followed by mileage and charging infrastructure. It is impossible for the government to provide a long-term subsidy to xEV vehicle market. And once the subsidies come to an end, xEV vehicle still cannot compete with traditional gasoline vehicles, which will inevitably result in a severe decline. During 2014-2015, there will still be a lack of cost-down potential for xEV battery, for the market size remains relatively small. Even the xEV battery manufacturer with the largest output is unable to supply more than 150,000 xEV vehicles. But when the output reaches 500,000 units, the battery cost is expected to see obvious decline, which will therefore bring down the xEV prices remarkably. It is projected that by 2017 the market will present a substantial increase, to 698,000 units, and that this figure will climb to 1.32 million units by 2019.
Lithium battery cathode materials for electric vehicles will develop toward NMC, and the LFP favored by Chinese manufacturers is not suitable for electric vehicles. Currently, it is generally believed that LFP is applicable to ESS market rather than electric vehicle market. The NMC materials are divided into two types: one is represented by LiNi0.8-xCo0.2AlxO2 (NCA) supplied by Panasonic to Tesla, which raises energy density by increasing the proportion of nickel to improve the performance. The other is represented by LG CHEM, which lowers the costs by reducing the proportion of cobalt. With the success of Tesla, high-nickel NMC materials are believed to have great potential, with the major global manufacturers now including SMM Group and TODA KOGYO. In terms of ESS market, the costs of lithium battery are too high and extremely less competitive, and the ESS is used only in the power supply for communication base stations.
Even if the electric vehicle market gradually expands, not all of the lithium battery suppliers will benefit from it. The first-tier manufacturers—LG CHEM, Panasonic and AESC have occupied more than 70% of market share. Samsung SDI and LEJ are among the second-tier manufacturers, of which Samsung SDI monopolies the supply of BMW and Volkswagen electric vehicle batteries, and is expected to be among the first-tier manufacturers in future.
第一章、锂电池产业概况
1.1、锂电池简介
1.2、锂电池制造流程
1.3、全球锂电池市场规模
1.4、全球锂电池产业地域格局
1.5、中国电池产业概况
1.5.1、中国锂电池产业概况
1.5.2、中国锂电池出口
1.6、全球锂电池产业排名
1.7、锂电池产业链
1.7.1、锂电池成本结构
1.7.2、锂电池产业链
第二章、锂电池市场
2.1、圆柱型锂电池市场
2.2、圆柱型锂电池产业
2.3、xEV车市场
2.4、美国xEV市场
2.5、欧洲xEV市场
2.6、日本xEV市场
2.7、中国xEV市场
2.8、xEV电池供应链
2.9、xEV电池市场占有率
2.10、xEV电池发展现状
2.11、ESS市场
2.12、手机市场
2.13、笔记本电脑市场
2.14、平板电脑市场
第三章、锂电池正极材料市场与产业
3.1、锂电池正极材料简介
3.2、锂电池正极材料市场未来趋势
3.3、锂电池正极材料技术趋势
3.4、日本锂电池正极材料主要厂家出货量
3.5、韩国锂电池正极材料主要厂家出货量
3.6、台湾与欧洲锂电池正极材料主要厂家出货量
3.7、中国大陆锂电池正极材料主要厂家出货量
3.8、中国锂电池正极材料行业排名
第四章、锂电池正极材料厂家研究
4.1、Umicore
4.2、杉杉
4.3、当升科技
4.4、湖南瑞翔新材料
4.5、宁波金和
4.6、中信国安盟固利
4.7、天津巴莫科技
4.8、北大先行
4.9、天骄科技
4.10、日亚化学
4.11、L&F
4.12、田中化学研究所Tanaka Chemical
4.13、户田工业TODA KOGYO
4.14、天津斯特兰
第五章、锂电池厂家研究
5.1、比克
5.2、比亚迪
5.3、飞毛腿
5.4、天津力神
5.5、新能源科技ATL(TDK)
5.6、索尼
5.7、三星SDI
5.8、LG化学
5.9、新普
5.10、顺达科技
5.11、德赛电池
5.12、欣旺达
5.13、Panasonic
1 Overview of Lithium Battery Industry
1.1 Lithium Battery Introduction
1.2 Lithium Battery Manufacturing Process
1.3 Global Lithium Battery Market Size
1.4 Regional Pattern of Global Lithium Battery Industry
1.5 China Lithium Battery Industry Overview
1.5.1 Overview
1.5.2 Exports
1.6 Global Lithium Battery Industry Ranking
1.7 Lithium Battery Industry Chain
1.7.1 Cost Structure
1.7.2 Industry Chain
2 Lithium Battery Market
2.1 Cylinder Lithium Battery Market
2.2 Cylinder Lithium Battery Industry
2.3 xEV Vehicle Market
2.4 U.S. xEV Market
2.5 Europe xEV Market
2.6 Japan xEV Market
2.7 China xEV Market
2.8 xEV Battery Supply Chain
2.9 xEV Battery Market Share
2.10 xEV Battery Developments
2.11 ESS Market
2.12 Mobile Phone Market
2.13 Laptop Computer Market
2.14 Tablet PC Market
3 Lithium Battery Cathode Materials Market and Industry
3.1 Lithium Battery Cathode Materials Introduction
3.2 Lithium Battery Cathode Materials Market Trend
3.3 Technology Trends in Lithium Battery Cathode Materials
3.4 Shipments of Major Lithium Battery Cathode Materials Companies in Japan
3.5 Shipments of Major Lithium Battery Cathode Materials Companies in South Korea
3.6 Shipments of Major Lithium Battery Cathode Materials Companies in Taiwan and Europe
3.7 Shipments of Major Lithium Battery Cathode Materials Companies in Mainland China
3.8 China Lithium Battery Cathode Materials Industry Ranking
4 Lithium Battery Cathode Materials Companies
4.1 Umicore
4.2 Ningbo Shanshan Co., Ltd.
4.3 Beijing Easpring Material Technology Co., Ltd.
4.4 Hunan Reshine New Material Co., Ltd.
4.5 Ningbo Jinhe New Materials Co., Ltd.
4.6 CITIC GUOAN MGL
4.7 Tianjin B&M Science and Technology Joint-stock Co., Ltd.
4.8 Pulead Technology Industry Co., Ltd.
4.9 Shenzhen Tianjiao Technology Co., Ltd.
4.10 NICHIA
4.11 L&F
4.12 Tanaka Chemical
4.13 TODA KOGYO
4.14 Tianjin STL Energy Technology Co., Ltd.
5 Lithium Battery Companies
5.1 China BAK Battery, Inc. (CBAK)
5.2 BYD
5.3 SCUD
5.4 Tianjin Lishen Battery Joint-Stock Co., Ltd.
5.5 ATL (TDK)
5.6 Sony
5.7 Samsung SDI
5.8 LG Chem
5.9 Simplo Technology
5.10 Dynapack
5.11 DESAY
5.12 Sunwoda
5.13 Panasonic
2005-2015年全球锂电池出货量
2005-2015年全球锂电池市场规模
2009-2015年全球锂电池市场下游分布
2009-2015年全球锂电池市场出货量形状分布
2009-2015年全球锂电池市场 形状分布
2005-2012年全球锂电池产业地域分布(按金额)
2012、2013年中国各种电池产量
2012、2013年中国各种电池收入
2013年中国TOP 20 锂电池cells厂家收入排名
2013年中国TOP 10 POWER锂电池cells厂家收入排名
2013年中国TOP 8 锂电池Packs厂家收入排名
2007-2013年中国锂可充电电池出口量与出口额
2013年锂一次电池出口数量地域分布
2013年锂一次电池出口前10大国家(地区)
2013年锂一次电池出口前10大企业出口额
2013年锂离子电池出口数量地域分布
2013年锂离子电池出口前10大国家(地区)
2013年锂离子电池出口前10大企业出口额
2005-2012年全球主要锂电池厂家出货量
2009-2012年全球主要锂电池厂家收入排名
钴酸锂型锂电池成本结构
锂电池产业链
2012-2016年全球圆柱锂电池下游需求量
2012-2016年全球圆柱锂电池需求量下游分布
2012-2016年全球圆柱锂电池平均价格
2012-2016年全球圆柱型锂电池产量地域分布
2012、2013年全球主要圆柱锂电池厂家产量
2012、2013年全球主要圆柱锂电池厂家收入
2011-2019年xEV车市场出货量
2014、2019年全球xEV出货量地域分布
2013年主要地区EV、PHEV出货量
2013年全球xEV主要厂家出货量
2013年美国xEV分车型销量
2013年和2014年上半年美国xEV出货量排名
2013年欧洲xEV市场主要车型市场占有率
2013年欧洲xEV出货量排名
2013年日本xEV市场主要车型市场占有率
2013年日本xEV出货量排名
2013年中国xEV市场主要厂家市场占有率
xEV电池供应商对应关系
2013年xEV电池厂家市场占有率
2013年xEV电池厂家产能利用率
2013、2014年xEV电池厂家市场占有率(收入)
2011、2020年ESS市场规模
2012-2020 Global Grid-Scale Energy Storage System Market Value
2012-2020 Global Application For Grid-Scale Energy Storage Market Value
2012-2020 Asia Application For Grid-Scale Energy Storage Market Value
2007-2015年全球手机出货量
Worldwide Smartphone Sales to End Users by Vendor in 2013 (Thousands of Units)
Worldwide Smartphone Sales to End Users by Operating System in 2013 (Thousands of Units)
Worldwide Mobile Phone Sales to End Users by Vendor in 2013 (Thousands of Units)
2008-2015年笔记本电脑出货量
2010-2013年全球主要笔记本电脑ODM厂家出货量(万台)
2011-2016年全球平板电脑出货量
2013年平板电脑主要品牌市场占有率
2012、2013年全球平板电脑制造厂家产量
主要正极材料技术的比较
2012-2020年各种锂电池正极材料价格趋势
2012-2016年全球锂电池正极材料市场规模
2009-2015年全球锂电池正极材料出货量技术分布
2012-2015年全球锂电池正极材料销售额技术分布
ESS对电池要求
2012-2015年日本锂电池正极材料出货量与销售额
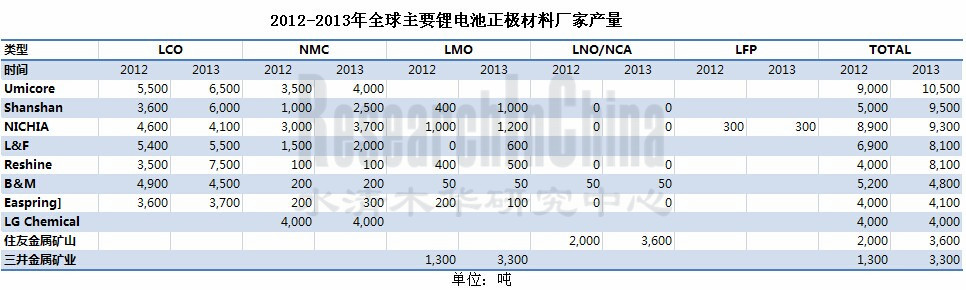
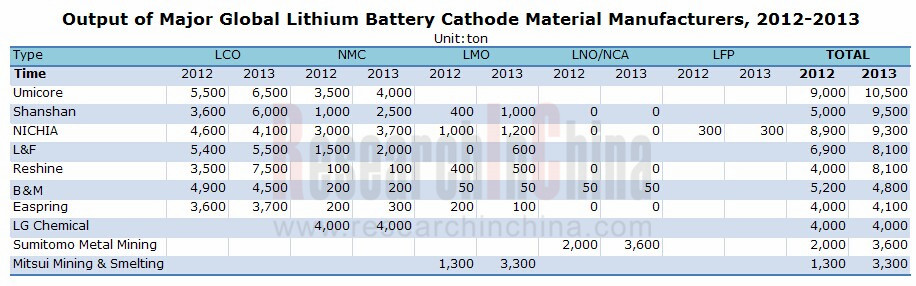
日本2012、2013年锂电池正极材料厂家出货量
2012、2013韩国锂电池正极材料主要厂家出货量
2012、2013台湾与欧洲锂电池正极材料主要厂家出货量
2013年中国锂电池正极材料厂家收入排名
2010-2011年中国锂电池正极材料厂家收入排名
2010年中国磷酸铁锂供应商一览
Umicore组织结构
2005-2014年Umicore收入与EBIT率
2008-2014年UMICORE ENERGY MATERIAL收入与EBIT
Umicore电池材料基地
Umicore中国区组织结构
Umicore中国分布
Umicore中国区收入产品分布
2007-2014年杉杉股份收入与营业利润
2007-2013年杉杉股份收入产品分布
当升科技股份机构
2007-2014年当升科技收入与营业利润率
2011年当升材料科技收入客户分布
湖南瑞翔新材料组织结构
2007-2014年天津巴莫科技B&M Science and Technology收入与营业利润
2013年3季度底天津巴莫科技财务数据
2009年天津巴莫科技前五大客户
北大先行组织结构
2003-2014年日亚化学收入与运营利润率
日亚化学2012\2013年产量
2006-2014年L&F收入与运营利润
2012-2013年 L&F产量技术分布
2006-2015财年田中化学Tanaka Chemical收入与运营利润
2009-2014财年 Tanaka Chemical资产负债表
2011-2014财年 Tanaka Chemical收入业务分布
2009-2014财年田中化学研究所产品出货量
2010-2014财年户田工业TODA KOGYO销售额\营业利润\净利润
2010-2014财年户田工业TODA KOGYO资产负债
比克组织结构
比克电池发展历程
2003-2014财年比克电池收入与运营利润率
2004-2013财年比克电池收入产品分布
2004-2013财年比克电池收入地域分布
比克电池主要客户
BAK原材料供应商
2007-2013年比亚迪电池业务收入与毛利率
2003-2015年比亚迪电池业务收入产品分布
2008-2015年比亚迪充电电池业务毛利率与产能利用率
2008-2015年比亚迪电池业务毛利率
2006-2010年比亚迪电池销售平均价格
2006-2011年比亚迪电池出货量
2008-2010年比亚迪电池业务产能、产量、销量、ASP
2003-2014年飞毛腿收入与税前 利润率
2009-2013年飞毛腿资产负债
2005-2010年飞毛腿电池销量
2011-2013年飞毛腿收入产品分布
2012-2013年飞毛腿出货量产品分布
2004-2014年力神收入与运营利润率
2008-2014年三星SDI收入与营业利润率
2013年1季度-2014年1季度三星SDI毛利率、营业利润率
2007-2014年三星SDI电池业务收入与出货量
2007-2014年三星SDI电池业务收入与ASP
2010-2014年三星SDI电池业务收入与营业利润率
2011-2014年三星SDI收入产品分布
2012、2013年三星SDI收入地域分布
2017年三星SDI收入产品分布
2010-2013年天津三星SDI收入
2013年天津三星SDI财务数据
2007-2014年LG化学收入与营业利润率
Q/2012-Q1/2014年LG化学季度收入与营业利润率
2010-2014年LG化学Energy Solution业务收入与营业利润率
2010-2014年LG化学Energy Solution业务capex
2000-2014年新普收入与毛利率
2012年6月-2014年6月新普月度收入
2004-2013年新普出货量与ASP
2004-2013年新普笔记本电脑电池市场占有率
2013新普大陆子公司财务数据
2005-2014年顺达科技收入与毛利率
2012年6月-2014年6月顺达科月度收入
2008-2014年德赛电池收入与营业利润率
2009-2013年德赛电池资产负债
2008-2014年欣旺达收入与营业利润率
2008-2013年欣旺达资产负债
2013年欣旺达收入下游分布
2013年欣旺达毛利下游分布
Global Lithium Battery Shipments, 2005-2015E
Global Lithium Battery Market Size, 2005-2015E
Global Lithium Battery Market by Applications, 2009-2015E
Global Lithium Battery Shipments by Shape, 2009-2015E
Global Lithium Battery Market by Shape, 2009-2015E
Geographical Breakdown of Global Lithium Battery Industry (by Value), 2005-2012
China’s Battery Output by Type, 2012-2013
China’s Battery Revenue by Type, 2012-2013
Ranking of China’s Top 20 Lithium Battery Companies by Revenue, 2013
Ranking of China’s Top 10 Power Lithium Battery Companies by Revenue, 2013
Ranking of China’s Top 8 Lithium Battery Pack Companies by Revenue, 2013
China’s Rechargeable Lithium Battery Export Volume and Value, 2007-2013
Primary Lithium Battery Export Volume by Region, 2013
Top 10 Primary Lithium Battery Export Countries/Regions, 2013
Export Value of Top 10 Primary Lithium Battery Export Enterprises, 2013
Lithium-ion Battery Export Volume by Region, 2013
Top 10 Lithium-ion Battery Export Countries/Regions, 2013
Export Value of Top 10 Lithium-ion Battery Export Enterprises, 2013
Shipments of Major Global Lithium Battery Companies, 2005-2012
Revenue Ranking of Major Global Lithium Battery Companies, 2009-2012
Cost Structure of LiCoO2 Lithium Battery
Lithium Battery Industry Chain
Global Downstream Demand for Cylinder Lithium Battery, 2012-2016E
Global Demand for Cylinder Lithium Battery by Applications, 2012-2016E
Average Price of Global Cylinder Lithium Battery, 2012-2016E
Global Cylinder Lithium Battery Output by Region, 2012-2016E
Output of Major Global Cylinder Lithium Battery Companies, 2012-2013
Revenue of Major Global Cylinder Lithium Battery Companies, 2012-2013
Shipments of xEV Vehicle Market, 2011-2019E
Global xEV Shipments by Region, 2014 VS 2019E
EV and PHEV Shipments in Main Regions, 2013
Shipments of Major Global xEV Manufacturers, 2013
U.S. xEV Sales Volume by Model, 2013
U.S. xEV Shipment Ranking, 2013-2014H1
Europe xEV Market Share by Model, 2013
Europe xEV Shipment Ranking, 2013
Japan xEV Market Share by Model, 2013
Japan xEV Shipment Ranking, 2013
China xEV Market Share by Manufacturer, 2013
Supply Relations between xEV Manufacturers and xEV Battery Companies
Market Share of xEV Battery Companies, 2013
Capacity Utilization of xEV Battery Companies, 2013
Market Share of xEV Battery Companies (by Revenue), 2013-2014
ESS Market Size, 2011 VS 2020E
Market Value of Global Grid-Scale Energy Storage System, 2012-2020E
Market Value of Global Application for Grid-Scale Energy Storage, 2012-2020E
Market Value of Asia Application for Grid-Scale Energy Storage, 2012-2020E
Global Mobile Phone Shipments, 2007-2015E
Worldwide Smartphone Sales to End Users by Vendor, 2013
Worldwide Smartphone Sales to End Users by Operating System, 2013
Worldwide Mobile Phone Sales to End Users by Vendor, 2013
Laptop Computer Shipments, 2008-2015E
Shipments of Major Global Laptop ODMs, 2010-2013
Global Tablet PC Shipments, 2011-2016E
Market Share of Main Tablet PC Brands, 2013
Output of Global Tablet PC Companies, 2012-2013
Technical Comparison of Main Cathode Materials
Price Trends in Various Lithium Battery Cathode Materials, 2012-2020E
Global Lithium Battery Cathode Material Market Size, 2012-2016E
Global Lithium Battery Cathode Material Shipments by Technology, 2009-2015E
Global Lithium Battery Cathode Material Sales by Technology, 2012-2015E
ESS Requirements for Battery
Japan’s Lithium Battery Cathode Material Shipments and Sales, 2012-2015E
Shipments of Lithium Battery Cathode Material Manufacturers in Japan, 2012-2013
Shipments of Lithium Battery Cathode Material Manufacturers in South Korea, 2012-2013
Shipments of Lithium Battery Cathode Material Manufacturers in Taiwan and Europe, 2012-2013
Revenue Ranking of Lithium Battery Cathode Material Manufacturers in China, 2013
Revenue Ranking of Lithium Battery Cathode Material Manufacturers in China, 2010-2011
Name List of Lithium Iron Phosphate Suppliers in China, 2010
Organization Structure of Umicore
Revenue and EBIT Margin of Umicore, 2005-2014
Energy Material Revenue and EBIT of Umicore, 2008-2014
Battery Material Base of Umicore
Organization Structure of Umicore Greater China
Distribution of Umicore in China
Revenue Breakdown of Umicore Greater China by Product
Revenue and Operating Income of Shanshan Corporation, 2007-2014
Revenue Breakdown of Shanshan Corporation by Product, 2007-2013
Organization Structure of Beijing Easpring Material Technology
Revenue and Operating Margin of Beijing Easpring Material Technology, 2007-2014
Revenue Breakdown of Beijing Easpring Material Technology by Customer, 2011
Organization Structure of Hunan Reshine New Material
Revenue and Operating Income of Tianjin B&M Science and Technology, 2007-2014
Financial Data of Tianjin B&M Science and Technology by the end of 2013Q3
Top 5 Customers of Tianjin B&M Science and Technology, 2009
Organization Structure of Pulead Technology Industry
Revenue and Operating Margin of NICHIA, 2003-2014
Output of NICHIA 2012-2013
Revenue and Operating Income of L&F, 2006-2014
Output Breakdown of L&F by Technology, 2012-2013
Revenue and Operating Income of Tanaka Chemical, FY2006-FY2015E
Balance Sheet of Tanaka Chemical, FY2009-FY2014
Revenue Breakdown of Tanaka Chemical by Business, FY2011-FY2014
Product Shipments of Tanaka Chemical, FY2009-FY2014
Sales/Operating Income/Net Income of TODA KOGYO, FY2010-FY2014
Assets and Liabilities of TODA KOGYO, FY2010-FY2014
Organization Structure of CBAK
Development History of CBAK
Revenue and Operating Margin of CBAK, FY2003-FY2014
Revenue Breakdown of CBAK by Product, FY2004-FY2013
Revenue Breakdown of CBAK by Region, FY2004-FY2013
Major Customers of CBAK
Raw Material Suppliers of CBAK
Revenue and Gross Margin of BYD Battery, 2007-2013
Revenue Breakdown of BYD Battery by Product, 2003-2015E
Gross Margin and Capacity Utilization of BYD Rechargeable Battery, 2008-2015E
Gross Margin of BYD Battery, 2008-2015E
Average Selling Price of BYD Battery, 2006-2010
Shipments of BYD Battery, 2006-2011
Capacity, Output, Sales Volume and ASP of BYD Battery, 2008-2010
Revenue and EBIT Margin of SCUD, 2003-2014
Assets and Liabilities of SCUD, 2009-2013
Sales Volume of SCUD Battery, 2005-2010
Revenue Breakdown of SCUD by Product, 2011-2013
Shipment Breakdown of SCUD by Product, 2012-2013
Revenue and Operating Margin of Lishen, 2004-2014
Revenue and Operating Margin of Samsung SDI, 2008-2014
Gross Margin and Operating Margin of Samsung SDI, 2013Q1-2014Q1
Revenue and Shipments of Samsung SDI Battery, 2007-2014
Revenue and ASP of Samsung SDI Battery, 2007-2014
Revenue and Operating Margin of Samsung SDI Battery, 2010-2014
Revenue Breakdown of Samsung SDI by Product, 2011-2014
Revenue Breakdown of Samsung SDI by Region, 2012-2013
Revenue Breakdown of Samsung SDI by Product, 2017E
Revenue of Tianjin Samsung SDI, 2010-2013
Financial Data of Tianjin Samsung SDI, 2013
Revenue and Operating Margin of LG Chem, 2007-2014
Quarterly Revenue and Operating Margin of LG Chem, Q/2012-Q1/2014
Revenue and Operating Margin of Energy Solution of LG Chem, 2010-2014
CAPEX of Energy Solution of LG Chem, 2010-2014
Revenue and Gross Margin of Simplo Technology, 2000-2014
Monthly Revenue of Simplo Technology, 6/2012-6/2014
Shipments and ASP of Simplo Technology, 2004-2013
Laptop Computer Battery Market Share of Simplo Technology, 2004-2013
Financial Data of Simplo Technology’s Subsidiaries in China, 2013
Revenue and Gross Margin of Dynapack, 2005-2014
Monthly Revenue of Dynapack, 6/2012-6/2014
Revenue and Operating Margin of DESAY, 2008-2014
Assets and Liabilities of DESAY, 2009-2013
Revenue and Operating Margin of Sunwoda, 2008-2014
Assets and Liabilities of Sunwoda, 2008-2013
Revenue Breakdown of Sunwoda by Applications, 2013
Gross Profit Breakdown of Sunwoda by Applications, 2013
如果这份报告不能满足您的要求,我们还可以为您定制报告,请 留言说明您的详细需求。
|