|
|
|
报告导航:研究报告—
生命科学—制药医疗
|
|
2013-2016年中国诊断试剂行业研究报告 |
 |
字数:4.0万 |
页数:139 |
图表数:186 |
|
中文电子版:8500元 |
中文纸版:4250元 |
中文(电子+纸)版:9000元 |
|
英文电子版:2400美元 |
英文纸版:2550美元 |
英文(电子+纸)版:2700美元 |
|
编号:ZLC-006
|
发布日期:2014-07 |
附件:无 |
 |
|
|
随着老龄化加快、个人卫生支出增长、医疗设施以及政府医疗保障制度不断完善,中国诊断试剂行业发展较快,且以体外诊断试剂为主,其所占比重超过90%。2013年,中国体外诊断行业市场规模达229.8亿元,其中体外诊断试剂166.1亿元。
中国体外诊断试剂市场主要包括生化诊断试剂、免疫诊断试剂、分子诊断试剂等。其中,免疫试剂和生化试剂所占比重相对更高,2013年二者所占比重合计达65%左右。
目前,中国体外诊断市场40%-50%左右的份额被以罗氏、西门子、雅培、强生为首的国外企业占据。虽然中国体外诊断行业共有300-400家本土企业,但生产规模排名前十的企业市场占有率仅为30%左右,行业集中度较低。
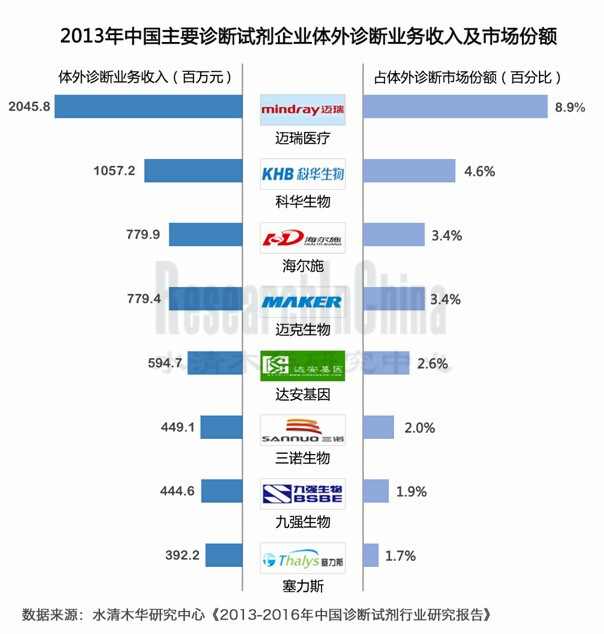
迈瑞医疗、科华生物、复星医药、迈克生物、达安基因等是中国体外诊断行业优势企业。其中迈瑞医疗、科华生物2013年体外诊断业务收入分别为20.458亿元、10.572亿元,合占中国体外诊断市场13.5%的份额。
基于对诊断试剂行业前景的看好, 2014年中国多家本土诊断试剂企业(包括九强生物、迈克生物、海尔施、万孚生物、塞力斯等)计划IPO登陆资本市场,用于已有项目的扩大生产或新项目的建设等。而新华医疗、人福医疗和中源协和等企业则通过收购也相继进入了诊断试剂行业。
《2013-2016年中国诊断试剂行业研究报告》包括以下内容:
 中国诊断试剂行业发展现状,包括总体概况、市场结构、进出口情况、竞争格局等; 中国诊断试剂行业发展现状,包括总体概况、市场结构、进出口情况、竞争格局等;
中国诊断试剂行业发展环境及发展趋势,包括宏观环境、医疗现状、相关政策等;
中国诊断试剂行业17家主要公司的经营情况、诊断试剂业务情况等。
With the accelerated aging of the Chinese population, the increase of personal health expenditure as well as the improved medical care facilities and government health care system, China diagnostic reagent industry has been developing quickly, especially in vitro diagnostic reagents occupy over 90%. In 2013, Chinese in vitro diagnostics market size reached RMB22.98 billion, of which RMB16.61 billion came from in vitro diagnostic reagents.
Chinese in vitro diagnostic reagent market consists of biochemical diagnostic reagents, immunodiagnostic reagents and molecular diagnostic reagents. Among them, the immune reagents and biochemical reagents account for a relatively higher combined proportion, such as around 65% in 2013.
Currently, about 40%-50% share of the Chinese in vitro diagnostics market has been dominated by foreign companies represented by Roche, Siemens, Abbott and Johnson & Johnson. Although there are 300-400 local enterprises in China in vitro diagnostics industry, the top ten Chinese companies which rank by production scale only seize 30% market share, reflecting a low industry concentration degree.
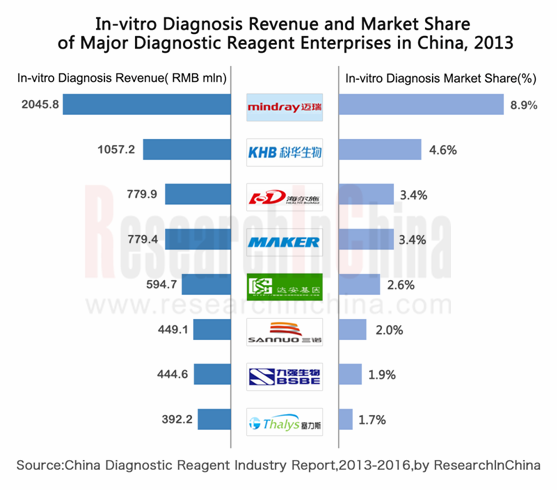
Mindray Medical, KHB, Fosun Pharmaceutical, Maker Biotechnology and Da An Gene act as giants in China in vitro diagnostics industry. Especially, Mindray Medical and KHB achieved the respective in vitro diagnostics revenue of RMB2.0458 billion and RMB1.0572 billion in 2013, accounting for 13.5% of the total jointly.
In 2014, a number of local Chinese diagnostic reagent companies (including BSBE, Maker Biotechnology, Health BioMed, Wondfo, Thalys) intend to step in the capital market through IPO because they are optimistic about the prospects of the diagnostic reagent industry; the raised funds will be used in the expansion of the existing projects or the construction of new projects. SHINVA, Humanwell Healthcare and Zhongyuan Union Stem Cell Bioengineering have entered the diagnostic reagent industry through acquisitions.
The report covers the following:
Status quo of China diagnostic reagent industry, including overview, market structure, import, export, competition pattern and so on;
Development environments and trends of China diagnostic reagent industry, embracing macroeconomy, medical situation, and relevant policies;
Operation and diagnostic reagent business of 17 major companies in China diagnostic reagent industry.
第一章 诊断试剂行业概述
1.1 定义
1.2 分类
1.3 产业链
第二章 中国诊断试剂行业发展现状
2.1 总体概况
2.2 市场结构
2.3 进出口情况
2.3.1 进口
2.3.2 出口
2.4 竞争格局
2.5 细分市场
2.5.1 生化诊断试剂
2.5.2 免疫诊断试剂
2.5.3 分子诊断试剂
2.5.4 综合性体外诊断试剂
第三章 中国诊断试剂行业发展环境及趋势
3.1 利好因素
3.1.1 宏观环境
3.1.2 医疗现状
3.1.3 相关政策
3.2 发展趋势
3.2.1 生化免疫诊断仍为主流
3.2.2 行业集中度提高
3.2.3 产品线全面、试剂仪器一体化企业得到更好发展
第四章 主要企业
4.1 科华生物
4.1.1 公司简介
4.1.2 经营情况
4.1.3 营收构成
4.1.4 毛利率
4.1.5 研发与投资
4.1.6 供销情况
4.1.7 体外诊断业务
4.1.8 预测与展望
4.2 九强生物
4.2.1 公司简介
4.2.2 经营情况
4.2.3 营收构成
4.2.4 毛利率
4.2.5 研发与投资
4.2.6 产销情况
4.2.7 供销情况
4.2.8 预测与展望
4.3 达安基因
4.3.1 公司简介
4.3.2 经营情况
4.3.3 营收构成
4.3.4 毛利率
4.3.5 研发与投资
4.3.6 诊断试剂业务
4.3.7 供销情况
4.3.8 预测与展望
4.4 复星医药
4.4.1 公司简介
4.4.2 经营情况
4.4.3 营收构成
4.4.4 毛利率
4.4.5 研发与投资
4.4.6 诊断试剂业务
4.4.7 预测与展望
4.5 利德曼
4.5.1 公司简介
4.5.2 经营情况
4.5.3 营收构成
4.5.4 毛利率
4.5.5 研发与投资
4.5.6 客户情况
4.5.7 预测与展望
4.6 丽珠集团
4.6.1 公司简介
4.6.2 经营情况
4.6.3 营收构成
4.6.4 毛利率
4.6.5 研发
4.6.6 诊断试剂业务
4.6.7 预测与展望
4.7 迈瑞医疗
4.7.1 公司简介
4.7.2 经营情况
4.7.3 营收构成
4.7.4 毛利率
4.7.5 研发与投资
4.7.6 诊断试剂业务
4.7.7 预测与展望
4.8 中生北控
4.8.1 公司简介
4.8.2 经营情况
4.8.3 营收构成
4.8.4 毛利率
4.8.5 预测与展望
4.9 迈克生物
4.9.1 公司简介
4.9.2 经营情况
4.9.3 营收构成
4.9.4 毛利率
4.9.5 研发与投资
4.9.6 供销情况
4.9.7 产销情况
4.9.8 预测与展望
4.10 三诺生物
4.10.1 公司简介
4.10.2 经营情况
4.10.3 营收构成
4.10.4 毛利率
4.10.5 预测与展望
4.11 金豪制药
4.11.1 公司简介
4.11.2 经营情况
4.11.3 营收构成
4.11.4 毛利率
4.11.5 预测与展望
4.12 博晖创新
4.12.1 公司简介
4.12.2 经营情况
4.12.3 营收构成
4.12.4 毛利率
4.12.5 研发与投资
4.12.6 预测与展望
4.13 海尔施
4.13.1 公司简介
4.13.2 经营情况
4.13.3 营收构成
4.13.4 毛利率
4.13.5 供销情况
4.13.6 研发与投资
4.13.7 预测与展望
4.14 万孚生物
4.14.1 公司简介
4.14.2 经营情况
4.14.3 营收构成
4.14.4 毛利率
4.14.5 供销情况
4.14.6 研发与投资
4.14.7 预测与展望
4.15 塞力斯
4.15.1 公司简介
4.15.2 经营情况
4.15.3 营收构成
4.15.4 毛利率
4.15.5 产销情况
4.15.6 供销情况
4.15.7 研发与投资
4.15.8 预测与展望
4.16 新华医疗
4.16.1 公司简介
4.16.2 经营情况
4.16.3 毛利率
4.16.4 诊断试剂业务
4.17 人福医药
4.17.1 公司简介
4.17.2 经营情况
4.17.3 诊断试剂业务
第五章 总结与预测
5.1 中国诊断试剂行业预测与展望
5.2 主要公司经营对比
5.2.1 营业收入
5.2.2 净利润
5.2.3 毛利率
5.2.4 体外诊断业务
1 Overview of Diagnostic Reagent Industry
1.1 Definition
1.2 Classification
1.3 Industry Chain
2 Status Quo of China Diagnostic Reagent Industry
2.1 Overview
2.2 Market Structure
2.3 Import and Export
2.3.1 Import
2.3.2 Export
2.4 Competition Pattern
2.5 Market Segments
2.5.1 Biochemical Diagnostic Reagents
2.5.2 Immunodiagnostic Reagents
2.5.3 Molecular Diagnostic Reagents
2.5.4 Comprehensive In Vitro Diagnostic Reagents
3 Development Environments and Trends of China Diagnostic Reagent Industry
3.1 Positive Factors
3.1.1 Macroeconomy
3.1.2 Medical Care
3.1.3 Policies
3.2 Trends
3.2.1 Biochemical Immunodiagnostics is still the Mainstream
3.2.2 High Industrial Concentration Degree
3.2.3 Integrated Enterprises will See Better Development
4 Major Enterprises
4.1 Shanghai Kehua Bio-engineering Co., Ltd. (KHB)
4.1.1 Profile
4.1.2 Operation
4.1.3 Revenue Structure
4.1.4 Gross Margin
4.1.5 R & D and Investment
4.1.6 Supply and Marketing
4.1.7 In Vitro Diagnostics Business
4.1.8 Anticipation and Outlook
4.2 Beijing Strong Biotechnologies, Inc (BSBE)
4.2.1 Profile
4.2.2 Operation
4.2.3 Revenue Structure
4.2.4 Gross Margin
4.2.5 R & D and Investment
4.2.6 Production and Marketing
4.2.7 Supply and Marketing
4.2.8 Anticipation and Outlook
4.3 Da An Gene
4.3.1 Profile
4.3.2 Operation
4.3.3 Revenue Structure
4.3.4 Gross Margin
4.3.5 R & D and Investment
4.3.6 Diagnostic Reagent Business
4.3.7 Supply and Marketing
4.3.8 Anticipation and Outlook
4.4 Fosun Pharmaceutical
4.4.1 Profile
4.4.2 Operation
4.4.3 Revenue Structure
4.4.4 Gross Margin
4.4.5 R & D and Investment
4.4.6 Diagnostic Reagent Business
4.4.7 Anticipation and Outlook
4.5 Beijing Leadman Biochemistry Co., Ltd.
4.5.1 Profile
4.5.2 Operation
4.5.3 Revenue Structure
4.5.4 Gross Margin
4.5.5 R & D and Investment
4.5.6 Clients
4.5.7 Anticipation and Outlook
4.6 Livzon Pharmaceutical Group Inc.
4.6.1 Profile
4.6.2 Operation
4.6.3 Revenue Structure
4.6.4 Gross Margin
4.6.5 R & D
4.6.6 Diagnostic Reagent Business
4.6.7 Anticipation and Outlook
4.7 Mindray Medical
4.7.1 Profile
4.7.2 Operation
4.7.3 Revenue Structure
4.7.4 Gross Margin
4.7.5 R & D and Investment
4.7.6 Diagnostic Reagent Business
4.7.7 Anticipation and Outlook
4.8 Biosino Bio-Technology & Science Inc.
4.8.1 Profile
4.8.2 Operation
4.8.3 Revenue Structure
4.8.4 Gross Margin
4.8.5 Anticipation and Outlook
4.9 Maker Biotechnology
4.9.1 Profile
4.9.2 Operation
4.9.3 Revenue Structure
4.9.4 Gross Margin
4.9.5 R & D and Investment
4.9.6 Supply and Marketing
4.9.7 Production and Marketing
4.9.8 Anticipation and Outlook
4.10 Sinocare
4.10.1 Profile
4.10.2 Operation
4.10.3 Revenue Structure
4.10.4 Gross Margin
4.10.5 Anticipation and Outlook
4.11 Beijing Kinghawk Pharmaceutical Co., Ltd.
4.11.1 Profile
4.11.2 Operation
4.11.3 Revenue Structure
4.11.4 Gross Margin
4.11.5 Anticipation and Outlook
4.12 Bohui Innovation
4.12.1 Profile
4.12.2 Operation
4.12.3 Revenue Structure
4.12.4 Gross Margin
4.12.5 R & D and Investment
4.12.6 Anticipation and Outlook
4.13 Health BioMed
4.13.1 Profile
4.13.2 Operation
4.13.3 Revenue Structure
4.13.4 Gross Margin
4.13.5 Supply and Marketing
4.13.6 R & D and Investment
4.13.7 Anticipation and Outlook
4.14 Wondfo
4.14.1 Profile
4.14.2 Operation
4.14.3 Revenue Structure
4.14.4 Gross Margin
4.14.5 Supply and Marketing
4.14.6 R & D and Investment
4.14.7 Anticipation and Outlook
4.15 Thalys
4.15.1 Profile
4.15.2 Operation
4.15.3 Revenue Structure
4.15.4 Gross Margin
4.15.5 Production and Marketing
4.15.6 Supply and Marketing
4.15.7 R & D and Investment
4.15.8 Anticipation and Outlook
4.16 SHINVA
4.16.1 Profile
4.16.2 Operation
4.16.3 Gross Margin
4.16.4 Diagnostic Reagent Business
4.17 Humanwell Healthcare
4.17.1 Profile
4.17.2 Operation
4.17.3 Diagnostic Reagent Business
5 Summary and Forecast
5.1 Anticipation and Outlook of China Diagnostic Reagent Industry
5.2 Operation Comparison between Major Companies
5.2.1 Revenue
5.2.2 Net Income
5.2.3 Gross Margin
5.2.4 In Vitro Diagnostics Business
表:体外诊断试剂分类(按检测原理)
表:体外诊断试剂类别及产品(按国家政策)
图:诊断试剂行业产业链
图:2009-2013年中国体外诊断行业市场规模
图:2013年中国体外诊断试剂行业市场结构
图:2008-2013年中国诊断试剂进口量
图:2008-2013年中国诊断试剂进口金额
表:2012-2013中国诊断试剂进口国家及金额
图:2008-2013年中国诊断试剂出口量
图:2008-2013年中国诊断试剂出口额
表:2012-2013年中国诊断试剂出口量前十的国家及金额
表:国内外企业诊断仪器品种对比
表:中国诊断试剂行业竞争格局
表:2013年中国主要诊断试剂企业体外诊断业务收入及市场份额
图:2004-2013年中国GDP及同比增长率
图:2006-2013年中国总人口数及同比增长率
图:2004-2013年中国65岁及以上老年人数量及所占总人口比例
图:1980-2013年中国卫生费用及所占DGP比重
图:2006-2012年中国人均卫生费用及同比增长率
表:2012-2013年中国医疗机构个数
表:2012-2013年中国卫生机构医疗服务量
表:2010-2013年中国诊断试剂行业主要政策
表:罗氏诊断发展历程
表:全球领先诊断试剂公司一体化发展战略
图:2009-2013年科华生物营业收入及净利润
图:2009-2013年科华生物营业收入(按产品)
图:2009-2013年科华生物营业收入构成(按产品)
图:2009-2013年科华生物营业收入(按地区)
图:2009-2013年科华生物营业收入构成(按地区)
图:2009-2013年科华生物毛利率
图:2009-2013年科华生物毛利率(按产品)
图:2010-2013年科华生物毛利率(按地区)
图:2011-2013年科华生物研发投入及占营业收入比例
表:科华生物参与国家重点课题项目
图:2008-2013年科华生物前五名客户销售金额及占营业收入比例
表:2012-2013年科华生物前五名客户对比
表:2012-2013年科华生物前五名供应商对比
表:2013年科华生物医疗仪器类型及产品
图:2012-2016E科华生物营业收入及净利润
图:2011-2013年九强生物营业收入及净利润
表:2011-2013年九强生物营业收入及构成(按产品)
图:2011-2013年九强生物毛利率
图:2011-2013年九强生物自产类产品毛利率
图:2011-2013年九强生物代理类产品毛利率
图:2011-2013年九强生物研发投入及占营业收入比例
表:九强生物募投项目及金额
表:2011-2013年九强生物产能、产量及销量
表:2013年九强生物销售收入前十的产品
表:2011-2013年九强生物前五大原材料供应商
表:2011-2013年九强生物前五大经销商
图:2011-2016E九强生物营业收入及净利润预测
图:2009-2013年达安基因营业收入及净利润
图:2009-2013年达安基因营业收入(按产品)
图:2009-2013年达安基因营业收入构成(按产品)
图:2009-2013年达安基因营业收入(按地区)
图:2009-2013年达安基因营业收入构成(按产品)
图:2009-2013年达安基因毛利率
图:2009-2013年达安基因毛利率(按产品)
图:2011-2013年达安基因研发投入及占营业收入比例
图:2009-2013年达安基因试剂业务收入及同比增长
图:2009-2013年达安基因仪器业务收入及同比增长率
表:达安基因旗下主要资产及业务
表:中山大学旗下医疗资源
表:2013年达安基因前五大客户
表:2012年达安基因前五大客户
表:2013年达安基因前五大供应商
表:2012年达安基因前五大供应商
图:2012-2016E达安基因营业收入及净利润预测
图:2009-2013年复星医药营业收入及净利润
图:2009-2013年复星医药营业收入(按业务)
图:2009-2013年复星医药营业收入构成(按业务)
图:2009-2013年复星医药营业收入(按地区)
图:2009-2013年复星医药营业收入构成(按地区)
图:2009-2013年复星医药毛利率
图:2009-2013年复星医药毛利率(按业务)
图:2010-2013年复星医药研发投入及占营业收入比例
图:2009-2013年复星医药医学诊断与医疗器械收入及占营业收入比例
图:2012-2016E复星医药营业收入及净利润预测
图:2009-2013年利德曼营业收入及净利润
图:2009-2013年利德曼营业收入(按产品)
图:2009-2013年利德曼营业收入构成(按产品)
图:2009-2013年利德曼毛利率
图:2009-2013年利德曼毛利率(按产品)
图:2011-2013年利德曼研发投入及占营业收入比例
表:2013年利德曼前五大客户
表:2012年利德曼前五大客户
图:2012-2016E利德曼营业收入及净利润预测
图:2009-2013年丽珠集团营业收入及净利润
图:2009-2013年丽珠集团营业收入(按产品)
图:2009-2013年丽珠集团营业收入构成(按产品)
图:2009-2013年丽珠集团营业收入(按地区)
图:2009-2013年丽珠集团营业收入构成(按地区)
图:2009-2013年丽珠集团毛利率
图:2009-2013年丽珠集团毛利率(按产品)
表:丽珠集团诊断试剂主要产品
图:2009-2013年丽珠集团诊断试剂及设备营业收入及同比增长率
图:2012-2016E丽珠集团营业收入及净利润预测
图:2009-2013年迈瑞医疗营业收入及净利润
图:2009-2013年迈瑞医疗营业收入(按产品)
图:2009-2013年迈瑞医疗营业收入构成(按产品)
图:2009-2013年迈瑞医疗毛利率
图:2009-2013年迈瑞医疗研发投入及占营业收入比例
图:2009-2013年迈瑞医疗体外诊断产品营业收入及同比增长率
图:2012-2016年迈瑞医疗营业收入及净利润预测
图:2009-2013年中生北控营业收入及净利润
图:2009-2013年中生北控营业收入(按产品)
图:2009-2013年中生北控营业收入构成(按产品)
图:2009-2013年中生北控毛利率
图:2012-2016E中生北控营业收入及净利润预测
图:迈克生物产品构成
图:2011-2013年迈克生物营业收入及净利润
表:2011-2013年迈克生物自产产品销售收入及构成
表:2011-2013年迈克生物代理品牌销售收入及构成
表:2011-2013年迈克生物销售收入及构成(按客户类别)
表:2011-2013年迈克生物直销和经销收入对比(按地区)
图:2011-2013年迈克生物毛利率
图:2011-2013年迈克生物研发投入及占营业收入比例
表:迈克生物募投项目及金额
表:2012-2013年迈克生物前十大供应商
表:2011-2013年迈克生物经销商分布
表:2011-2013迈克生物前五大客户
表:2011-2013年迈克生物产能、产量及销量
表:迈克生物自产诊断产品与代理诊断产品对比
图:2012-2016E迈克生物营业收入及净利润预测
图:2009-2013年三诺生物营业收入及净利润
图:2009-2013年三诺生物营业收入构成(按产品)
图:2009-2013年三诺生物毛利率
图:2009-2013年三诺生物毛利率(按产品)
图:2012-2016E三诺生物营业收入及净利润预测
图:2009-2013年金豪制药营业收入及净利润
图:2010-2012年金豪制药营业收入(按产品)
图:2010-2012年金豪制药营业收入构成(按产品)
图:2009-2013年金豪制药毛利率
图:2010-2012年金豪制药毛利率(按产品)
图:2012-2016E金豪制药营业收入及净利润预测
图:2009-2013年博晖创新营业收入及净利润
图:2009-2013年博晖创新营业收入(按产品)
图:2009-2013年博晖创新营业收入构成(按产品)
图:2009-2013年博晖创新毛利率
图:2009-2013年博晖创新毛利率(按产品)
图:2010-2013年博晖创新研发投入及占营业收入比例
图:2012-2016E博晖创新营业收入及净利润预测
图:2011-2013年海尔施营业收入及净利润
表:2011-2013年海尔施营业收入及构成(按产品)
表:2011-2013年海尔施营业收入及构成(按地区)
表:2011-2013年海尔施营业收入及构成(按客户)
图:2011-2013年海尔施毛利率
表:2011-2013年海尔施毛利率(按产品)
表:2011-2013年海尔施前五大供应商
表:2011-2013年海尔施前五大客户
图:2011-2013年海尔施研发投入及占营业收入比例
表:海尔施体外诊断项目、产品类别及经营方式
表:海尔施募投项目及金额
图:2011-2016E海尔施营业收入及净利润预测
表:万孚生物产品主要用途及检测方法
图:2011-2013年万孚生物营业收入及净利润
图:2011-2013年万孚生物营业收入(按产品)
图:2011-2013年万孚生物营业收入构成(按产品)
表:2011-2013年万孚生物营业收入(按地区)
图:2011-2013年万孚生物毛利率
图:2011-2013年万孚生物毛利率(按产品)
表:2011-2013年万孚生物前五大供应商
表:2011-2013年万孚生物前五大客户
图:2011-2013年万孚生物研发投入及占营业收入比例
表:万孚生物募投项目及募集资金使用计划
图:2011-2016E万孚生物营业收入及净利润预测
图:2011-2013年塞力斯营业收入及净利润
表:2011-2013年塞力斯营业收入及构成(按业务)
表:2011-2013年塞力斯营业收入及构成(按地区)
图:2011-2013年塞力斯毛利率
图:2011-2013年塞力斯毛利率(按业务)
2011-2013年塞力斯自主产品产能、产销量、产能利用率及产销率
2011-2013年塞力斯前五大客户
表:2011-2013塞力斯前五大供应商
表:2011-2013年塞力斯自主产品销售收入及研发投入
表:塞力斯募投项目及募集资金
图:2011-2016E塞力斯营业收入及净利润预测
图:2009-2013年新华医疗营业收入及净利润
图:2009-2013年新华医疗毛利率
图:2009-2013年人福医药营业收入及净利润
图:2009-2016E中国体外诊断行业市场规模预测
图:2009-2013年中国诊断试剂行业主要公司营业收入对比
图:2009-2013年中国诊断试剂行业主要公司净利润对比
图:2009-2013年中国诊断试剂行业主要公司净利润率对比
图:2009-2013年中国诊断试剂行业主要公司毛利率对比
图:中国诊断试剂行业主要公司体外诊断业务收入对比
Classification of In Vitro Diagnostic Reagents (by Detection Principle)
In Vitro Diagnostic Reagent Categories and Products (by National Policies)
Diagnostic Reagent Industry Chain
China’s In Vitro Diagnostics Market Size, 2009-2013
China’s In Vitro Diagnostic Reagent Market Structure, 2013
China’s Diagnostic Reagent Import Volume, 2008-2013
China’s Diagnostic Reagent Import Value, 2008-2013
China’s Diagnostic Reagent Import Sources and Value, 2012-2013
China’s Diagnostic Reagent Export Volume, 2008-2013
China’s Diagnostic Reagent Export Value, 2008-2013
Top 10 Destinations of Chinese Diagnostic Reagents by Export Volume and Value, 2012-2013
Diagnostic Instrument Comparison between Domestic and Foreign Enterprises
Competition Pattern of China Diagnostic Reagent Industry
In Vitro Diagnostics Revenue and Market Share of Major Diagnostic Reagent Companies in China, 2013
China’s GDP and YoY Growth Rate, 2004-2013
China’s Total Population and YoY Growth Rate, 2006-2013
Population of 65-year-old People (or Older) and % of Total Population in China, 2004-2013
China's Health Expenditure and % of GDP, 1980-2013
China's Per Capita Health Expenditure and YoY Growth Rate, 2006-2012
Number of Medical Institutions In China, 2012-2013
Workload of Health Institutions in China, 2012-2013
Main Policies of China Diagnostic Reagent Industry, 2010-2013
Development Process of Roche Diagnostics
Integrated Development Strategies of Global Leading Diagnostic Reagent Companies
KHB’s Revenue and Net Income, 2009-2013
KHB’s Revenue (by Product), 2009-2013
KHB’s Revenue Structure (by Product), 2009-2013
KHB’s Revenue (by Region), 2009-2013
KHB’s Revenue Structure (by Region), 2009-2013
KHB’s Gross Margin, 2009-2013
KHB’s Gross Margin (by Product), 2009-2013
KHB’s Gross Margin (by Region), 2010-2013
KHB’s R & D Costs and % of Total Revenue, 2011-2013
Key National Projects Involved with KHB
KHB’s Revenue from Top 5 Clients and % of Total Revenue, 2008-2013
Comparison between KHB’s Top 5 Clinets, 2012-2013
Comparison between KHB’s Top 5 Suppliers, 2012-2013
KHB’s Medical Instrument Categories and Products, 2013
KHB’s Revenue and Net Income, 2012-2016E
BSBE’s Revenue and Net Income, 2011-2013
BSBE’s Revenue and Structure (by Product), 2011-2013
BSBE’s Gross Margin, 2011-2013
Gross Margin of BSBE’s Independent Products, 2011-2013
Gross Margin of BSBE’s Agent Products, 2011-2013
BSBE’s R & D Costs and % of Total Revenue, 2011-2013
BSBE’s Investment Projects and Value
BSBE’s Capacity, Output and Sales Volume, 2011-2013
BSBE’s Top 10 Products by Sales, 2013
BSBE’s Top 5 Raw Material Suppliers, 2011-2013
BSBE’s Top 5 Distributors, 2011-2013
BSBE’s Revenue and Net Income, 2011-2016E
Revenue and Net Income of Da An Gene, 2009-2013
Revenue of Da An Gene (by Product) , 2009-2013
Revenue Structure of Da An Gene (by Product) , 2009-2013
Revenue of Da An Gene (by Region), 2009-2013
Revenue Structure of Da An Gene (by Product) , 2009-2013
Gross Margin of Da An Gene, 2009-2013
Gross Margin of Da An Gene (by Product), 2009-2013
R & D Costs and % of Total Revenue of Da An Gene, 2011-2013
Reagent Revenue and YoY Growth of Da An Gene, 2009-2013
Instrument Revenue and YoY Growth Rate of Da An Gene, 2009-2013
Principal Assets and Business of Da An Gene
Medical Resources of Sun Yat-sen University
Top 5 Clients of Da An Gene, 2013
Top 5 Clients of Da An Gene, 2012
Top 5 Suppliers of Da An Gene, 2013
Top 5 Suppliers of Da An Gene, 2012
Revenue and Net Income of Da An Gene, 2012-2016E
Revenue and Net Income of Fosun Pharmaceutical, 2009-2013
Revenue of Fosun Pharmaceutical (by Business), 2009-2013
Revenue Structure of Fosun Pharmaceutical (by Business), 2009-2013
Revenue of Fosun Pharmaceutical (by Region), 2009-2013
Revenue Structure of Fosun Pharmaceutical (by Region), 2009-2013
Gross Margin of Fosun Pharmaceutical, 2009-2013
Gross Margin of Fosun Pharmaceutical (by Business), 2009-2013
R & D Costs and % of Total Revenue of Fosun Pharmaceutical, 2010-2013
Medical Diagnosis and Medical Equipment Revenue as well as % of Total Revenue of Fosun Pharmaceutical, 2009-2013
Revenue and Net Income of Fosun Pharmaceutical, 2012-2016E
Leadman's Revenue and Net Income, 2009-2013
Leadman's Revenue (by Product), 2009-2013
Leadman's Revenue Structure (by Product), 2009-2013
Leadman's Gross Margin, 2009-2013
Leadman's Gross Margin (by Product), 2009-2013
Leadman's R & D Costs and% of Total Revenue, 2011-2013
Leadman's Top 5 Clients, 2013
Leadman's Top 5 Clients, 2012
Leadman's Revenue and Net Income, 2012-2016E
Livzon’s Revenue and Net Income, 2009-2013
Livzon’s Revenue (by Product), 2009-2013
Livzon’s Revenue Structure (by Product), 2009-2013
Livzon’s Revenue (by Region), 2009-2013
Livzon’s Revenue Structure (by Region), 2009-2013
Livzon’s Gross Margin, 2009-2013
Livzon’s Gross Margin (by Product), 2009-2013
Livzon’s Main Diagnostic Reagent Products
Revenue and YoY Growth Rate of Livzon’s Diagnostic Reagents and Equipment, 2009-2013
Livzon’s Revenue and Net Income, 2012-2016E
Revenue and Net Income of Mindray Medical, 2009-2013
Revenue of Mindray Medical (by Product), 2009-2013
Revenue Structure of Mindray Medical (by Product), 2009-2013
Gross Margin of Mindray Medical, 2009-2013
R & D Costs and % of Total Revenue of Mindray Medical, 2009-2013
In Vitro Diagnostic Product Revenue and YoY Growth Rate of Mindray Medical, 2009-2013
Revenue and Net Income of Mindray Medical, 2012-2016E
Biosino’s Revenue and Net Income, 2009-2013
Biosino’s Revenue (by Product), 2009-2013
Biosino’s Revenue Structure (by Product), 2009-2013
Biosino’s Gross Margin, 2009-2013
Biosino’s Revenue and Net Income, 2012-2016E
Product Structure of Maker Biotechnology
Revenue and Net Income of Maker Biotechnology, 2011-2013
Sales and Structure of Independent Products of Maker Biotechnology, 2011-2013
Agent Brand Sales and Structure of Maker Biotechnology, 2011-2013
Sales and Structure of Maker Biotechnology (by Client), 2011-2013
Comparison between Direct sales and Distribution Revenue of Maker Biotechnology (by Region), 2011-2013
Gross Margin of Maker Biotechnology, 2011-2013
R & D Costs and % of Total Revenue of Maker Biotechnology, 2011-2013
Investment Projects and Value of Maker Biotechnology
Top 10 Suppliers of Maker Biotechnology, 2012-2013
Dealer Distribution of Maker Biotechnology, 2011-2013
Top 5 Clients of Maker Biotechnology, 2011-2013
Capacity, Output and Sales Volume of Maker Biotechnology, 2011-2013
Comparison between Independent Diagnostic Products and Agent Diagnostic Products of Maker Biotechnology
Revenue and Net Income of Maker Biotechnology, 2012-2016E
Sinocare’s Revenue and Net Income, 2009-2013
Sinocare’s Revenue Structure (by Product), 2009-2013
Sinocare’s Gross Margin, 2009-2013
Sinocare’s Gross Margin (by Product), 2009-2013
Sinocare’s Revenue and Net Income, 2012-2016E
Revenue and Net Income of Kinghawk Pharmaceutical, 2009-2013
Revenue of Kinghawk Pharmaceutical (by Product), 2010-2012
Revenue Structure of Kinghawk Pharmaceutical (by Product), 2010-2012
Gross Margin of Kinghawk Pharmaceutical, 2009-2013
Gross Margin of Kinghawk Pharmaceutical (by Product), 2010-2012
Revenue and Net Income of Kinghawk Pharmaceutical, 2012-2016E
Revenue and Net Income of Bohui Innovation, 2009-2013
Revenue of Bohui Innovation (by Product), 2009-2013
Revenue Structure of Bohui Innovation (by Product), 2009-2013
Gross Margin of Bohui Innovation, 2009-2013
Gross Margin of Bohui Innovation (by Product), 2009-2013
R & D Costs and % of Total Revenue of Bohui Innovation, 2010-2013
Revenue and Net Income of Bohui Innovation, 2012-2016E
Revenue and Net Income of Health BioMed, 2011-2013
Revenue and Structure of Health BioMed (by Product), 2011-2013
Revenue and Structure of Health BioMed (by Region), 2011-2013
Revenue and Structure of Health BioMed (by Client), 2011-2013
Gross Margin of Health BioMed, 2011-2013
Gross Margin of Health BioMed (by Product), 2011-2013
Top 5 Suppliers of Health BioMed, 2011-2013
Top 5 Clients of Health BioMed, 2011-2013
R & D Costs and % of Total Revenue of Health BioMed, 2011-2013
In Vitro Diagnostic Items, Product Categories and Operation Modes of Health BioMed
Investment Projects and Value of Health BioMed
Revenue and Net Income of Health BioMed, 2011-2016E
Application and Detection Methods of Wondfo's Products
Wondfo’s Revenue and Net Income, 2011-2013
Wondfo’s Revenue (by Product), 2011-2013
Wondfo’s Revenue Structure (by Product), 2011-2013
Wondfo’s Revenue (by Region), 2011-2013
Wondfo’s Gross Margin, 2011-2013
Wondfo’s Gross Margin (by Product), 2011-2013
Wondfo’s Top 5 Suppliers, 2011-2013
Wondfo’s Top 5 Clients, 2011-2013
Wondfo’s R & D Costs and % of Total Revenue, 2011-2013
Wondfo’s Investment Projects and Purposes of Raised Funds
Wondfo’s Revenue and Net Income, 2011-2016E
Revenue and Net Income of Thalys, 2011-2013
Revenue and Structure of Thalys (by Business), 2011-2013
Revenue and Structure of Thalys (by Region), 2011-2013
Gross Margin of Thalys, 2011-2013
Gross Margin of Thalys (by Business), 2011-2013
Capacity, Output, Sales Volume, Capacity Utilization and Sales/Output Ratio of Thalys’ Independent Products, 2011-2013
Top 5 Clients of Thalys, 2011-2013
Top 5 Suppliers of Thalys, 2011-2013
Sales and R & D COSTS of Thalys’ Independent Products, 2011-2013
Investment Projects and Raised Funds of Thalys
Revenue and Net Income of Thalys, 2011-2016E
SHINVA’s Revenue and Net Income, 2009-2013
SHINVA’s Gross Margin, 2009-2013
Revenue and Net Income of Humanwell Healthcare, 2009-2013
Chinese In Vitro Diagnostics Market Size, 2012-2016E
Revenue Comparison between Major Companies in China Diagnostic Reagent Industry, 2009-2013
Net Income Comparison between Major Companies in China Diagnostic Reagent Industry, 2009-2013
Net Profit Margin Comparison between Major Companies in China Diagnostic Reagent Industry, 2009-2013
Gross Margin Comparison between Major Companies in China Diagnostic Reagent Industry, 2009-2013
In Vitro Diagnostics Revenue Comparison between Major Companies in China Diagnostic Reagent Industry, 2009-2013
如果这份报告不能满足您的要求,我们还可以为您定制报告,请 留言说明您的详细需求。
|