|
|
|
报告导航:研究报告—
制造业—化工
|
|
2014-2016年全球及中国非离子型纤维素醚行业研究报告 |
 |
字数:2.2万 |
页数:86 |
图表数:95 |
|
中文电子版:7500元 |
中文纸版:3750元 |
中文(电子+纸)版:8000元 |
|
英文电子版:2000美元 |
英文纸版:2150美元 |
英文(电子+纸)版:2300美元 |
|
编号:LT-021
|
发布日期:2014-08 |
附件:下载 |
 |
|
|
全球非离子型纤维素醚纤维素醚的生产比较集中,主要控制在美国、日本等发达国家公司手中,其中Dow Chemicals、Ashland、Shin-Etsu三家生产商控制大约75%的甲基纤维素MC和羟丙基甲基纤维素HPMC系列产品的市场。
2006-2013年全球非离子型纤维素醚产能稳步增长,年均增长率达到8.69%。2013年全球非离子型纤维素醚产能已达到49.1万吨。近年来全球纤维素醚产能增长主要来自于亚洲市场,尤其是中国。2013年中国非离子型纤维素醚产能达到19.5万吨,产量达到15.4万吨,其中MC/HPMC产量在13.3万吨左右。
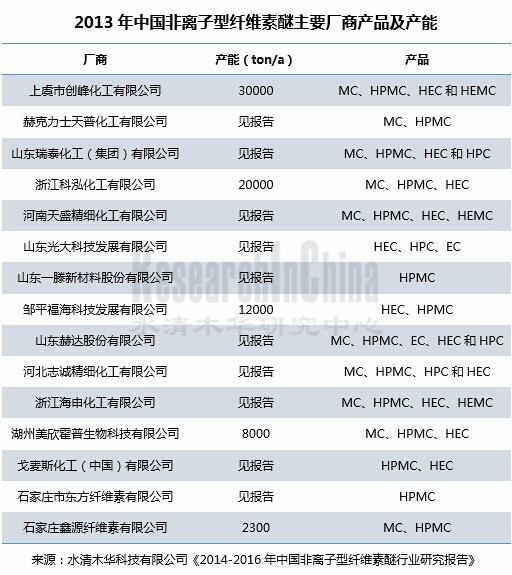
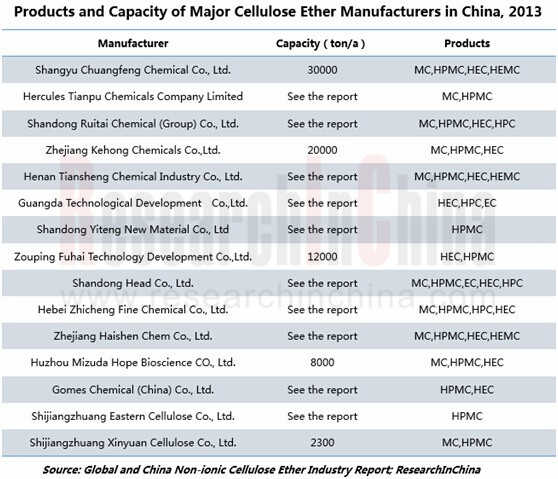
在美国、西欧和日本,纤维素醚业务通常低于再投资经济效益,新建工厂缺乏竞争力。然而,在中国投资相对要低,并且中国市场具有较好的发展前景。截止2013年底,中国非离子型纤维素醚产能超过万吨的企业共有10家,合计产能占中国非离子型纤维素醚总产能的87.4%;其中上虞创峰化工有限公司非离子型纤维素醚产能达到30000吨/年,排名第一。
从下游需求来看,建材级纤维素醚是需求量最大的产品。2013年中国非离子型纤维素醚消费量在13.2万吨左右,其中建材级纤维素醚消费量达到11.4万吨,占总体消费量的86.4%。
未来中国建筑业将在政府严厉调控政策下回归理性、健康的发展轨道,对建材级纤维素醚的需求继续保持稳定增长。预计到2016年,中国非离子型纤维素醚行业市场规模有望达到52亿元,消费量达16万吨。
水清木华研究中心《2014-2016年全球及中国非离子型纤维素醚行业研究报告》着重研究了以下内容:
 全球非离子型纤维素醚行业发展概况(包括市场规模、市场供需分析等); 全球非离子型纤维素醚行业发展概况(包括市场规模、市场供需分析等);
中国非离子型纤维素醚行业发展环境(包括原材料市场、政策环境分析等);
中国非离子型纤维素醚市场规模及未来3年预测、竞争格局(TOP15厂商产能)、供需及进出口分析等;
中国非离子型纤维素醚下游行业应用(包括建材、医药、食品添加剂行业等)市场容量分析等;
信越、亚什兰、陶氏化学等全球非离子型纤维素醚重点企业经营情况及非离子型纤维素醚业务分析等;
中国18家非离子型纤维素醚重点企业(包括创峰化工、赫克力士天普、瑞泰化工、赫达股份等)经营情况及非离子型纤维素醚业务分析等。
The global non-ionic cellulose ether production is dominated by the United States, Japan and other developed countries, especially Dow Chemical, Ashland and ShinEtsu master about 75% of methylcellulose (MC) and hydroxypropyl methyl cellulose (HPMC) market.
In 2006-2013, the global non-ionic cellulose ether capacity grew steadily at a CAGR of 8.69%, reaching 491,000 tons in 2013. In recent years, the momentum of global cellulose ether capacity growth mainly comes from the Asian market, particularly China. In 2013, China’s non-ionic cellulose ether capacity and output hit 195,000 tons and 154,000 tons respectively, of which, the MC/HPMC output approximated 133,000 tons.
In the United States, Western Europe and Japan, the profit of cellulose ether business is usually lower than economic benefits of reinvestment, and new factories are uncompetitive. However, the investment in the promising Chinese market is relatively low. As of the end of 2013, 10 Chinese non-ionic cellulose ether companies with the respective capacity of more than 10,000 tons had contributed 87.4% to the total non-ionic cellulose ether capacity in China; wherein, Shangyu Chuangfeng Chemical Co., Ltd. ranked first with 30,000 tons/a.
Judging from the downstream demand, the demand for building materials-use cellulose ether is the largest. In 2013, China’s non-ionic cellulose ether consumption amounted to 132,000 tons or so, of which building materials-use cellulose ether made 114,000 tons, accounting for 86.4% of the total consumption.
China’s construction industry will return to a rational and healthy development track under strict government control policies, still accompanied by a steady increase in the demand for building materials-use cellulose ether. It is expected that the Chinese non-ionic cellulose ether market size will attain RMB5.2 billion, and the consumption 160,000 tons in 2016.
Global and China Non-ionic Cellulose Ether Industry Report, 2014-2016 by ResearchInChina mainly sheds light on the followings:
● Overview of the global non-ionic cellulose ether industry (including market size, market supply and demand, etc.);
● Development environment for China non-ionic cellulose ether industry (involving raw material market, policies, etc.);
● Size and forecast for the next three years, competitive landscape (capacity of top 15 companies), supply and demand, import and export of China non-ionic cellulose ether market;
● Market capacity, etc. of China non-ionic cellulose ether application industries (including building materials, pharmaceuticals, food additives, etc.);
● Operation, non-ionic cellulose ether business, etc. of international benchmarking enterprises such as ShinEtsu, Ashland and Dow Chemical;
● Operation, non-ionic cellulose ether business, etc. of 18 domestic non-ionic cellulose ether enterprises e.g. Shangyu Chuangfeng Chemical, Hercules Tianpu Chemicals, Shandong Ruitai Chemical, Shandong Head.
第一章 非离子型纤维素醚简介
1.1 定义与分类
1.2 上下游产业链
第二章 中国非离子型纤维素醚行业发展环境
2.1 原材料市场
2.1.1 精制棉
2.1.2 环氧丙烷
2.1.3 烧碱
2.2 政策环境
第三章 全球非离子型纤维素醚市场分析
3.1 市场规模
3.2市场供需
3.3国际标杆企业分析
3.1.1 信越 Shinetsu
3.1.2 亚什兰 ASHLAND
3.1.3 陶氏化学 DOW Chemical
第四章 中国非离子型纤维素醚市场分析
4.1 发展概况
4.2 供应
4.3需求
4.4竞争格局
4.5进出口
4.5.1 进口
4.5.2 出口
第五章 中国非离子型纤维素醚应用行业需求分析
5.1 建材
5.2 医药
5.3 食品添加剂
第六章 中国非离子型纤维素醚行业重点企业分析
6.1 赫达股份
6.1.1 企业简介
6.1.2 经营情况
6.1.3 营收构成
6.1.4 毛利率
6.1.5 客户与供应商
6.1.6 研发
6.1.7 非离子型纤维素醚业务
6.1.8 发展前景
6.2 一滕新材料
6.2.1 企业简介
6.2.2 经营情况
6.2.3 营收构成
6.2.4 毛利率
6.2.5 客户与供应商
6.2.6纤维素醚业务
6.2.7 发展前景
6.3 瑞泰化工
6.3.1 企业简介
6.3.2 经营情况
6.3.3 营收构成
6.3.4 客户与供应商
6.3.5 非离子型纤维素醚业务
6.4 戈麦斯化工(中国)
6.4.1 企业简介
6.4.2 产能情况
6.5 天盛化学
6.5.1 企业简介
6.5.2 非离子型纤维素醚业务
6.6 光大科技
6.6.1 企业简介
6.6.2 产能情况
6.7 邹平福海
6.7.1 企业简介
6.7.2 产能情况
6.8 科泓化工
6.8.1 公司简介
6.8.2 产能情况
6.9 美欣霍普生物
6.9.1 企业简介
6.9.2 产能情况
6.10 海申化工
6.10.1 企业简介
6.10.2 非离子型纤维素醚业务
6.11 创峰化工
6.11.1 企业简介
6.11.2 非离子型纤维素醚业务
6.12 宁津德鑫
6.13 赛诺
6.14 鑫源纤维素
6.15 瑞鑫纤维素
6.16 晨旭纤维素
6.17 东方纤维素
6.18 志诚精细化工
第七章 总结与预测
7.1 总结
7.2预测
1 Introduction to Non-ionic Cellulose Ether
1.1 Definition and Classification
1.2 Upstream and Downstream Industry Chain
2 Development Environment for China Non-ionic Cellulose Ether industry
2.1 Raw Material Market
2.1.1 Refined Cotton
2.1.2 Propylene Oxide
2.1.3 Caustic Soda
2.2 Policy
3 Global Non-ionic Cellulose Ether Market
3.1 Market Size
3.2 Supply and Demand
3.3 International Benchmarking Enterprises
3.1.1 ShinEtsu
3.1.2 Ashland
3.1.3 Dow Chemical
4 China Non-ionic Cellulose Ether Market
4.1 Development
4.2 Supply
4.3 Demand
4.4 Competition Pattern
4.5 Import and Export
4.5.1 Import
4.5.2 Export
5 Demand of China Non-ionic Cellulose Ether Application Industry
5.1 Building Materials
5.2 Pharmaceuticals
5.3 Food Additives
6 Key Enterprises in China
6.1 Shandong Head
6.1.1 Profile
6.1.2 Operation
6.1.3 Revenue Structure
6.1.4 Gross Margin
6.1.5 Clients and Suppliers
6.1.6 R&D
6.1.7 Non-ionic Cellulose Ether Business
6.1.8 Prospects
6.2 Shandong Yiteng New Material
6.2.1 Profile
6.2.2 Operation
6.2.3 Revenue Structure
6.2.4 Gross Margin
6.2.5 Clients and Suppliers
6.2.6 Cellulose Ether Business
6.2.7 Prospects
6.3 Shandong Ruitai Chemical
6.3.1 Profile
6.3.2 Operation
6.3.3 Revenue Structure
6.3.4 Clients and Suppliers
6.3.5 Non-ionic Cellulose Ether Business
6.4 Gomez Chemical (China)
6.4.1 Profile
6.4.2 Capacity
6.5 Henan Tiansheng Chemical Industry
6.5.1 Profile
6.5.2 Non-ionic Cellulose Ether Business
6.6 Shandong Guangda Technology Development
6.6.1 Profile
6.6.2 Capacity
6.7 Zouping Fuhai Technology Development
6.7.1 Profile
6.7.2 Capacity
6.8 Zhejiang Kehong Chemical
6.8.1 Profile
6.8.2 Capacity
6.9 Huzhou Mizuda Hope Bioscience
6.9.1 Profile
6.9.2 Capacity
6.10 Zhejiang Haishen Chem.
6.10.1 Profile
6.10.2 Non-ionic Cellulose Ether Business
6.11 Shangyu Chuangfeng Chemical
6.11.1 Profile
6.11.2 Non-ionic Cellulose Ether Business
6.12 Shandong Ningjin Dexin Cellulose
6.13 Shandong Sainuo Cellulose
6.14 Shijiazhuang Xinyuan Cellulose
6.15 Shijiazhuang Ruixin Cellulose
6.16 Shijiazhuang Chenxun Cellulose
6.17 Shijiazhuang Eastern Cellulose
6.18 Hebei Zhicheng Fine Chemical
7 Summary and Forecast
7.1 Summary
7.2 Forecast
表:非离子型纤维素醚分类
图:2013年中国非离子型纤维素醚原材料成本构成
图:2007-2012年中国皮棉小绒精制棉产量
图:2010-2014年中国棉短绒现货均价
图:2007-2013年中国环氧丙烷产量
表:2012年中国主要环氧丙烷企业产能
图:2014年1-7月中国环氧丙烷价格走势
图:2005-2012年中国烧碱产量及增速
图:2005-2012年中国烧碱表观消费量及增速
图:2005-2012年中国烧碱自给率
图:2010-2013年中国32%离子膜烧碱低、中、高端价格
表:2008-2012年中国非离子型纤维素醚相关政策
图:2006-2013年全球非离子型纤维素醚市场规模
图:2006-2013年全球非离子型纤维素醚产能
图:2006-2013年全球非离子型纤维素醚(分产品)消费量
图:2010-2014财年信越营业收入及净利润
图:2011-2014财年信越(分产品)营收占比
图:2011-2014财年信越(分地区)营业收入
图:2010-2014财年信越研发投入及营收占比
表:信越主要非离子型纤维素醚产品产能
图:2009-2013年亚什兰营业收入及净利润
图:2013年亚什兰特种添加剂(分行业)营收占比
图:2013年亚什兰特种添加剂(分产品)营收占比
图:2013年亚什兰特种添加剂(分地区)营收占比
图:2009-2013年亚什兰研发投入及营收占比
图:2011-2013年亚什兰纤维素制品销售额
图:2009-2013年陶氏化学营业收入及净利润
图:2013年陶氏化学(分部门)营业收入
图:2009-2013年陶氏化学研发投入及营收占比
表:陶氏化学主要METHOCELTM纤维素醚产品
图:2006-2013年中国非离子型纤维素醚市场规模
图:2006-2013年中国非离子型纤维素醚产能
图:2006-2013年中国MC/HPMC产能
图:2006-2013年中国HEC及其衍生物产能
图:2006-2013年中国非离子型纤维素醚产量
图:2006-2013年中国非离子型纤维素醚(分产品)产量占比
图:2006-2013年中国非离子型纤维素醚消费量
图:2013年中国非离子型纤维素醚(分产品)需求结构
图:2013年中国非离子型纤维素醚(分行业)需求结构
表:2013年中国非离子型纤维素醚主要厂商产能
图:2011-2014年中国非离子型纤维素醚进口量及进口金额
表:2014年上半年中国非离子型纤维素醚(分国家)进口量前十名
图:2011-2014年中国非离子型纤维素醚出口量及出口金额
表:2014年上半年中国非离子型纤维素醚(分国家)出口量前二十名
图:2008-2013年中国房屋建筑施工面积及竣工面积
图:2007-2013年中国水泥及商品混凝土产量
图:2009-2016年中国建材级纤维素醚需求量
图:2008-2012年中国药用辅料行业市场规模
图:2009-2016年中国医药级纤维素醚需求量
图:2006-2011年中国食品添加剂产量
图:2011-2013年赫达股份营业收入与净利润
图:2011-2013年赫达股份纤维素醚(分类型)营业收入占比
图:2011-2013年赫达股份(分地区)营业收入占比
图:2011-2013年赫达股份纤维素醚(分类型)毛利率
图:2011-2013年赫达股份前五名供应商合计采购金额及占比
表:2013年赫达股份前五名供应商采购金额及占比
图:2011-2013年赫达股份前五名客户合计营业收入及占比
表:2013年赫达股份前五名客户营业收入及占比
图:2011-2013年赫达股份研发支出及占营业收入比例
图:2011-2013年赫达股份纤维素醚(分类型)营业收入
图:2011-2013年赫达股份建材级纤维素醚产销量及平均售价
图:2011-2013年赫达股份建材级纤维素醚(分渠道)销量
图:2011-2013年赫达股份医药食品级纤维素醚产销量及平均售价
图:2011-2013年赫达股份食品医药级纤维素醚(分渠道)销量
图:2013-2016年赫达股份营业收入及净利润
图:2011-2013年一腾新材料营业收入与净利润
图:2011-2013年一腾新材料(分产品)营收占比
图:2011-2013年一腾新材料(分地区)营收占比
图:2011-2013年一腾新材料(分产品)毛利率
图:2011-2013年一腾新材料前五名供应商合计采购金额及占比
表:2013年一腾新材料前五名供应商采购金额及占比
图:2011-2013年一腾新材料前五名客户合计营业收入及占比
表:2013年一腾新材料前五名客户营业收入及占比
图:2011-2013年一腾新材料客户(分类型)数量
图:2011-2013年一腾新材料客户数量分布
图:2011-2013年一腾新材料HPMC产销量及平均售价
图:2011-2013年一腾新材料PAC产销量及平均售价
图:2011-2013年一腾新材料HPMC新增客户销量及占比
图:2011-2013年一腾新材料PAC产品主要客户销量
图:2011-2013年一滕新材料(分地区)销量
图:2013-2016年一腾新材料营业收入与净利润
图:2007-2011年瑞泰化工营业收入与净利润
图:2007-2009年瑞泰化工(分产品)营收构成
图:2007-2009年瑞泰化工(分地区)营收构成
图:2007-2009年瑞泰化工前五名供应商合计采购金额及占比
图:2007-2009年瑞泰化工前三名客户合计营业收入及占比
图:2007-2009年瑞泰化工非离子型纤维素醚(分产品)营业收入
图:戈麦斯化工(中国)销售网络分布
图:光大科技销售网络分布
图:邹平福海营销网络
图:海申化工销售网络分布
图:赛诺销售网络分布
图:瑞鑫纤维素营销网络分布
图:2013-2016年中国非离子型纤维素醚消费量
图:2006-2016年非离子型纤维素醚市场规模
Classification of Non-ionic Cellulose Ether
China’s Non-ionic Cellulose Ether Raw Material Cost Structure, 2013
China’s Lint Refined Cotton Output, 2007-2012
China’s Cotton Linter Spot Price, 2010-2014
China’s Propylene Oxide Output, 2007-2013
Capacity of Major Propylene Oxide Enterprises in China, 2012
China’s Propylene Oxide Price, Jan-Jul 2014
China’s Caustic Soda Output and Growth Rate, 2005-2012
China’s Caustic Soda Apparent Consumption and Growth Rate, 2005-2012
China’s Caustic Soda Self-sufficiency Rate, 2005-2012
China’s 32% Ionic Membrane Caustic Soda Price, 2010-2013
China’s Non-ionic Cellulose Ether Policies, 2008-2012
Global Non-ionic Cellulose Ether Market Size, 2006-2013
Global Non-ionic Cellulose Ether Capacity, 2006-2013
Global Non-ionic Cellulose Ether Consumption (by Product), 2006-2013
ShinEtsu’s Revenue and Net Income, FY2010-FY2014
ShinEtsu’s Revenue Structure (by Product), FY2011-FY2014
ShinEtsu’s Revenue Breakdown (by Region), FY2011-FY2014
ShinEtsu’s R&D Costs and % of Total Revenue, FY2010-FY2014
Capacity of ShinEtsu’s Main Non-ionic Cellulose Ether Products, 2006-2013
Ashland’s Revenue and Net Income, 2009-2013
Ashland’s Special Additive Revenue Structure (by Industry), 2013
Ashland’s Special Additive Revenue Structure (by Product), 2013
Ashland’s Special Additive Revenue Structure (by Region), 2013
Ashland’s R&D Costs and % of Total Revenue, 2009-2013
Ashland’s Cellulose Product Sales, 2011-2013
Revenue and Net Income of Dow Chemical, 2009-2013
Revenue of Dow Chemical (by Division), 2013
R&D Costs and % of Total Revenue of Dow Chemical, 2009-2013
Main METHOCELTM Cellulose Ether Products of Dow Chemical
China's Non-ionic Cellulose Ether Market Size, 2006-2013
China's Non-ionic Cellulose Ether Capacity, 2006-2013
China's MC/HPMC Capacity, 2006-2013
China's Capacity of HEC and Its Derivatives, 2006-2013
China's Non-ionic Cellulose Ether Output, 2006-2013
China's Non-ionic Cellulose Ether Output Structure (by Product), 2006-2013
China's Non-ionic Cellulose Ether Consumption, 2006-2013
China's Non-ionic Cellulose Ether Demand Structure (by Product), 2013
China's Non-ionic Cellulose Ether Demand Structure (by Industry), 2013
Capacity of Major Non-ionic Cellulose Ether Manufacturers in China, 2013
China’s Non-ionic Cellulose Ether Import Volume and Value, 2011-2014
China’s Top 20 Import Sources of Non-ionic Cellulose Ether by Import Volume, H1 2014
China’s Non-ionic Cellulose Ether Export Volume and Value, 2011-2014
China’s Top 20 Export Destinations of Non-ionic Cellulose Ether by Export Volume, H1 2014
China’s Housing Construction Area and Completed Area, 2008-2013
China’s Output of Cement and Commercial Concrete, 2007-2013
China’s Demand for Building Materials Grade Cellulose Ether, 2009-2016E
China’s Pharmaceutical Adjuvant Market Size, 2008-2012
China’s Demand for Pharmaceutical Grade Cellulose Ether, 2009-2016E
China’s Food Additive Output, 2006-2011
Revenue and Net Income of Shandong Head, 2011-2013
Cellulose Ether Revenue Structure of Shandong Head (by Type), 2011-2013
Revenue Structure of Shandong Head (by Region), 2011-2013
Cellulose Ether Gross Margin of Shandong Head (by Type), 2011-2013
Shandong Head’s Combined Procurement from Top 5 Suppliers and % of Total Procurement, 2011-2013
Shandong Head’s Procurement from Top 5 Suppliers and % of Total Procurement, 2013
Shandong Head’s Combined Revenue from Top 5 Clients and % of Total Revenue, 2011-2013
Shandong Head’s Revenue from Top 5 Clients and % of Total Revenue, 2013
R&D Costs and % of Total Revenue of Shandong Head, 2011-2013
Cellulose Ether Revenue of Shandong Head (by Type), 2011-2013
Building Materials Grade Cellulose Ether Output, Sales Volume and ASP of Shandong Head, 2011-2013
Building Materials Grade Cellulose Ether Sales Volume of Shandong Head (by Channel), 2011-2013
Food and Pharmaceutical Grade Cellulose Ether Output, Sales Volume and ASP of Shandong Head, 2011-2013
Food and Pharmaceutical Grade Cellulose Ether Sales Volume of Shandong Head (by Channel), 2011-2013
Revenue and Net Income of Shandong Head, 2013-2016E
Revenue and Net Income of Yiteng New Material, 2011-2013
Revenue Structure of Yiteng New Material (by Product), 2011-2013
Revenue Structure of Yiteng New Material (by Region), 2011-2013
Gross Margin of Yiteng New Material (by Product), 2011-2013
Yiteng New Material’s Combined Procurement from Top 5 Suppliers and % of Total Procurement, 2011-2013
Yiteng New Material’s Procurement from Top 5 Suppliers and % of Total Procurement, 2013
Yiteng New Material’s Combined Revenue from Top 5 Clients and % of Total Revenue, 2011-2013
Yiteng New Material’s Revenue from Top 5 Clients and % of Total Revenue, 2013
Number of Clients (by Type) of Yiteng New Material, 2011-2013
Client Distribution of Yiteng New Material, 2011-2013
HPMC Output, Sales Volume and ASP of Yiteng New Material, 2011-2013
PAC Output, Sales Volume and ASP of Yiteng New Material, 2011-2013
HPMC Sales Volume (from New Clients) and % of Yiteng New Material, 2011-2013
PAC Sales Volume (from Major Clients) of Yiteng New Material, 2011-2013
Sales Volume of Yiteng New Material (by Region), 2011-2013
Revenue and Net Income of Yiteng New Material, 2013-2016E
Revenue and Net Income of Ruitai Chemical, 2007-2011
Revenue Structure of Ruitai Chemical (by Product), 2007-2009
Revenue Structure of Ruitai Chemical (by Region), 2007-2009
Ruitai Chemical’s Procurement from Top 5 Suppliers and % of Total Procurement, 2007-2009
Ruitai Chemical’s Combined Revenue from Top 3 Clients and % of Total Revenue, 2007-2009
Non-ionic Cellulose Ether Revenue of Ruitai Chemical (by Product), 2007-2009
Sales Network of Gomez Chemical (China)
Sales Network of Shandong Guangda Technology Development
Sales Network of Zouping Fuhai Technology Development
Sales Network of Zhejiang Haishen Chem.
Sales Network of Shandong Sainuo Cellulose
Sales Network Shijiazhuang Ruixin Cellulose
China’s Non-ionic Cellulose Ether Consumption, 2013-2016E
Non-ionic Cellulose Ether Market Size, 2006-2016E
如果这份报告不能满足您的要求,我们还可以为您定制报告,请 留言说明您的详细需求。
|