|
|
|
报告导航:研究报告—
制造业—工业机械
|
|
2014年全球及中国电梯行业研究报告 |
 |
字数:4.7万 |
页数:140 |
图表数:172 |
|
中文电子版:8500元 |
中文纸版:4250元 |
中文(电子+纸)版:9000元 |
|
英文电子版:2400美元 |
英文纸版:2600美元 |
英文(电子+纸)版:2700美元 |
|
编号:LMX054
|
发布日期:2014-08 |
附件:无 |
 |
|
|
中国城镇化水平的不断提高、保障性住房的建设以及大中型城市公共交通的快速发展,一定程度上延缓了商品房市场电梯销量的下滑。2013年以来,中国电梯行业继续保持快速发展,2013年产量62.5万台,同比增长18.15%,十年(2003-2013年)年复合增速22.52%。
2013-2014年,中国电梯行业主要呈现几个发展特点:
ü 本土电梯品牌市场份额进一步扩大。凭借在中低端电梯市场的稳定布局以及在资本市场的上市融资,中国本土电梯品牌企业市场份额逐年递增,从2000年的20%左右增加到2013年的45%。
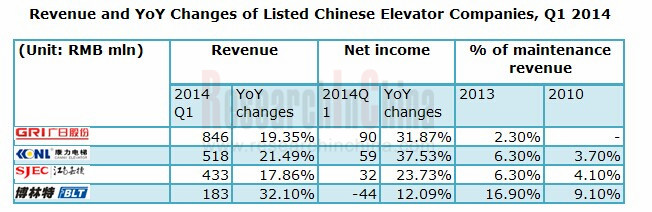
ü 得益于市场需求的稳定增长,电梯上市企业业绩保持高速增长。除了博林特以外,2013-2014年中国主要本土品牌电梯公司营业收入增速都在20%左右,净利润增速普遍高于营业收入增速。其中,广日股份业绩表现最为突出,2014年第一季度公司实现营业收入8.46亿元,同比增长19.35%;净利润9000万元,同比增长31.87%。
ü 电梯生产企业维保业务收入比例不断提高。近几年来,本土电梯企业在积极扩大产量的同时,维保业务收入也处于缓慢上升中。从国内主要本土电梯公司来看,目前沈阳博林特的维保业务收入比例最高,2013年,公司维保业务收入2.8亿元,同比增长31.4%,占公司总营业收入的16.9%(2010年为9.1%)。
表:2014年一季度中国电梯上市公司营业收入及同比变化
|
(单位:百万元) |
营业收入 |
净利润 |
维保收入占比 |
|
2014Q1 |
同比变化 |
2014Q1 |
同比变化 |
2013年 |
2010年 |
|
|
846 |
19.35% |
90 |
31.87% |
2.3% |
- |
|
|
518 |
21.49% |
59 |
37.53% |
6.3% |
3.7% |
|
|
433 |
17.86% |
32 |
23.73% |
6.3 % |
4.1% |
|
|
183 |
32.10% |
-44 |
12.09% |
16.9% |
9.1% |
来源:水清木华研究中心,《2014年全球及中国电梯行业研究报告》
ü 未来电梯行业集中度有望进一步提高。2014年1月,《特种设备安全法》(维保政策)在全国执行;2014年4月30日,《关于加强电梯制造安装改造维修许可和型式试验工作的通知》(试验塔政策)在全国推行。两大政策的落实,将提高电梯行业进入门槛,加速提升行业集中度,尤其是加速提升内资品牌集中度。
《2014年全球及中国电梯行业研究报告》主要包含几方面内容:
l 全球电梯行业发展现状、企业竞争格局以及维保市场分析;
l 中国电梯行业竞争格局,主要包括外资品牌在华布局以及内外资品牌竞争;
l 中国电梯行业供应结构、新梯产量及维保市场分析;
l 中国电梯行业需求结构,需求分析以及主要影响因素分析;
l 中国电梯进出口金额,数量以及价格分析;
l 全球7家以及中国8家主要电梯制造企业分析,包括产品产销量、经营状况、主要项目、订单情况等;
l 中国电梯行业未来发展趋势、产量及出口量预测。
The accelerating urbanization, large-scale construction of indemnificatory housing and rapid development of public transportation in large and medium-sized cities in China slow the decline of elevator sales in commercial housing market to a certain extent. Since 2013, China elevator industry has kept a rapid growth momentum, with the output numbering 625,000 sets, up 18.15% year on year, registering a CAGR of 22.52% over the past decade (2003-2013).
China elevator industry characterized the followings during 2013-2014:
Local elevator brands grabbed more market share. By virtue of stable layout in medium- to low-end markets and financing via IPOs in capital market, China's domestic elevator brands swept more and more market shares year after year, from about 20% in 2000 to 45% in 2013.
Thanks to steady growth of market demand, listed elevator companies experienced remarkable growth in performance. Except Shenyang Brilliant Elevator Co., Ltd., major local Chinese elevator companies saw approximate 20% increase in their revenue during 2013-2014, with the growth rate of net income outpacing that of revenue. Guangzhou Guangri Stock Co., Ltd. stood out from its peers, earning revenue of RMB 846 million, up 19.35% from a year earlier, and net income of RMB 90 million, a year-on-year jump of 31.87% in Q1 2014.
Elevator manufacturers earned more money from maintenance service. In recent years, local elevator companies have been actively expanding production, and the revenue from maintenance service has been climbing slowly at the same time. Among major local elevator players, Shenyang Brilliant Elevator Co., Ltd. now enjoys the highest maintenance revenue proportion. In 2013, the company earned revenue of RMB 280 million from maintenance service, rising by 31.4% year on year and accounting for 16.9% of its total revenue, compared with 9.1% in 2010.
The concentration ratio of elevator industry is likely to rise further in future. The Special Equipment Safety Law of People's Republic of China (Repair & Maintenance Policy) took effect nationwide in January 2014; the Notice on Strengthening the Work of Elevator Manufacturing, Installation, Transformation License and Type Test (policy on test tower) was introduced across the country on April 30, 2014. The implementation of the two policies will improve the thresholds for accession into the elevator industry, and speed up industry concentration, especially among domestic brands.
Global and China Elevator Industry Report, 2014 focuses on the following aspects:
 Status quo of global elevator industry development, competitive landscape of companies and maintenance market; Status quo of global elevator industry development, competitive landscape of companies and maintenance market;
Competitive landscape of China elevator industry, including business layout of foreign brands in China and competition between foreign and domestic brands;
Supply structure, new elevator output and maintenance market of China elevator industry;
Demand structure, demand and main influencing factors of China elevator industry;
Value, volume and prices of imported and exported elevators in China
Product output and sales volume, operation, main projects and orders of 7 global and 8 Chinese elevator manufacturers;
Development trend, output and export volume forecast of China elevator industry.
前言
第一章 电梯行业概述
1.1 电梯概述
1.2 政策环境
1.2.1 法律法规及政策
1.2.2 试验塔政策解读
1.2.3 维保政策解读
第二章 全球电梯行业发展状况
2.1 发展现状
2.2 企业竞争格局
2.3 维保市场
第三章 中国电梯行业竞争格局
3.1 外资品牌在华发展
3.2 市场竞争
3.2.1 内外资品牌竞争
3.2.2 外资品牌竞争
3.2.3 内资品牌竞争
3.3 企业盈利状况
第四章 中国电梯行业供应状况
4.1 供应结构
4.2 供应量
4.2.1 新梯产量
4.2.2 新建产能项目
4.3 维保市场
4.3.1 发展现状
4.3.2 市场规模
4.3.3 主要企业维保市场布局
第五章 中国电梯行业需求状况
5.1 需求结构
5.1.1 下游需求结构
5.1.2 区域需求结构
5.2 需求分析
5.3 影响因素分析
5.3.1 房地产行业
5.3.2 城市基础建设
5.3.3 旧梯更新改造
5.3.4 轨道交通建设
5.4 政府采购
第六章 中国电梯行业进出口状况
6.1 进出口量
6.1.1 载客电梯
6.1.2 自动扶梯及自动人行道
6.2 进出口金额
6.2.1 载客电梯
6.2.2 自动扶梯及自动人行道
6.3 进出口价格
6.3.1 载客电梯
6.3.2 自动扶梯及自动人行道
6.4 进出口地区
6.4.1 载客电梯
6.4.2 自动扶梯及自动人行道
第七章 全球重点企业分析
7.1 Otis
7.1.1 公司简介
7.1.2 经营状况
7.1.3 订单情况
7.1.4 在华发展
7.1.5 在华订单
7.1.6 西子奥的斯
7.2 Hitachi
7.2.1 公司简介
7.2.2 经营状况
7.2.3 Hitachi to Restructure Elevator and Escalator Business in Japan through Company Split
7.2.4 在华电梯业务
7.2.5 在华电梯订单
7.3 KONE
7.3.1 公司简介
7.3.2 经营状况
7.3.3 营收构成
7.3.4 业绩预测
7.3.5 在华发展
7.3.6 在华电梯订单
7.3.7 巨人通力(GiantKONE)
7.4 Schindler
7.4.1 公司简介
7.4.2 经营状况
7.4.3 迅达中国
7.4.4 在华订单
7.4.5 西继迅达
7.5 Thyssen Krupp
7.5.1 公司简介
7.5.2 电梯业务
7.5.3 在华发展
7.5.4 在华主要订单
7.6 Toshiba
7.6.1 公司简介
7.6.2 经营状况
7.6.3 电梯业务
7.6.4 业绩预测
7.6.5 在华电梯业务
7.7 Fujitec
7.7.1 公司简介
7.7.2 经营状况
7.7.3 在华发展
7.7.4 在华订单
7.7.5 华升富士达新研究塔竣工
第八章 中国重点企业分析
8.1 上海三菱电梯
8.1.1 公司简介
8.1.2 电梯产销量
8.1.3 经营状况
8.1.4 竞争优势
8.1.5 订单情况
8.1.6 主要项目
8.1.7 业绩预测
8.2 广日股份
8.2.1 公司简介
8.2.2 经营状况
8.2.3 营收构成
8.2.4 毛利率
8.2.5 产业链布局
8.2.6 业绩预测
8.3 康力电梯
8.3.1 公司简介
8.3.2 电梯产销量
8.3.3 经营状况
8.3.4 营收构成
8.3.5 毛利率分析
8.3.6 研发及投资
8.3.7 电梯订单
8.3.8 业绩预测
8.4 江南嘉捷
8.4.1 公司简介
8.4.2 电梯产销量
8.4.3 经营状况
8.4.4 营收构成
8.4.5 毛利率分析
8.4.6 研发及投资
8.4.7 电梯订单
8.4.8 业绩预测
8.5 博林特
8.5.1 公司简介
8.5.2 电梯产销量
8.5.3 经营状况
8.5.4 营收构成
8.5.5 毛利率分析
8.5.6 研发及投资
8.5.7 供应商分析
8.5.8 竞争优势
8.5.9 业绩预测
8.6 申龙电梯
8.6.1 公司简介
8.6.2 电梯产销量
8.6.3 经营状况
8.6.4 营收构成
8.6.5 毛利率分析
8.6.6 客户与供应商分析
8.6.7 电梯订单
8.6.8 研发与投资
8.6.9 优劣势分析
8.6.10 发展目标
8.7 东南电梯
8.7.1 公司简介
8.7.2 公司合作
8.8 杭州新马电梯
第九章 市场总结与发展预测
9.1 市场总结
9.2 发展预测
9.2.1 趋势预测
9.2.2 产量预测
9.2.3 出口量预测
Preface
1 Overview of Elevator Industry
1.1 Overview
1.2 Policy Environment
1.2.1 Laws, Regulations and Policies
1.2.2 Analysis of Policy on Testing Tower
1.2.3 Analysis of Policy on Service Market
2 Global Elevator Industry Development
2.1 Status Quo
2.2 Competition among Enterprises
2.3 Service Market
3 Competitive Landscape of China Elevator Industry
3.1 Development of Foreign Elevator Brands in China
3.2 Market Competition
3.2.1 Competition between Foreign and Domestic Brands
3.2.2 Competition among Foreign Brands
3.2.3 Competition among Domestic Brands
3.3 Enterprises’ Financial Performance
4 Supply of China Elevator Industry
4.1 Supply Structure
4.2 Supply
4.2.1 Output of New Elevators
4.2.2 New Capacity Projects
4.3 Service Market
4.3.1 Status Quo
4.3.2 Market Size
4.3.3 Enterprises’ Layout in Service Market
5 Demand of China Elevator Industry
5.1 Demand Structure
5.1.1 Downstream Demand Structure
5.1.2 Regional Demand Structure
5.2 Consumption
5.3 Influencing Factors
5.3.1 Real Estate Sector
5.3.2 Urban Infrastructure Construction
5.3.3 Transformation and Renovation of Old Elevators
5.3.4 Rail Transit Construction
5.4 Governments’ Procurement
6 Import and Export of China Elevator Industry
6.1 Import and Export Volume
6.1.1 Passenger Elevator
6.1.2 Escalator and Moving Sidewalk
6.2 Import and Export Value
6.2.1 Passenger Elevator
6.2.2 Escalator and Moving Sidewalk
6.3 Import and Export Price
6.3.1 Passenger Elevator
6.3.2 Escalator and Moving Sidewalk
6.4 Import and Export Region
6.4.1 Passenger Elevator
6.4.2 Escalator and Moving Sidewalk
7 Key Elevator Companies Worldwide
7.1 Otis
7.1.1 Profile
7.1.2 Operation
7.1.3 Orders
7.1.4 Development in China
7.1.5 Orders in China
7.1.6 Xizi Otis
7.2 Hitachi
7.2.1 Profile
7.2.2 Operation
7.2.3 Hitachi to Restructure Elevator and Escalator Business in Japan through Company Split
7.2.4 Elevator Business in China
7.2.5 Orders in China
7.3 KONE
7.3.1 Profile
7.3.2 Operation
7.3.3 Revenue Structure
7.3.4 Performance Forecast
7.3.5 Development in China
7.3.6 Orders in China
7.3.7 GiantKONE
7.4 Schindler
7.4.1 Profile
7.4.2 Operation
7.4.3 Schindler China
7.4.4 Orders in China
7.4.5 XJ Schindler
7.5 Thyssen Krupp
7.5.1 Profile
7.5.2 Elevator Business
7.5.3 Development in China
7.5.4 Orders in China
7.6 Toshiba
7.6.1 Profile
7.6.2 Operation
7.6.3 Elevator Business
7.6.4 Performance Forecast
7.6.5 Elevator Business in China
7.7 Fujitec
7.7.1 Profile
7.7.2 Operation
7.7.3 Development in China
7.7.4 Orders in China
7.7.5 Huasheng Fujitec Elevator’s New Elevator Research Tower Completes Construction
8 Key Elevator Companies in China
8.1 Shanghai Mitsubishi Elevator Co., Ltd
8.1.1 Profile
8.1.2 Output and Sales Volume
8.1.3 Operation
8.1.4 Competitive Edges
8.1.5 Orders
8.1.6 Projects
8.1.7 Performance Forecast
8.2 Guangzhou Guangri Stock Co., Ltd.
8.2.1 Profile
8.2.2 Operation
8.2.3 Revenue Structure
8.2.4 Gross Margin
8.2.5 Industrial Chain Layout
8.2.6 Performance Forecast
8.3 Canny Elevator Co., Ltd.
8.3.1 Profile
8.3.2 Output and Sales Volume
8.3.3 Operation
8.3.4 Revenue Structure
8.3.5 Gross Margin
8.3.6 R&D and Investment
8.3.7 Orders
8.3.8 Performance Forecast
8.4 SJEC Corporation
8.4.1 Profile
8.4.2 Output and Sales Volume
8.4.3 Operation
8.4.4 Revenue Structure
8.4.5 Gross Margin
8.4.6 R&D and Investment
8.4.7 Orders
8.4.8 Performance Forecast
8.5 Shenyang Brilliant Elevator Co., Ltd.
8.5.1 Profile
8.5.2 Output and Sales Volume
8.5.3 Operation
8.5.4 Revenue Structure
8.5.5 Gross Margin
8.5.6 R&D and Investment
8.5.7 Suppliers
8.5.8 Competitive Edges
8.5.9 Performance Forecast
8.6 Shenlong Elevator Co., Ltd.
8.6.1 Profile
8.6.2 Output and Sales Volume
8.6.3 Operation
8.6.4 Revenue Structure
8.6.5 Gross Margin
8.6.6 Clients and Suppliers
8.6.7 Orders
8.6.8 R&D and Investment
8.6.9 Analysis of Strengths and Weaknesses
8.6.10 Development Plan
8.7 Dongnan Elevator (DNDT)
8.7.1 Profile
8.7.2 Cooperation
8.8 Hangzhou Xinma Elevator Co., Ltd
9 Market Review and Development Forecast
9.1 Market Review
9.2 Development Forecast
9.2.1 Trend
9.2.2 Output Forecast
9.2.3 Export Forecast
表:电梯产品分类
表:2000-2014年中国电梯行业相关法律法规
表:2006-2013年中国电梯行业相关政策
表:中国市场主要电梯企业试验塔投资项目
图:2013年全球电梯在用量分布
图:2010-2013年全球电梯销售量
图:2004-2020年金砖四国与其他国家电梯新机销量及预测
图:2013年全球电梯市场份额
图:2005-2014年通力电梯维保收入占比
表:八大外资品牌电梯在中国布局情况
图:2013年中国电梯市场内外资品牌市场份额
图:2013年中国电梯市场竞争格局
图:2013年中国外资品牌市场份额构成
表:2011-2014年国外电梯企业在华布局
图:2013年中国本土电梯品牌市场份额构成
表:2013-2014年中国主要电梯上市公司营业收入及同比增速
表:2013-2014年中国主要电梯上市公司净利润入及同比增速
表:2013年中国主要电梯上市公司维保收入及维保业务毛利率
图:电梯产品结构
图:2005-2013年中国中低速电梯产品市场份额
图:1983-2013年中国电梯产量及同比增长
图:2013年主要电梯上市公司电梯产量、销量及库存量对比
表:2013-2015年中国主要电梯建设项目
图:中国电梯维保市场份额(2013年)
图:2010-2013年中国主要本土电梯品牌企业维保收入占各自营业收入的比重
图:2000-2013年中国电梯保有量
表:2013-2015年中国电梯维保市场容量预测
图:中国主要电梯品牌全国分公司数量(截止2013年底)
图:电梯下游需求结构
图:2013年中国电梯消费市场结构(分区域)
表:电梯市场区域特征对比
图:电梯需求市场组成
表:电梯需求细分市场影响因素
图:2013年全球及中国电梯需求构成
图:1997-2014年中国房地产投资额及同比增长
图:2001-2014年中国房屋新开工面积与电梯行业同比增速
图:1949-2013年中国城镇化率
图:2010-2024年中国电梯更新改造需求量
表:2013年中国已开通城市轨道交通线路运营里程统计
图:2010-2013年中国电梯项目政府采购金额
图:2012-2013年中国电梯项目政府采购金额(按月份)
图:2007-2014年中国电梯及扶梯进出口量
图:2010-2014年中国载客电梯进出口量
图:2010-2014年中国自动扶梯及自动人行道进出口量
图:2007-2014年中国电梯及扶梯进出口额
图:2010-2014年中国载客电梯进出口额
图:2010-2013年中国自动扶梯及自动人行道进出口额
表:2010-2014年中国载客电梯进出口均价
表:2010-2014年中国自动扶梯及自动人行道进出口均价
表:2014年第一季度中国载客电梯出口目的地分布
表:2014年第一季度中国载客电梯出口来源地分布
表:2013年中国载客电梯进口来源地分布
表:2014年第一季度中国自动扶梯及自动人行道出口目的地分布
表:2014年第一季度中国自动扶梯及自动人行道出口来源地分布
表:2013年中国自动扶梯和自动人行道进口来源地
图:奥的斯介绍
图:奥的斯电梯产品发展历程
图:2011-2014年奥的斯主要财务指标
表:2012-2014年奥的斯全球主要订单
表:奥的斯中国扩张过程
表:2009-2013年奥的斯在华主要电梯订单
图:西子奥的斯营销网络
表:西子奥的斯主要电梯订单
图:2009-2013财年日立集团主要财务指标
图:2009-2013财年日立集团营业收入(分业务)构成
图:2009-2013财年日立集团营业收入(分区域)构成
图:日立电梯(中国)有限公司股权结构
表:日立中国主要电梯制造基地
图:2011-2013年日立电梯(中国)有限公司营业收入与净利润
表:日立在华主要电梯订单
图:通力电梯全球业务分布
图:2013-2014年通力电梯主要财务指标
图:2014年第一季度通力电梯营业收入构成
图:2005-2013年通力电梯营业收入(分区域)构成
图:2005-2013年通力电梯营业收入(分业务)构成
图:2014年通力电梯主营业务预测
表:通力集团中国发展历程
图:通力集团在华业务分布
图:通力集团与巨人通力电梯产品结构
图:2013-2014年通力中国财务数据
图:2009-2013年迅达集团主要财务指标
图:2013-2014年迅达集团主要财务指标
图:2012-2013年迅达集团营业收入与未交付订单(分地区)构成
图:迅达在华业务分布
表:迅达中国发展历程
图:2013年迅达集团亚洲、澳洲及非洲地区营业指标
图:2013年迅达在华主要电梯订单
表:2010-2013年西继迅达主要营业指标
图:2013-2014财年蒂森主要营业指标
图:2013-2014财年蒂森主要营业指标(分业务)
图:2007-2014年蒂森电梯业务销售收入
图:2013-2014财年蒂森电梯业务主要财务数据
图:蒂森在华业务分布
表:蒂森电梯中国发展历程
图:蒂森在中国和印度运营的电梯品牌
表:蒂森在华主要电梯订单
图:2012-2013财年东芝主要营业指标
图:2012-2013财年东芝营业收入与营业利润(分业务)构成
图:2013财年东芝营业收入(分区域)构成
表:东芝电梯业务发展历程
图:2011-2013财年东芝Community Solutions业务营业收入与营业利润
图:2013-2016财年东芝业绩预测
图:东芝在华电梯业务分布
图:富士达全球业务分布
图:2009-2014财年富士达主要财务指标
图:2009-2014财年富士达东亚地区销售收入
表:富士达中国电梯生产基地
图:富士达中国主要销售网络
表:富士达电梯中标北京地铁项目情况
图:2008-2013年上海三菱电梯产量
图:1998-2012年上海三菱电梯累计销售台数
图:2009-2013年上海三菱营业收入与净利润
图:2008-2013年上海三菱电梯及自动扶梯产品毛利率
表:上海三菱电梯主要项目
表:2014-2017年上海三菱电梯营业收入与净利润预测
图:2010-2014年广日股份营业收入与净利润
表:2012-2013年广日股份置入资产营业收入与净利润
表:2013年广日股份主营业务收入(分业务)构成
表:2013年广日股份主营业务(分区域)构成
表:2013年广日股份毛利率(分业务)构成
图:广日股份产业链布局
图:广日股份中国产业园布局
表:2014-2017年广日股份营业收入与净利润预测
表:2011-2013年康力电梯电梯产品产量、销量及库存量
图:2009-2014年康力电梯营业收入与净利润
图:2010-2013年康力电梯营业收入(分产品)构成
图:2010-2013年康力电梯营业收入(分区域)构成
表:2008-2013年康力电梯毛利率(
表:2009-2013年康力电梯研发投入及占比
表:康力电梯主要电梯及电梯配件项目
表:2006-2013年康力电梯主要电梯订单
表:2014-2017年康力电梯营业收入与净利润预测
表:2008-2013年江南嘉捷电梯产品产量、销量及库存量
图:2009-2014年江南嘉捷营业收入与净利润
图:2010-2013年江南嘉捷营业收入(分产品)构成
图:2009-2013年江南嘉捷营业收入(分区域)构成
表:2008-2013年江南嘉捷毛利率
表:2008-2013年江南嘉捷研发费用及占比
表:江南嘉捷募集资金项目进展(截止2013年底)
表:江南嘉捷电梯扩产项目新增产能
表:2013-2014年江南嘉捷主要电梯订单
表:2014-2017年江南嘉捷营业收入与净利润预测
表:2009-2012年博林特产销及库存量
图:2009-2014年博林特营业收入与净利润
图:2009-2013年博林特营业收入(分产品)构成
图:2009-2013年博林特营业收入(分区域)构成
表:2009-2013年博林特毛利率(单位:%)
表:2009-2013年沈阳博林特研发投入及占营业收入的比例
表:沈阳博林特募集资金项目
表:沈阳基地电梯产业化升级改造项目实施计划
表:2013年博林特前五名供应商采购额及占比
表:2014-2017年博林特营业收入与净利润预测
表:2011-2013年申龙电梯产品产销量
表:2011-2013年申龙电梯(分产品)销量
表:2011-2013年申龙电梯产品平均销售价格
图:2011-2013年申龙电梯营业收入与净利润
表:2011-2013年申龙电梯主营业务收入(分产品)构成
表:2011-2013年申龙电梯营业收入(分区域)构成
表:2011-2013年申龙电梯毛利率
表:2013年申龙电梯前五名客户销售收入及占营业收入的比例
表:2013年申龙电梯前五名供应商采购额及占比
表:2013年申龙电梯主要电梯订单
表:2011-2013年申龙电梯研发投入及占营业收入的比例
表:申龙电梯募集资金项目
表:申龙电梯募投项目新增产能
表:东南电梯发展历程
表:东南电梯特种电梯产品应用案例
图:东南电梯中国市场营销网络
图:2014年第一季度中国本土电梯品牌上市企业营业收入与净利润同比增长
表:全球主要国家和地区人均电梯保有量
图:2013-2017年中国电梯产量及预测
图:2014-2017年中国电梯及扶梯出口量预测
Classification of Elevator Products
Laws and Regulations on China Elevator Industry, 2000-2014
Policies Concerning China Elevator Industry, 2006-2013
Elevator Testing Tower Projects in China
Global Elevators in Operation (by Region/Country), 2013
Sales Units of Elevator in the World (by Region), 2010-2013
Sales Volume of New Elevators in BRIC Countries and the Rest of World, 2004-2020E
Global Elevator Market Share, 2013
Proportion of Service Revenue to Total Revenue of KONE, 2005-2014
Layout of Eight Foreign Elevator Brands in China
Market Share of Foreign and Domestic Brands in Chinese Elevator Market, 2013
Competitive Landscape of China Elevator Market, 2013
Market Share of Foreign Brands in China, 2013
Layout of Foreign Elevator Brands in China, 2011-2014
Market Share of Domestic Brands in China, 2013
Major Listed Chinese Elevator Companies’ Revenue and Year-on-Year Growth, 2013-2014
Major Listed Chinese Elevator Companies’ Net Income and Year-on-Year Growth, 2013-2014
Major Listed Chinese Elevator Companies’ Revenue from Service Segment and Year-on-Year Growth, 2013
Elevator Product Structure
Market Share of Middle and Low Speed Elevator in China, 2005-2013E
Elevator Output and YOY Growth Rate in China, 1983-2013
Output and Sales Volume of Major Listed Chinese Elevator Companies, 2013
Major Elevator Projects under Construction in China, 2013-2015
Chinese Elevator Service Market Share, 2013
Service Revenue Percentage of Elevator Companies in China, 2010-2013
Number of Elevators in Operation in China, 2000-2013
Market Capacity of Chinese Elevator Service Industry, 2012-2015E
Number of Subsidiaries of Major Chinese Elevator Companies (as of 2013)
Elevator Application Structure
Consumption Structure in Chinese Elevator Market by Region, 2013
Regional Features of Elevator Market
Elevator Consumer Market Composition
Elevator Market Segments’ Driver
Consumption Structure in Global and Chinese Elevator Markets, 2013
Real Estate Investment and YOY Growth Rate in China, 1997-2014
Growth Rates of New Housing Construction Area and Elevator Output in China, 2001-2014
Urbanization Rates in China, 1949-2013
Elevator Renovation and Transformation Demand in China, 2010-2024E
Operation Mileage of Urban Rail Transit in China by City, 2013
Government Procurement Amount for Elevators in China, 2010-2013
Monthly Government Procurement Amount for Elevators in China, 2012-2013
Import and Export Volume of Elevator and Escalator in China, 2007-2014
Import and Export Volume of Passenger Elevator in China, 2010-2014
Import and Export Volume of Escalator and Moving Sidewalk, 2010-2014
Import and Export Value of Elevator and Escalator in China, 2007-2014
Import and Export Value of Passenger Elevator in China, 2010-2014
Import and Export Value of Escalator and Moving Sidewalk, 2010-2014
Average Import/Export Price of Passenger Elevator in China, 2010-2014
Average Import/Export Price of Escalator and Moving Sidewalk in China, 2010-2014
Export of Passenger Elevator in China (by Destinations), Q1 2014
Export of Passenger Elevator in China (by Sources), Q1 2014
Import of Passenger Elevator in China (by Sources), 2013
Export of Escalator and Moving Sidewalk in China (by Destinations), Q1 2014
Export of Escalator and Moving Sidewalk in China (by Sources), Q1 2014
Import of Escalator and Moving Sidewalk in China (by Sources), 2013
Introduction to Otis
Elevator Development History of Otis
Major Financials of Otis, 2011-2014
Major Orders of Otis Worldwide, 2012-2014
Expansion Process of Otis in China
Main Elevator Orders of Otis in China, 2009-2013
Marketing Network of Xizi Otis
Selected Financial Indices of Hitachi, FY2009-FY2013
Revenue of Hitachi (by Business), FY2009-FY2013
Revenue of Hitachi (by Region), FY2009-FY2013
Equity Structure of Hitachi Elevator (China)
Main Elevator Production Bases of Hitachi China
Revenue and Net Income of Hitachi Elevator (China), 2011-2013
Main Elevator Orders of Hitachi in China
Global Operations of KONE
Selected Financial Indices of KONE, 2013-2014
Revenue Structure of KONE, Q1 2014
Revenue Structure of KONE (by Regions), 2005-2013
Revenue Structure of KONE (by Business), 2005-2013
Operating Business Forecast of KONE, 2014E
Development History of KONE in China
Business Distribution of KONE in China
Product Structure of KONE and GiantKONE
Financials of KONE in China, 2013-2014
Selected Financial Indices of Schindler, 2009-2013
Selected Financial Indices of Schindler, 2013-2014
Revenue and Order Backlog of Schindler (by Region), 2012 -2013
Schindler’s Business in China
Development Course of Schindler in China
Business Indicators of Schindler in Asia, Oceania and Africa, 2013
Elevator Orders of Schindler in China, 2013
Main Business Indicators of XJ Schindler, 2010-2013
Main Business Indicators of Thyssen Krupp, FY2013-FY2014
Business Indicators of Thyssen Krupp (by Business), FY2013-FY2014
Elevator Sales of Thyssen Krupp, 2007-2014
Business Distribution of Thyssen Krupp in China
Development History of ThyssenKrupp Elevator (China)
Elevator Brands of Thyssen Krupp Operated in India and China
Main Elevator Orders of Thyssen Krupp in China
Main Business Indicators of Toshiba, FY 2012-FY 2013)
Revenue Structure of Toshiba (by Regions), FY2013
Elevator Development Course of Toshiba
Net Sales and Operating Income of Community Solutions of Toshiba, FY2011-FY2013
Financial Performance Forecast of Toshiba, FY2013-FY2016
Elevator Business Distribution of Toshiba in China
Global Business Distribution of Fujitec
Selected Financial Indices of Fujitec, FY2009-FY2014
Sales of Fujitec in East Asia, FY2009-FY2014
Production Bases of Fujitec Elevator (China)
Marketing Network of Fujitec in China
Fujitec’s Elevator Bidding in Beijing Subway Projects
Output of Shanghai Mitsubishi Elevator, 2008-2013
Accumulative Sales Volume of Shanghai Mitsubishi Elevator, 1998-2012
Revenue and Net Income of Shanghai Mitsubishi Elevator, 2009-2013
Gross Margin of Elevator of Shanghai Mitsubishi Elevator, 2008-2013
Major Projects of Shanghai Mitsubishi Elevator
Revenue and Net Income of Shanghai Mitsubishi Elevator, 2014E-2017E
Revenue and Net Income of Guangzhou Guangri Stock, 2010-2014
Revenue and Net Income of Trade-in Assets of Guangzhou Guangri Stock, 2012-2013
Revenue of Guangzhou Guangri Stock (by Business), 2013
Revenue of Guangzhou Guangri Stock (by Regions), 2013
Gross Margin of of Guangzhou Guangri Stock (by Business), 2013
Industrial Chain Layout of Guangzhou Guangri Stock
Industrial Parks of Guangzhou Guangri Stock in China
Revenue and Net Income of Guangzhou Guangri Stock, 2014E-2017E
Output, Sales Volume and Stock of Canny Elevator, 2011-2013
Revenue and Net Income of Canny Elevator, 2009-2014
Revenue of Canny Elevator (by Product), 2010-2013
Revenue of Canny Elevator (by Region), 2010-2013
Gross Margin of Canny Elevator, 2008-2013
R&D Costs and % of Total Revenue of Canny Elevator, 2009-2013
Main Elevator and Elevator Parts Projects of Canny Elevator, 2011-2012
Main Elevator Orders of Canny Elevator, 2006-2013
Revenue and Net Income of Canny Elevator, 2014E-2017E
Output and Sales Volume of SJEC Corporation, 2008-2013
Revenue and Net Income of SJEC Corporation, 2009-2014
Revenue of SJEC Corporation (by Business), 2010-2013
Revenue of SJEC Corporation (by Region), 2009-2013
Gross Margin of SJEC Corporation, 2008-2013
R&D Costs and % of Total Revenue of SJEC Corporation, 2008-2013
Fund-raising Projects and Investment of SJEC Corporation (as of 2013)
New Capacity of Elevator Expansion Projects of SJEC Corporation
Elevator Orders of SJEC Corporation, 2013-2014
Revenue and Net Income of SJEC Corporation, 2014E-2017E
Output, Sales and Stock of Shenyang Brilliant Elevator, 2009-2013
Revenue and Net Income of Shenyang Brilliant Elevator, 2009-2014
Revenue of Shenyang Brilliant Elevator (by Business), 2009-2013
Revenue of Shenyang Brilliant Elevator (by Region), 2009-2013
Gross Margin of Shenyang Brilliant Elevator, 2009-2013
R&D Costs and % of Total Revenue of Shenyang Brilliant Elevator, 2009-2013
Fund-Raising Projects of Shenyang Brilliant Elevator
Shenyang Brilliant Elevator’s Procurement from Top 5 Suppliers and % of Total Procurement, 2013
Revenue and Net Income of Shenyang Brilliant Elevator, 2014E-2017E
Output and Sales Volume of Shenlong Elevator, 2011-2013
Sales Volume of Shenlong Elevator (by Products), 2011-2013
Average Selling Price of Products of Shenlong Elevator, 2011-2013
Revenue and Net Income of Shenlong Elevator, 2011-2013
Revenue of Shenlong Elevator (by Business), 2011-2013
Revenue of Shenlong Elevator (by Regions), 2011-2013
Gross Margin of Shenlong Elevator (by Business), 2011-2013
Shenlong Elevator’s Revenue from Top 5 Clients and % of Total Revenue, 2013
Shenlong Elevator’s Procurement from Top 5 Suppliers and % of Total Procurement, 2013
Major Elevator Orders of Shenlong Elevator, 2013
R&D Costs and % of Total Revenue of Shenlong Elevator, 2011-2013
Fund-raising Projects of Shenlong Elevator
New Capacity of Fund-raising Projects of Shenlong Elevator
Development Course of Dongnan Elevator
Application Cases of Special Elevators of Dongnan Elevator
Marketing Network of Dongnan Elevator in China
Year-on-Year Growth Rates in Revenue and Net Income of Major Listed Companies in China Elevator Industry, Q1 2014
Per Capita Elevator in Service in the World (by Region/Country)
Output of Elevator in China, 2013-2017E
Export Volume of Elevator and Escalator in China, 2014E-2017E
如果这份报告不能满足您的要求,我们还可以为您定制报告,请 留言说明您的详细需求。
|