|
|
|
报告导航:研究报告—
TMT产业—电子半导体
|
|
2013-2014年全球及中国IC先进封装行业研究报告 |
 |
字数:2.1万 |
页数:160 |
图表数:213 |
|
中文电子版:8500元 |
中文纸版:4250元 |
中文(电子+纸)版:9000元 |
|
英文电子版:2600美元 |
英文纸版:2800美元 |
英文(电子+纸)版:2900美元 |
|
编号:ZYW186
|
发布日期:2014-08 |
附件:下载 |
 |
|
|
《2013-2014年全球及中国IC先进封装行业研究报告》包含以下内容:
1、半导体产业概况
2、内存与晶圆代工行业现状
3、半导体下游市场分析
4、新兴先进封装技术趋势
5、封装行业分析与排名
6、23家先进封装厂家研究
独立的封测厂家通常称之为OSAT,1997年全球OSAT产业规模只有大约51亿美元,占半导体产业规模的19.6%。2011年该市场规模为236亿美元,占半导体产业规模的30%。2011-2013年期间封测产业连续3年增幅低于5%。主要原因是发展自2005-2010年的先进封装技术开始普及,单价大幅度下跌,包括FC-BGA、WLCSP、QFN、SiP、PoP等。
目前手机和电脑都朝超薄、多核、高频方向发展,同时内存行业朝超宽带(Ultra Bandwidth)方向发展,这会拉动封测市场采用更新的技术来满足市场需求。自2014年起陆续有一批新技术得到应用,封测业有望获得6%以上的成长。这些技术包括MLP PoP,Cu Bol,FC-CSP,FOWLP,Embeeded Component(Trace) Substrate,2.5D等。这些技术主要应用于智能手机和超薄电脑中,市场需求旺盛。同时TSV有望在内存行业起步。再有就是IDM大厂退出封装业务,如松下和瑞萨。预计2014年OSAT行业产值增长8.4%,达到272亿美元,先进封装领域增长可达10%,达到182亿美元。
产业方面,2008年以来在FOUNDRY或IDM与OSAT之间出现了一种Middle-End企业。在FC封装时代,这些企业主要提供RDL、WAFER BUMPING、WAFER LEVEL TEST。在2.5D和3D时代,这些企业的业务范围大大增加,主要包括MICRO BUMPING、THIN&REVEAL、INTERPOSER、VIA MIDDLE、WL-CARRIER ASSEMBLY等。
2014年封装行业最大事件莫过于新加坡淡马锡出售STATS ChipPAC,STATS ChipPAC是全球第五大封装企业,由于其国有控股风格明显,企业竞争能力不强。尤其是面对来自台湾企业的竞争时,STATS ChipPAC虽然其技术一流,但过分依赖大客户Infineon、苹果、高通和Broadcom等。Infineon逐渐退出手机领域,而苹果和高通近些年分散供应链风险,减少对STATS ChipPAC下单量,导致其收入连续4年下滑。
封装行业另一重要事件则是台湾SPIL获得Qualcomm、MTK和大陆华为旗下Hisilicon的大量订单,收入有望大幅度增长,2014年上半年收入同比大幅度增长27%,营业利润率则跃居全球第一,2014年收入有望超越Amkor成为全球第二。
技术方面,3D(TSV)应用仍然不够成熟,市场仍然局限在CIS、MEMS、HB LED这些非主流领域,关键的Logic+Memory市场仍然毫无进展,未来5年内Logic+Memory恐难有进展,PoP封装还是主流。主要原因有以下几点:
1、成本问题,PoP封装稳定成熟,成本低廉。且PoP封装性能挖掘潜力还很大。
2、KGD问题,在PoP封装前其内部的Component就已经单独测试并Burn-in。而TSV需要封装后才能测试和Burn-in。一旦其中的某一个Component出现问题,那么整颗TSV都得报废。
3、TSV不可重工(Rework),PoP封装可以。
4、TSV需要多次晶圆减薄,晶圆容易弯曲或破裂,良率(Yield)不高。
5、支持PoP封装的电子系统广泛,可以使用目前标准的SMT生产线,TSV则需要做改动。
6、PoP封装良率很高。
7、PoP封装有着运作良好的商业模式,失效分析模式成熟(Failure analysis methods are mature),而TSV失效分析模式不成熟,难以界定不良产品的责任划分。
8、PoP封装是Logic+Memory,而内存是手机半导体中价格最高的IC之一,其价格波动频繁且波动大,市场集中度极高,为了保证良好的供应链管理,厂家必须随时调整内存的采购量或采购价格;而TSV意味着内存的价格与采购量都已经不可更改。对于快速变化的电子行业来说,这意味着巨额亏损或产品无法及时出货。
3D封装另一个难题是异质性热处理,Logic Die如CPU或GPU可能会产生大量热量,而与之配合的Memory则产生热量极少。若将CPU与DRAM、NAND Flash迭加在一起,CPU的高热会影响到DRAM、NAND Flash。如果采用3D封装,散热问题无法解决。比较好的解决方式是2.5D。
当然3D封装也不是没有一丝希望,在Memory领域有突破,为了进一步提高Bandwidth到15Gbps以上,目前的Stacked Wire Bonding SiP已经不能满足需求,必须采用TSV,Micron将其称为HMC,SK Hynix则为WIDE 1/O2,预计在2014年底即可量产。
目前市场最关注的是手机CPU、Application Processor和Baseband的封装,目前CPU主流封装形式为PoP,PoP封装发展方向一是降低高度,二是提高Fine Pitch,三是Embedded Passive/Active Component 。降低高度的技术如MLP,典型代表如高通的APQ8064。提高Fine Pitch的典型代表是海思Hisilicon的Kirin 920。Embedded Passive/Active Component的典型代表是苹果的A7。Baseband的封装目前主流为FC-BGA,未来发展方向可能是FC-CSP,典型代表是MTK的MT6589。
封装行业高度依赖上游的Foundry和IDM厂家,尤其是Foundry对封装厂家的业绩影响非常大。中国大陆封装行业长期技术落后,除封装厂自己的原因外,缺乏足够先进的Foundry也是重要原因。台湾封装行业之所以能够稳居全球第一,最重要的原因就是台湾拥有全球最先进的Foundry,全球80%的高端IC都产自台湾。因此,即使中国大陆的IC设计公司再强大, 也无法拉动大陆的封装行业。以Hisilicon为例,所有高端IC都由台湾TSMC代工,封装由台湾ASE和SPIL完成,测试由SPIL和KYEC完成。

Global and China IC Advanced Packaging Industry Report, 2013-2014 is mainly all about the followings
1. Overview of semiconductor industry
2. Status quo of memory and wafer foundry industry
3. Upstream market of semiconductor industry
4. Trend in emerging advanced packaging technologies
5. Analysis and ranking of packaging enterprises
6. 23 major advanced packaging vendors
Typically, an independent packaging and testing vendor is known as OSAT. In 1997, the OSAT industry scale was no more than USD5.1 billion or so, making up 19.6% of the semiconductor industry, in sharp contrast to the market size of USD23.6 billion in 2011, a figure that occupied 30% of the semiconductor industry. During 2011-2013, the packaging and testing industry saw an AAGR of less than 5% for 3 consecutive years, which mainly resulted from the fact the advanced packaging technologies developed from 2005-2010 period began to be popularized, thus leading to a dramatic decline in unit prices, these packaging technologies including FC-BGA, WLCSP, QFN, SiP, and PoP, etc.
At present, both mobile phones and computers are developing towards ultra-thin, multi-core and high frequency while memory industry is targeted at ultra bandwidth, which would prompt the packaging and testing market to satisfy the market demand with the updated technologies. Since 2014, a number of new technologies have been applied, which would bring with it a more than 6% growth in packaging and testing industry. These technologies, including MLP PoP, Cu Bol, FC-CSP, FOWLP, Embedded Component (Trace) Substrate, and 2.5D, are mainly used in smartphones and ultra-thin computers, with a robust market demand. Meanwhile, TSV is expected to be widely applied from the memory industry. On the other hand, some major IDM vendors like Panasonic and Renesas Electronics have retreated from packaging business. It is projected that in 2014 the output value of OSAT industry will grow by 8.4% to USD27.2 billion, and advanced packaging industry probably by 10% to USD18.2 billion.
In terms of industry, a type of middle-end enterprises has emerged between Foundry or IDM and OSAT since 2008. In the era of FC packaging, these enterprises mainly provide RDL, Wafer Bumping, and Wafer Level Test. But in the age of 2.5D and 3D, their scope of business has been greatly expanded, primarily including Micro Bumping, Thin & Reveal, Interposer, Via Middle, WL-Carrier Assembly, etc.
In 2014, the biggest event that happened to the packaging industry was nothing but the attempt of Temasek to sell STATS ChipPAC, the world's fifth largest packaging company. Owned by the Government of Singapore, STATS ChipPAC is less competitive, especially when facing the competition from the Taiwanese rivals. Although it has state-of-the-art technologies, yet the company depends heavily on its key accounts, including Infineon, Apple Inc., Qualcomm, and Broadcom, etc. However, Infineon has gradually withdrawn from mobile phone market while Apple Inc. and Qualcomm have diversified supply chain risks, cutting down on the orders of STATS ChipPAC, which led to a fall in revenue for four consecutive years.
In addition, a second major event was the fact that SPIL had won massive orders from Qualcomm, MTK as well as Huawei’s Hisilicon, which would considerably increase SPIL’s revenue. In H1 2014, SPIL harvested a substantial growth of 27% in revenue, making it the world’s No.1 by operating margin. In 2014, the company is expected to surpass Amkor as the global second.
In terms of technology, 3D (TSV) application is not yet so mature that the market is still confined to such non-mainstream fields as CIS, MEMS, and HB LED. The key Logic+Memory market have not made progress and will not get improvements in the coming 5 years, with PoP packaging still the mainstream. This comes mainly from the following reasons:
1. Costs. PoP packaging is stable and mature, with lower costs. Also, it demonstrates great potential of performance;
2. KGD. Before the PoP packaging, its internal components have been tested individually and burn-in while TSV requires packaging before test and burn-in. Once some problems occur to an individual component, then the entire TSV has to be discarded;
3. TSV cannot rework but PoP could;
4. TSV need to thin wafer for several times as wafer is easy to bend or break, with a low yield;
5. The electronic system that supports PoP packaging is widely applicable, the current SMT production line is feasible, but TSV needs change;
6. PoP packaging has a very high yield;
7. PoP packaging has a good business model and failure analysis methods are mature. By contrast, TSV’s failure analysis methods are not mature, which made it difficult to define the responsibility of the bad products.
8. PoP packaging is the Logic + Memory, and Memory is one of the ICs with the highest prices among the mobile phone semiconductors, with its prices showing sharp and frequent fluctuation. Moreover, it has higher market concentration. To ensure a good management of supply chain, the vendors must promptly adjust the purchase quantity or purchase price of Memory. However, as for TSV, the prices and purchase quantity cannot be changed, which, to rapidly changing electronics industry, means the huge losses or a failure of timely shipment.
Another problem of 3D packaging is heterogeneity heat treatment. Logic Die such as CPU or GPU may generate a large amount of calories while Memory, which is coordinated with Logic Die, generates a small amount of heat. If CPU is integrated with DRAM and NAND Flash, its high heat will affect DRAM and NAND Flash. And if we use 3D packaging, heat dissipation cannot be solved. The best solution is to adopt 2.5D packaging.
Of course, 3D packaging is still promising, and a breakthrough has been made in the Memory. Since the current Stacked Wire Bonding SiP has no longer satisfied the demand, the vendors, hoping to further raise the Bandwidth to 15Gbps or above, must adopt TSV. Micron calls it as HMC, and SK Hynix known as WIDE 1/O2. It is expected that by the end of 2014 TSV packaging will achieve mass production.
Currently, what has become the top concern in the market is the packaging of mobile phone CPU, Application Processor and Baseband. And the mainstream CPU packaging formats now include PoP, which would develop towards reducing the size, raising Fine Pitch and embedding Passive/Active Component. The technologies for reducing the size like MLP are represented by APQ8064 of Qualcomm; those for raising Fine Pitch by Kirin 920 of Hisilicon. And Embedded Passive/Active Component is typically represented by A7 of Apple. The mainstream baseband packaging is now FC-BGA and the future development trend may be FC-CSP, whose typical example is MT6589 of MTK.
Packaging industry is dependent heavily on the upstream Foundry and IDM vendors. This is particularly true of Foundry, which would have great impact on the performance of packaging vendors. Packaging technologies in Mainland China have long been backward, which was mainly due to a lack of advanced Foundry except indeed their own reasons. The packaging industry in Taiwan leads the world, which is mainly because Taiwan has the world’s most advanced Foundry, with 80% of high-end IC globally from the region. Therefore, no matter how strong the mainland companies are, they cannot bolster the packaging industry there. Take Hisilicon for example, its high-end IC is all produced by Taiwan's TSMC, packaged by ASE and SPIL, and tested by SPIL and KYEC.
第一章、全球半导体产业
1.1、全球半导体产业概况
1.2、半导体产业供应链
1.3、半导体封装简介
第二章、IC封装行业上下游分析
2.1、半导体产业地域格局
2.2、半导体产业支出趋势
2.3、DRAM内存产业
2.3.1、DRAM内存产业现状
2.3.2、DRAM内存厂家市场占有率
2.3.3、移动DRAM内存厂家市场占有率
2.4、NAND闪存
2.5、晶圆代工产业
2.6、晶圆代工行业竞争分析
2.7、晶圆代工产业排名
2.8、手机市场
2.9、PC市场
2.10、平板电脑市场
2.11、FPGA与CPLD市场
第三章、封测技术趋势
3.1、WIDE IO/HMC MEMORY
3.2、EMBEDDED COMPONENT SUBSTRATE
3.3、EMBEDDED TRACE SUBSTRATE
3.4、手持设备IC封装 IC PACKAGING FOR HANDSET
3.4.1、手持设备IC封装现状
3.4.2、PoP封装
3.4.3、FOWLP
3.5、SIP封装
3.5.1、Murata
3.5.2、环隆电气USI
3.6、2.5D封装(SI/GLASS/ORGANIC INTERPOSER)
3.6.1、2.5D封装简介
3.6.2、2.5D封装应用
3.6.3、2.5D Interposer市场规模
3.6.4、2.5D 封装供应商
3.7、TSV(3D)封装
3.7.1、TSV封装设备
第四章、封测产业分析
4.1、封测产业规模
4.2、MIDDLE-END中段封测产业
4.3、OSAT产业地域分析
4.4、半导体测试
4.5、全球封测厂家排名
第五章、封测厂家研究
5.1、日月光
5.2、安靠
5.3、矽品精密
5.4、星科金朋
5.5、力成
5.6、超丰
5.7、南茂科技
5.8、京元电子
5.9、UNISEM
5.10、福懋科技
5.11、江苏长电科技
5.12、UTAC
5.13、菱生精密
5.14、南通富士通微电子
5.15、华东科技
5.16、颀邦科技
5.17、J-DEVICES
5.18、MPI
5.19、STS SEMICONDUCTOR
5.20、SIGNETICS
5.21、HANA MICRON
5.22、NEPES
5.23、天水华天科技
1. Global Semiconductor Industry
1.1 Overview
1.2 Supply Chain
1.3 Semiconductor Packaging Introduction
2. Upstream & Downstream of IC Packaging Industry
2.1 Semiconductor Industry by Location
2.2 Semiconductor Industry Capital Spending Trend
2.3 DRAM Industry
2.3.1 Status Quo
2.3.2 Market Share of DRAM Vendors
2.3.3 Market Share of Mobile DRAM Vendors
2.4 NAND Flash
2.5 Wafer Foundry Industry
2.6 Wafer Foundry Competition
2.7 Wafer Foundry Industry Ranking
2.8 Mobile Phone Market
2.9 PC Market
2.10 Tablet PC Market
2.11 FPGA and CPLD Market
3. Packaging & Testing Technology Trend
3.1 Wide IO/HMC Memory
3.2 Embedded Component Substrate
3.3 Embedded Trace Substrate
3.4. IC Packaging for Handset
3.4.1 Status Quo
3.4.2 PoP Packaging
3.4.3 FOWLP
3.5 SIP Packaging
3.5.1 Murata
3.5.2 USI(Taiwan)
3.6 2.5D Packaging (SI/GLASS/ORGANIC INTERPOSER)
3.6.1 Introduction
3.6.2 Application
3.6.3 2.5D Interposer Market Size
3.6.4 Suppliers
3.7 TSV (3D) Packaging
3.7.1 Equipment
4. Packaging & Testing Industry
4.1 Market Size
4.2 Middle-end Packaging &Testing Industry
4.3 OSAT Industry by Region
4.4 Semiconductor Testing
4.5 Global Vendor Ranking
5. Packaging & Testing Vendors
5.1 ASE
5.2 Amkor
5.3 SPIL
5.4 STATS ChipPAC
5.5 PTI
5.6 Greatek
5.7 ChipMOS
5.8 KYEC
5.9 Unisem
5.10 FATC
5.11 JECT
5.12 UTAC
5.13 Lingsen Precision
5.14 Nantong Fujitsu Microelectronics
5.15 Walton Advanced Engineering
5.16 Chipbond
5.17 J-DEVICES
5.18 MPI
5.19 STS Semiconductor
5.20 Signetics
5.21 Hana Micron
5.22 Nepes
5.23 Tian Shui Hua Tian Technology
2011-2014年全球3G/4G手机出货量地域分布
日月光组织结构
2001-2014年日月光收入与毛利率
2005-2014年Amkor收入与毛利率、运营利润率
2003-2014年矽品收入、毛利率、运营利润率
2004-2014年星科金朋收入与毛利率
2006-2013年星科金朋收入封装类型分布
2006-2013年星科金朋收入下游应用分布
2006-2013年星科金朋收入 地域分布
1990-2014 Semiconductor Industry Growth versus Worldwide GDP Growth
2012-2014年全球半导体产业季度收入
2012-2017年全球半导体市场产品分布
2012-2017年各种半导体产品市场规模增幅
Semiconductor Outsourced Supply Chain
Semiconductor Company Systems
Semiconductor Outsourced Supply Chain Example
1Q14 Top25 Semiconductor Sales Leaders
1990-2013 Worldwide IC Sales by Company Headquarters Location
2013 Fabless IC Sales Marketshare by Company Headquarters Location(77.9B)
2008-2013 Top 10 IC Manufacturers in China
2011-2014F Top 10 Spenders Capital Spending Outlook
1994-2013 Top 5 Share of Total Semiconductor Capital Spending
1Q14-WW-Semiconductor-CapitalSpending-Share-of-FullZYear-Budget
2008-2016年全球DRAM与NAND市场规模
1Q/12-4Q/14 DRAM supply/demand
2005-2015年DRAM产业CAPEX
2012-2014 DDR3 4Gb ASP
2012-2014 NAND MLC 32Gb ASP
2Q13-1Q14 Revenue Ranking for Branded DRAM Vendor
Q1/07-Q1/14 DRAM Market Share
2009-2011年Mobile DRAM 市场份额
2012年Mobile DRAM 市场份额
2Q13-1Q14 Revenue Ranking for Branded Mobile DRAM Vendor
2012 年 品牌(Brandbed)NAND Flash厂家市场份额
2014年1季度品牌(Brandbed)NAND Flash厂家市场份额
1Q12-4Q14 NAND Supply/Demand
NAND tech migration roadmap
2008-2017年全球Foundry市场规模
2012-2017 Foundry Revenue of Advanced Nodes
2012-2018 Global Foundry capacity by node
2012-2018 Global Foundry revenue by node
Global ranking by foundry
2008-2016年平均每部手机IC成本
2007-2015年全球手机出货量
Worldwide Smartphone Sales to End Users by Vendor in 2013 (Thousands of Units)
Worldwide Smartphone Sales to End Users by Operating System in 2013 (Thousands of Units)
Worldwide Mobile Phone Sales to End Users by Vendor in 2013 (Thousands of Units)
2008-2015年全球PC用CPU与Discrete GPU 出货量
2008-2015年笔记本电脑出货量
2010-2013年全球主要笔记本电脑ODM厂家出货量
2011-2016年全球平板电脑出货量
2013年平板电脑主要品牌市场占有率
2012、2013年全球平板电脑制造厂家产量
2011年FPGA、CPLD市场下游分布与地域分布
1999-2013年主要FPGA厂家市场占有率
Mobile DRAM Trend
WIDE IO的优点
SK Hynix WIDE IO2 Roadmap
HMC Architecture
HMC BENEFITS
内嵌被动与主动元件主板的优点
Embedded Component Substrate Process
Comparison of Embedded Active & Passive Components
Roadmap of Embedded Passive Substrate
Structure Roadmap of Embedded Active Substrate
FOWLP and PLP Process Comparison
WHY EMBEDDED TRACE?
EMBEDDED TRACE Package Features
EMBEDDED TRACE Package Sweet Spot (for Wire Bonding)
EMBEDDED TRACE Package Sweet Spot (for FLIP CHIP)
Apple iPad 4 LTE A1459 IC Package Type List
PoP封装发展趋势
2014年SiP封装主要厂家市场占有率
FY2009-FY2014 Murata Sales and Operation Margin
FY2009-FY2014 Murata Sales by region
2011年1季度-2014年2季度Murata收入、新订单与Backlog
2011年1季度-2014年2季度Murata运营利润、净利润
2011年1季度-2014年2季度Murata Order by Product
FY2010-FY2014 Murata Sales by Product
FY2010-FY2014 Murata Sales by Application
2008-2014年环隆电气收入与毛利率
2013年1季度-2014年2季度环隆电气季度收入与毛利率
2013年1季度-2014年2季度环隆电气季度收入产品分布
2008-2014年环旭电子收入与营业利润率
2011-2013年环旭电子收入下有分布
2011-2013年环旭电子各项产品产量
2.5D Interposer Manffacturing Revenue
2010-2017 Breakdown by interposer bulk material
TSV下游应用
TSV设备供应商
2012-2017年TSV封装设备分布
2006-2015年OSAT市场规模
1990-2020 Share of IC Package Value Add
2011\2016 全球IC封装类型出货量分布
Middle-End中段封测产业 Process
2012年全球OSAT产值地域分布
2014年全球OSAT产值地域分布
2007-2014年台湾封测产业收入
2011-2013年韩国前7大封测企业收入排名
2013年FIQFN厂家排名
2013年FOWLP厂家排名
2013年Stacked Package厂家排名
2008-2012年全球前24大封测厂家收入与营业利润率
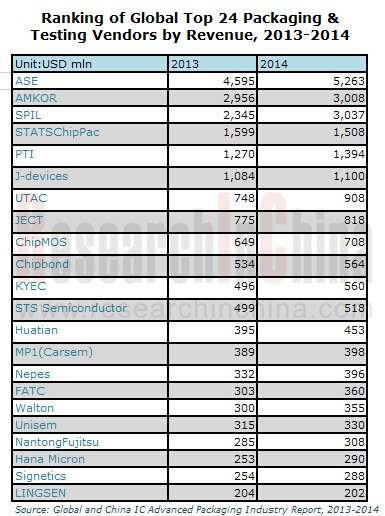
2013-2014全球封测前24大企业收入排名
2013-2014年全球主要OSAT厂家营业利润率与毛利率对比
2009-2014年日月光收入与营业利润率
2012年5月-2014年6月日月光月度收入
2010-2014年ASE收入业务分布
2013年1季度-2014年2季度ASE封装部门收入与毛利率
2013年1季度-2014年2季度ASE封装部门收入类型分布
2013年1季度-2014年2季度ASE测试部门收入与毛利率
2013年1季度-2014年2季度ASE材料部门收入与毛利率
2013年1季度-2014年2季度ASE EMS收入与毛利率
2013年1季度-2014年2季度ASE EMS收入breakdown
ASE Q1/2013-Q2/2014 Machinery & Equipment Capital Expenditure vs. EBITDA
2014年1季度ASE收入下游应用
ASE主要客户
2007-2014年Amkor收入封装类型分布
2012-2014 Amkor出货量封装类型分布
2012-2014年Amkor收入下游分布
2011-2014 Amkor Capital Intensity
2011-2014 Amkor Debt and Cash
Property, Plant and Equipment By Region 2012\2013
2012年安靠收入与出货量地域分布
2011-2013 Amkor net sales by country based on customer location
2012年安靠收入与出货量地域分布
矽品精密工业组织结构
2012年5月-2014年6月SPIL月度收入
2012年1季度-2014年2季度SPIL季度收入、毛利率与营业利润率
2005-2014年矽品收入地域分布
2005-2014年矽品收入下游应用分布
2005-2014年矽品收入业务分布
矽品2006-2014年产能统计
2006-2014年力成科技收入与运营利润率
2009-2014年力成科技收入与毛利率
2012年6月-2014年6月力成科技月度收入与增幅
力成科技工厂一览
力成科技的TSV解决方案
2011-2014年力成科技收入业务分布
2011-2014年力成科技收入产品分布
2005-2014年超丰电子收入、毛利率、运营利润率
2007-2010年超丰电子收入技术类型分布
2012年6月-2014年6月超丰电子月度收入与增幅
2003-2014年南茂科技收入与毛利率
2009-2014年南茂收入与营业利润率
2010-2014年南茂科技收入业务分布
2010-2014年南茂科技收入产品分布
2010-2014年南茂科技Utilization Rate 和EBITDA Margin
2009-2013年南茂科技Cash Flow 和CAPEX
2014-2016 ChipMOS Technology Roadmap
ChipMOS Technology Development & Business Alignment
2010-2013 ChipMOS LCD Driver Capacity
2006-2013年南茂科技收入地域分布
2013年ChipMOS客户分布
Category Distribution of Active Patents of ChipMOS
2003-2014年京元电子收入与毛利率
2009-2014年京元电子收入与营业利润率
2012年6月-2014年6月京元电子月度收入
京元电子厂房分布
京元电子TESTING PLATFORMS
2006-2014年Unisem收入与EBITDA
2011年1季度-2014年1季度 Unisem收入与EBITDA
Q2/12-Q1/14 Unisem收入产品分布
Q2/12-Q1/14 Unisem收入下游分布
台塑集团组织结构
福懋科技组织结构
2006-2014年福懋科技收入与运营利润率
2009-2014年福懋科技收入与毛利率
2012年6月-2014年6月福懋科技月度收入
2006-2014年JECT收入与运营利润率
2011-2013年JECT产量、销量
2012-2013年JECT成本结构
2013-2014年JECT收入产品分布
2012年全球CU Pilluar产能分布
2009-2013年JECT资产负债
JCET路线图
2011年JCET收入地域分布
2010-2014年UTAC收入与毛利率
2010-2013年UTAC收入业务分布
2010-2013年UTAC收入地域分布
2010-2013年UTAC收入产品分布
2011-2013年UTAC收入客户分布
2007-2014年菱生精密收入与运营利润率
2009-2014年菱生精密收入与毛利率
2012年6月-2014年6月菱生精密月度收入
2007-2014年南通富士通微电子收入与营业利润
2007-2014年华东科技收入与运营利润率
2009-2014年华东科技收入与毛利率
2012年6月-2014年6月华东科技月度收入与增幅
2006-2014年颀邦科技收入与运营利润率
2009-2014年颀邦科技收入与毛利率
2012年6月-2014年6月颀邦科技月度收入与增幅
2012年颀邦科技收入业务分布
2012-2013年颀邦科技收入市场分布
2013全球Gold Bumping Vendor Capacity Share
J-Devices 组织结构
2007-2014财年MPI收入与税前利润
FY2009-FY2013 MPI EQUITY与ASSETS
FY2011-FY2013 MPI收入地域分布
Carsem 2011年1季度-2012年1季度收入产品分布
STS Semiconductor组织结构
2006-2014年STS Semiconductor收入与运营利润率
2011-2013年STS Semiconductor收入业务分布
2011-2013年STS Semiconductor产能
2011-2013年STS Semiconductor产量
Signetics股东结构
2007-2014年Signetics收入与运营利润率
2006-2014年Hana Micron收入与运营利润率
2013年Hana Micron收入客户分布
2013年1季度-2014年4季度Hana Micron收入市场分布
2007-2014年Nepes收入与运营利润率
2013-2014年Nepes季度收入部门分布
2006-2014年天水华天收入与运营利润率
Global 3G/4G Mobile Phone Shipments, 2011-2014
Semiconductor Industry Growth versus Worldwide GDP Growth, 1990-2014
Quarterly Revenue of Global Semiconductor Industry, 2012-2014
Global Semiconductor Market Structure by Product, 2012-2017E
Market Size Growth of Global Semiconductor Market by Product, 2012-2017E
Semiconductor Outsourced Supply Chain
Semiconductor Company Systems
Semiconductor Outsourced Supply Chain Example
Top25 Semiconductor Sales Leaders, 1Q2014
Worldwide IC Sales by Company Headquarters Location, 1990-2013
Fabless IC Sales Market Share by Company Headquarters Location, 2013
Top 10 IC Manufacturers in China, 2008-2013
Top 10 Spenders Capital Spending Outlook, 2011-2014E
Top 5 Share of Total Semiconductor Capital Spending, 1994-2013
Global DRAM and NAND Market Size, 2008-2016E
DRAM Supply/Demand, 1Q2012-4Q2014
DRAM CAPEX, 2005-2015E
ASP of DDR3 4Gb, 2012-2014
ASP of NAND MLC 32Gb, 2012-2014
Revenue Ranking for Branded DRAM Vendor, 2Q2013-1Q2014
DRAM Market Share, Q12007-Q12014
Mobile DRAM Market Share, 2009-2011
Mobile DRAM Market Share, 2012
Revenue Ranking for Branded Mobile DRAM Vendors, 2Q2013-1Q2014
Market Share of Branded NAND Flash Vendors, 2012
Market Share of Branded NAND Flash Vendors, 1Q 2014
NAND Supply/Demand, 1Q2012-4Q2014
NAND Tech Migration Roadmap
Global Foundry Market Size, 2008-2017E
Foundry Revenue of Advanced Nodes, 2012-2017E
Global Foundry Capacity by Node, 2012-2018E
Global Foundry Revenue by Node, 2012-2018E
Global Ranking by Foundry
Average IC Cost of Mobile Phone, 2008-2016E
Global Mobile Phone Shipments, 2007-2015E
Worldwide Smartphone Sales to End Users by Vendor, 2013 (Thousands of Units)
Worldwide Smartphone Sales to End Users by Operating System, 2013 (Thousands of Units)
Worldwide Mobile Phone Sales to End Users by Vendor, 2013 (Thousands of Units)
Global PC-used CPU and Discrete GPU Shipments, 2008-2015E
Global Notebook Computer Shipments, 2008-2015E
Global Major Notebook Computer ODM Shipments, 2010-2013
Global Tablet PC Shipments, 2011-2016E
Market Share of Major Tablet PC Brands, 2013
Output of Global Tablet PC Vendors, 2012-2013
FPGA and CPLD Market Distribution by Application and Region, 2011
Market Share of Major FPGA Vendors, 1999-2013
Mobile DRAM Trend
Advantages of WIDE IO
SK Hynix WIDE IO2 Roadmap
HMC Architecture
HMC Benefits
Advantages of Embedded Passive/Active Substrate
Embedded Component Substrate Process
Comparison of Embedded Active & Passive Components
Roadmap of Embedded Passive Substrate
Structure Roadmap of Embedded Active Substrate
FOWLP and PLP Process Comparison
WHY Embedded Trace?
Embedded Trace Package Features
Embedded Trace Package Sweet Spot (for Wire Bonding)
Embedded Trace Package Sweet Spot (for FLIP CHIP)
Apple iPad 4 LTE A1459 IC Package Type List
PoP Package Development Trend
Market Share of Major SiP Packaging Vendors, 2014
Murata Sales and Operation Margin, FY2009-FY2014
Murata Sales by Region, FY2009-FY2014
Sales, New Orders and Backlog of Murata, 1Q2011-2Q2014
Operating Income and Net Income of Murata, 1Q2011-2Q2014
Murata Order by Product, 1Q2011-2Q2014
Murata Sales by Product, FY2010-FY2014
Murata Sales by Application, FY2010-FY2014
Revenue and Gross Margin of USI (Taiwan), 2008-2014
Quarterly Revenue and Gross Margin of USI (Taiwan), 1Q2013-2Q2014
Quarterly Revenue of USI (Taiwan) by Product, 1Q2013-2Q2014
Revenue and Operating Margin of USI, 2008-2014
Revenue of USI by Application, 2011-2013
Output of USI by Product, 2011-2013
2.5D Interposer Manufacturing Revenue
Breakdown by Interposer Bulk Material, 2010-2017E
TSV Application
TSV Equipment Suppliers
TSV Packaging Equipment Distribution, 2012-2017E
OSAT Market Size, 2006-2015E
Share of IC Package Added Value, 1990-2020E
Global IC Packaging Shipment by Type, 2011\2016
Middle-End Packaging & Testing Process
Global OSAT Output Value by Region, 2012
Global OSAT Output Value by Region, 2014
Taiwan Packaging & Testing Industry Revenue, 2007-2014
Top 7 Packaging & Testing Vendors in S.Korea by Revenue, 2011-2013
FIQFN Vendors Ranking, 2013
FOWLP Vendors Ranking, 2013
Stacked Package Vendors Ranking, 2013
Revenue and Operating Margin of Global Top 24 Packaging & Testing Vendors, 2008-2012
Global Top24 OSAT Company Ranking by Revenue, 2013-2014
Comparison of Operating Margin and Gross Margin between Global Major OSAT Vendors, 2013-2014
Organizational Structure of ASE
Revenue and Gross Margin of ASE, 2001-2014
Revenue and Operating Margin of ASE, 2009-2014
Monthly Revenue of ASE, May 2012-June 2014
Revenue and Gross Margin of ASE Packaging, Q1 2013-Q2 2014
Revenue of ASE Packaging by Type, Q1 2013-Q2 2014
Revenue and Gross Margin of ASE Tests, Q1 2013-Q2 2014
Revenue and Gross Margin of ASE Material, Q1 2013-Q2 2014
Revenue and Gross Margin of ASE EMS, Q1 2013-Q2 2014
Revenue Breakdown of ASE EMS, Q1 2013-Q2 2014
Machinery & Equipment Capital Expenditure vs. EBITDA of ASE, Q1 2013-Q2 2014
Revenue of ASE by Application, Q1 2014
Major Clients of ASE
Revenue of Amkor by Package Type, 2007-2014
Shipments of Amkor by Package Type, 2012-2014
Revenue of Amkor by Application, 2012-2014
Revenue, Gross Margin and Operating Margin of Amkor, 2005-2014
Capital Intensity of Amkor, 2011-2014
Debt and Cash of Amkor, 2011-2014
Property, Plant and Equipment by Region of Amkor, 2012-2013
Revenue and Shipments of Amkor by Region, 2011-2013
Net Sales of Amkor by Country Based on Customer Location, 2011-2014
Organizational Structure of SPIL
Monthly Revenue of SPIL, May 2012-June 2014
Quarterly Revenue, Gross Margin and Operating Margin of SPIL, 1Q2012-2Q2014
Revenue of SPIL by Region, 2005- 2014
Revenue of SPIL by Application, 2005- 2014
Revenue of SPIL by Business, 2005-2014
Capacity of SPIL, 2006-2014
Revenue, Gross Margin and Operating Margin of SPIL, 2003-2014
Revenue and Gross Margin of STATS ChipPAC, 2004-2014
Revenue of STATS ChipPAC by Package Type, 2006-2013
Revenue of STATS ChipPAC by Application, 2006- 2013
Revenue of STATS ChipPAC by Region, 2006-2013
Revenue and Operating Margin of PTI, 2006-2014
Revenue and Gross Margin of PTI, 2009-2014
Monthly Revenue and Growth of PTI, June 2012-June 2014
PTI Factories
TSV Solutions of PTI
Revenue of PTI by Business, 2011-2014
Revenue of PTI by Product, 2011-2014
Revenue, Gross Margin and Operating Margin of Greatek, 2005-2014
Revenue of Greatek by Technological Type, 2007-2010
Monthly Revenue and Growth Rate of Greatek, June 2012-June 2014
Revenue and Gross Margin of ChipMOS, 2003-2014
Revenue and Operating Margin of ChipMOS, 2009-2014
Revenue of ChipMOS by Business, 2010-2014
Revenue of ChipMOS by Product, 2010-2014
Utilization Rate and EBITDA Margin of ChipMOS, 2010-2014
Cash Flow and CAPEX of ChipMOS, 2009-2013
ChipMOS Technology Roadmap, 2014-2016E
ChipMOS Technology Development & Business Alignment, 2014-2016E
ChipMOS LCD Driver Capacity, 2010-2013
Revenue of ChipMOS by Client, 2013
Revenue of ChipMOS by Region, 2006-2013
Category Distribution of Active Patents of ChipMOS
Revenue and Gross Margin of KYEC, 2003-2014
Revenue and Operating Margin of KYEC, 2009-2014
Monthly Revenue of KYEC, June 2012-June 2014
KYEC Plants
KYEC Testing Platforms
Revenue and EBITDA of Unisem, 2006-2014
Revenue and EBITDA of Unisem, Q1 2011-Q1 2014
Revenue of Unisem by Product, Q2 2012-Q1 2014
Revenue of Unisem by Market, Q2 2012-Q1 2014
Organizational Structure of Formosa Plastics Group
Organizational Structure of FATC
Revenue and Operating Margin of FATC, 2006-2014
Revenue and Gross Margin of FATC, 2009-2014
Monthly Revenue of FATC, June 2012-June 2014
Revenue and Operating Margin of JECT, 2006-2014
Output and Sales Volume of JECT, 2011-2013
Cost Structure of JECT, 2012-2013
Revenue of JCET by Product, 2013-2014
Global CU Pilluar Capacity Distribution of JECT, 2012
Balance Sheet of JECT, 2009-2013
Package Cost Structure of JECT, 2011-2012
JCET ROADMAP
Revenue of JCET by Region, 2011
Revenue and Gross Margin of UTAC, 2010-2014
Revenue of UTAC by Business, 2010-2013
Revenue of UTAC by Region, 2010-2013
Revenue of UTAC by Product, 2010-2013
Revenue of UTAC by Client, 2010-2013
Revenue and Operating Margin of LINGSEN, 2007-2014
Revenue and Gross Margin of LINGSEN, 2009-2014
Monthly Revenue of LINGSEN, June 2012-June 2014
Revenue and Operating Income of Nantong Fujitsu Microelectronics, 2007-2014
Revenue and Operating Margin of Nantong Fujitsu Microelectronics, 2007-2014
Revenue and Operating Margin of Walton Advanced Engineering, 2007-2014
Revenue and Gross Margin of Walton Advanced Engineering, 2009-2014
Monthly Revenue and Growth Rate of Walton Advanced Engineering, June 2012-June 2014
Revenue and Operating Margin of Chipbond, 2006-2014
Revenue and Gross Margin of Chipbond, 2009-2014
Monthly Revenue and Growth Rate of Chipbond, June 2012-June 2014
Revenue of Chipbond by Business, 2012
Revenue of Chipbond by Market, 2012-2013
Global Gold Bumping Vendor Capacity Share, 2013
Organizational Structure of J-DEVICES
Revenue and PBT of MPI, FY2007-FY2014
Equity and Assets of MPI, FY2009-FY2013
Revenue of MPI by Region, FY2011-FY2013
Revenue of Carsem by Product, Q1 2011-Q1 2012
Organizational Structure of STS Semiconductor
Revenue and Operating Margin of STS Semiconductor, 2006-2014
Revenue of STS Semiconductor by Business, 2011-2013
Capacity of STS Semiconductor, 2011-2013
Output of STS Semiconductor, 2011-2013
Shareholder Structure of Signetics
Revenue and Operating Margin of Signetics, 2007-2014
Revenue and Operating Margin of Hana Micron, 2006-2014
Revenue of Hana Micron by Client, 2013
Revenue of Hana Micron by Market, 1Q2013-4Q2014
Revenue and Operating Margin of Nepes, 2007-2014
Quarterly Revenue of Nepes by Division, 2013-2014
Revenue and Operating Margin of Tian Shui Hua Tian Technology, 2006-2014
如果这份报告不能满足您的要求,我们还可以为您定制报告,请 留言说明您的详细需求。
|