|
|
|
报告导航:研究报告—
制造业—化工
|
|
2014-2017年中国聚醚单体(MPEG/APEG/TPEG)产业研究报告 |
 |
字数:3.3万 |
页数:92 |
图表数:125 |
|
中文电子版:7500元 |
中文纸版:3750元 |
中文(电子+纸)版:8000元 |
|
英文电子版:2250美元 |
英文纸版:3400美元 |
英文(电子+纸)版:2550美元 |
|
编号:QJC008
|
发布日期:2014-08 |
附件:下载 |
 |
|
|
中国市场聚醚单体主要有聚乙二醇单甲醚(MPEG)、烯丙基聚氧乙烯醚(APEG)和甲基烯基聚氧乙烯醚(TPEG)三类。随着研发能力的提高、生产技术的进步,聚醚单体已广泛应用于建筑工业、日用化工、医药制造等多个领域。
建筑用聚羧酸减水剂是中国聚醚单体产品的主要应用领域。2007-2013年,中国聚羧酸减水剂产量保持较快的增长速度,年均复合增长率达43.3%。2013年,中国聚羧酸减水剂消费量达360万吨,同比增长56.5%;聚羧酸减水剂所需聚醚单体量约在60万吨左右。
目前,中国仍有众多公司积极新建或扩建聚羧酸减水剂项目, 2013-2014年中国拟在建聚羧酸减水剂产能合计在43万吨以上。其中,四川高地四通新材料公司拟建产能12万吨、新乡源泰建材拟建产能8万吨。而聚羧酸减水剂行业发展将为聚醚单体产业提供广阔的需求空间,预计2014-2017年,中国减水剂用聚醚单体产量CAGR将达12.0%。
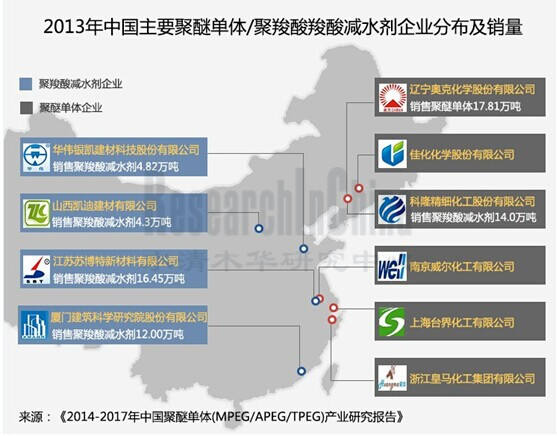
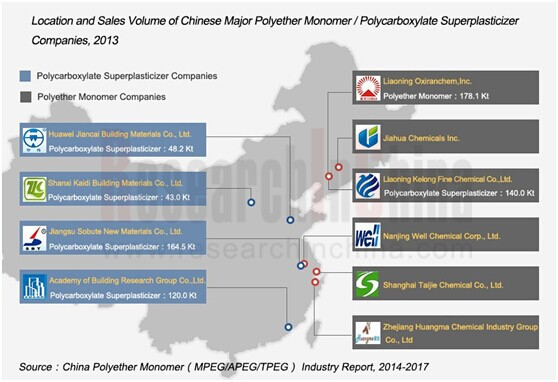
奥克化学、科隆化工、浙江皇马、上海台界等是中国聚醚单体主要供应商,合占中国聚羧酸减水剂市场60%以上份额。并且部分聚醚单体企业正积极向下游聚羧酸减水剂行业延伸。如上海台界,2013年其拥有聚羧酸专用聚醚12万吨,大单体、减水剂母料5万吨产能;2014年公司拟在四川省成都市建设年产5万吨聚醚、5万吨聚羟酸减水剂生产线。
水清木华研究中心《2014-2017年中国聚醚单体产业研究报告》主要包括以下几个内容:
 中国聚醚单体行业发展现状、市场供需、竞争格局以及发展预测等; 中国聚醚单体行业发展现状、市场供需、竞争格局以及发展预测等;
环氧乙烷、甲醇、烯基醇、丙烯酸等上游原材料的供需、产能扩张与价格变化对中国聚醚单体市场发展影响;
聚羧酸减水剂、表面活性剂等下游行业的供需、产能扩张与价格变化对中国聚醚单体市场发展影响;
国外3家、中国6家主要聚醚单体生产企业的经营现状、聚醚单体业务及发展前景等;
中国4家聚羧酸减水剂企业经营现状、减水剂业务及发展前景等。
Polyether monomer in the Chinese market mainly refers to methoxy polyethylene glycol (MPEG), allyloxy polyethylene glycol (APEG) and tresylated polyethylene glycol (TPEG). With the improvement of R & D capabilities and the progress of production technology, polyether monomers have been widely used in construction, daily chemicals, pharmaceutical manufacturing and other fields.
Construction-use polycarboxylate superplasticizer functions as the main application area for Chinese polyether monomer products. In 2007-2013, China’s polycarboxylate superplasticizer output grew rapidly at a CAGR of 43.3%. In 2013, China’s polycarboxylate superplasticizer consumption attained 3.6 million tons, up 56.5% year on year; the volume of polyether monomers demanded by polycarboxylate superplasticizer was around 600,000 tons.
For now, there are still numerous companies actively involved in construction and expansion of polycarboxylate superplasticizer projects in China, with planned and ongoing capacity of polycarboxylate superplasticizer totaling over 430,000 tons in 2013-2014, including 120,000 tons from Sichuan Gaodi Sitong New Materials Co., Ltd. and 80,000 tons generated by Xinxiang Yuantai Building Materials Co., Ltd.. The development of polycarboxylate superplasticizer will trigger large demand for polyether monomer; it is expected that China’s superplasticizer-use polyether monomer production will post a CAGR of 12.0% in 2014-2017.
Liaoning Oxiranchem,Inc., Liaoning Kelong Fine Chemical Co., Ltd., Zhejiang Huangma Chemical Industry Group Co., Ltd and Shanghai Taijie Chemical Co., Ltd. as major polyether monomer suppliers in China enjoy a combined market share of over 60%, and some companies are positively extending to the downstream polycarboxylate superplasticizer industry. For example, Taijie Chemical boasted 120,000 t/a polycarboxylate-dedicated polyether as well as 50,000 t/a macromonomer and superplasticizer masterbatch in 2013; in 2014, it intended to build a 50,000 t/a polyether and 50,000 t/a polycarboxylate superplasticizer production line in Chengdu.
China Polyether Monomer (MPEG/APEG/TPEG) Industry Report, 2014-2017 by ResearchInChina contains the followings:
Status quo, market supply & demand, competition pattern, prospects, etc. of Chinese polyether monomer industry;
Impact of supply & demand, capacity expansion and price variation of upstream raw materials such as ethylene oxide, methanol, acrylic acid and enol on the development of Chinese polyether monomer market;
Impact of supply & demand, capacity expansion and price changes of downstream segments e.g. polycarboxylate superplasticizer and surfactant on the development of Chinese polyether monomer market;
Operation, polyether monomer business, prospects, etc. of 3 foreign polyether monomer enterprises and 6 Chinese counterparts;
Operation, superplasticizer business, prospects, etc. of 4 polycarboxylate superplasticizer companies in China.
第一章 聚醚单体概述
1.1分类及应用
1.2 产业链
第二章 中国聚醚单体发展概况
2.1 发展现状
2.2 竞争格局
2.3 市场价格
2.4发展前景及预测
第三章 中国聚醚单体上游发展对其影响
3.1 环氧乙烷(EO)
3.1.1 市场供需
3.1.2 竞争格局
3.1.3 市场价格
3.2 甲醇
3.2.1 市场供需
3.2.2 市场价格
3.3 丙烯酸
3.3.1 市场需求
3.3.2 竞争格局
3.3.3 市场价格
3.4烯醇
第四章 中国聚醚单体下游发展对其影响
4.1 聚羧酸减水剂
4.1.1 市场供需
4.1.2 竞争格局
4.1.3 市场价格
4.2 表面活性剂
4.2.1 供给分析
4.2.2 需求分析
4.2.3 进出口
第五章 主要国外聚醚单体企业
5.1 陶氏化学(DOW)
5.1.1 公司简介
5.1.2 经营情况
5.1.3 高性能材料部门经营情况
5.1.3 聚醚单体业务
5.1.4 在华发展
5.2 科莱恩(Clariant)
5.2.1 公司简介
5.2.2 经营情况
5.2.3 聚醚单体业务
5.2.4 在华业务
5.3 Lotte Chemical Corporation
5.3.1 公司简介
5.3.2 经营情况
5.3.3 聚醚单体业务
5.3.4 在华业务
第六章 中国主要聚醚单体企业
6.1奥克股份
6.1.1 公司简介
6.1.2 经营情况
6.1.3 营收构成
6.1.4 毛利率
6.1.5 研发
6.1.6 客户
6.1.7 聚醚单体业务
6.1.8 预测与展望
6.2科隆化工
6.2.1 公司简介
6.2.2 经营情况
6.2.3 营收构成
6.2.4 毛利率
6.2.5 研发与投资
6.2.6 客户和供应商
6.2.7 聚醚单体和减水剂业务
6.2.8发展前景
6.3浙江皇马化工集团有限公司
6.3.1 公司简介
6.3.2 经营状况
6.3.3 聚醚单体业务
6.3.4 研发
6.4 上海台界化工有限公司
6.4.1 公司简介
6.4.2 经营现状及聚醚单体业务
6.5 佳化化学
6.5.1 公司简介
6.5.2 经营状况
6.5.3 营收构成
6.5.4 毛利率
6.5.5 主要客户
6.5.6 聚醚单体业务
6.6 南京威尔化工有限公司
6.6.1 公司简介
6.6.2 经营现状
6.6.3聚醚单体业务
第七章 中国主要聚羧酸系减水剂企业
7.1 江苏苏博特
7.1.1 公司简介
7.1.2 研发
7.1.3 减水剂业务
7.2建研集团
7.2.1 公司简介
7.2.2 经营状况
7.2.3 营收构成
7.2.4 毛利率
7.2.5 研发
7.2.6 主要客户
7.2.7 减水剂业务
7.2.8 预测与展望
7.3 华伟银凯
7.3.1 公司简介
7.3.2 经营状况
7.3.3 营收构成
7.3.4 聚羧酸减水剂业务
7.4 山西凯迪
7.4.1 公司简介
7.4.2 经营状况及减水剂业务
1. Overview of Polyether Monomer
1.1 Classification and Application
1.2 Industry Chain
2. Development of Polyether Monomer in China
2.1 Status Quo
2.2 Competition Pattern
2.3 Market Price
2.4 Outlook and Forecast
3. Development and Influence of Polyether Monomer Upstream in China
3.1 Ethylene Oxide (EO)
3.1.1 Market Supply and Demand
3.1.2 Competition Pattern
3.1.3 Market Price
3.2 Methanol
3.2.1 Market Supply and Demand
3.2.2 Market Price
3.3 Acrylic Acid (AA)
3.3.1 Market Supply and Demand
3.3.2 Competition Pattern
3.3.3 Market Price
3.4 Enol
4. Development and Influence of Polyether Monomer Downstream in China
4.1 Polycarboxylate Superplasticizer
4.1.1 Market Supply and Demand
4.1.2 Competition Pattern
4.1.3 Market Price
4.2 Surfactant
4.2.1 Supply
4.2.2 Demand
4.2.3 Import and Export
5. Major Foreign Polyether Monomer Enterprises
5.1 Dow
5.1.1 Profile
5.1.2 Operation
5.1.3 Operation of High-Performance Materials Division
5.1.4 Polyether Monomer Business
5.1.5 Development in China
5.2 Clariant
5.2.1 Profile
5.2.2 Operation
5.2.3 Polyether Monomer Business
5.2.4 Business in China
5.3 LOTTE CHEMICAL
5.3.1 Profile
5.3.2 Operation
5.3.3 Polyether Monomer Business
5.3.4 Business in China
6. Major Chinese Polyether Monomer Enterprises
6.1 Liaoning Oxiranchem,Inc.
6.1.1 Profile
6.1.2 Operation
6.1.3 Revenue Structure
6.1.4 Gross Margin
6.1.5 R&D
6.1.6 Customer
6.1.7 Polyether Monomer Business
6.1.8 Outlook and Forecast
6.2 Liaoning Kelong Fine Chemical Co., Ltd.
6.2.1 Profile
6.2.2 Operation
6.2.3 Revenue Structure
6.2.4 Gross Margin
6.2.5 R&D and Investment
6.2.6 Clients and Suppliers
6.2.7 Polyether Monomer and Superplasticizer Business
6.2.8 Prospects
6.3 Zhejiang Huangma Chemical Industry Group Co., Ltd
6.3.1 Profile
6.3.2 Operation
6.3.3 Polyether Monomer Business
6.3.4 R&D
6.4 Shanghai Taijie Chemical Co., Ltd.
6.4.1 Profile
6.4.2 Operation and Polyether Monomer Business
6.5 Jiahua Chemicals Inc.
6.5.1 Profile
6.5.2 Operation
6.5.3 Revenue Structure
6.5.4 Gross Margin
6.5.5 Major Clients
6.5.6 Polyether Monomer Business
6.6 Nanjing WELL Chemical Corp., Ltd.
6.6.1 Profile
6.6.2 Operation
6.6.3 Polyether Monomer Business
7. Major Chinese Polycarboxylate Superplasticizer Enterprises
7.1 Jiangsu Sobute New Materials Co., Ltd.
7.1.1 Profile
7.1.2 R&D
7.1.3 Superplasticizer Business
7.2 Xiamen Academy of Building Research Group Co.,Ltd.
7.2.1 Profile
7.2.2 Operation
7.2.3 Revenue Structure
7.2.4 Gross Margin
7.2.5 R&D
7.2.6 Major Clients
7.2.7 Superplasticizer Business
7.2.8 Outlook and Forecast
7.3 Shandong Huawei Yinkai Building Material Co.,Ltd
7.3.1 Profile
7.3.2 Operation
7.3.3 Revenue Structure
7.3.4 Polycarboxylate Superplasticizer Business
7.4 Shanxi Kaidi Building Materials Co., Ltd.
7.4.1 Profile
7.4.2 Operation and Superplasticizer Business
表:各类聚醚单体在减水剂领域的优劣比较
图:聚醚单体(MPEG/TPEG/APEG)产业链
图:中国三大聚醚单体在聚羧酸减水剂市场占比
图:2007-2013年中国减水剂用聚醚单体量
表:2013-2014年中国主要企业聚醚单体相关产能及扩张情况
图:2009-2014年中国聚醚单体(分产品)价格走势
图:2011-2017年中国减水剂用聚醚单体量
图:2006-2013年中国环氧乙烷产量及表观消费量
图:2013年中国环氧乙烷(分地区)产能占比
图:2013年中国环氧乙烷消费结构
图:2013中国环氧乙烷(按企业性质)产能分布
表:2014年下半年中国环氧乙烷拟投产情况
图:2008-2014年中国环氧乙烷(工业一级)市场平均价格
图:2007-2013年中国甲醇产能
图:2007-2014年中国精甲醇产量
图:2013年中国精甲醇(分地区)产量占比
图:2008-2014年中国甲醇进出口量及对外依存度
图:2011-2013年中国甲醇活跃合约结算价
表:2008-2013年中国丙烯酸表观消费量
表:2013年中国丙烯酸及酯(分企业/分产品)产能
表:2014-2016年中国主要丙烯酸及酯生产企业(分产品)扩建项目
图:2010-2014年中国丙烯酸及酯(分产品)月度市场均价
图:2007-2013年中国聚羧酸减水剂消费量
表:2013-2014年中国聚羧酸减水剂部分拟在建项目
表:2013年中国前10名聚羧酸减水剂生产企业销量和市场占有率
图:2013年中国前十聚羧酸减水剂企业销售额
图:2006-2013年中国AEO产量及增长率
图:2008-2013年中国AEO表面活性剂表观消费量及自给率
图:2008-2014年中国洗衣粉和洗涤剂产量
图:2008-2014年中国非离子表面活性剂进出口量
图:2008-2014年中国非离子表面活性剂进出口单价
图:2013年中国非离子表面活性剂进口来源分布(按进口量)
图:2013年中国非离子表面活性剂出口目的地分布(按出口量)
图:2008-2014年陶氏化学营业收入与净利润
图:2014年美国陶氏化学(分部门)销售额占比
图:2009-2014年陶氏化学高性能材料部门销售额及EBITDA
图:2013年陶氏化学高性能材料部门(分产品)销售额占比
图:2008-2014年克莱恩营业收入与净利润
表:克莱恩分部业务简介
图:2013年克莱恩(分业务)营业收入占比
图:2012-2013年克莱恩Care Chemicals营业收入及EBITDA
图:2012-2013年克莱恩Natural Resources营业收入及EBITDA
表:2013年克莱恩在华主要子公司
表:2013年克莱恩在华主要子公司业务
图:2011-2014年Lotte营业收入与净利润
表:Lotte业务部门及主要产品
图:2013年Lotte(分业务)营业收入占比
图:截止2013年Lotte主营产品及产能
表:截止2014年3月Lotte拟在建项目
表:2012-2013年Lotte在华主要子公司销售收入与净利润
图:2008-2014年奥克股份营业收入与净利润
表:2008-2013年奥克股份(分地区)主营收入占比
表:2008-2013年奥克股份(分地区)营业收入
表:2008-2013年奥克股份(分产品)主营收入占比
表:2008-2013年奥克股份(分产品)营业收入
图:2008-2014年奥克股份综合毛利率
表:2008-2013年奥克股份(分产品)毛利率
图:2010-2013年奥克股份研发费用及营收占比
图:2010-2013年奥克股份前五名客户营业收入及营收占比
表:2013年奥克股份前五名客户名称、收入贡献及占比
图:奥克股份业务定位图
图:2011-2013年奥克股份聚醚单体产销量
图:2008-2013年奥克股份聚醚单体营业收入与毛利率
表:2013年奥克股份环氧乙烷深加工业务相关子公司介绍
表:2013年奥克股份环氧乙烷深加工业务相关子公司营业收入及净利润
表:2013年奥克股份重大建设项目进展情况
表:2013年奥克股份环氧乙烷衍生物产品产能
图:2012-2017年奥克股份营业收入与净利润
图:2009-2011年科隆化工营业收入和净利润
表:2009-2011年科隆化工(分产品)营业收入
图:2009-2011年科隆化工(分产品)营业收入占比
表:2009-2011年科隆化工(分地区)营业收入
图:2009-2011年科隆化工(分地区)营业收入占比
图:2009-2011年科隆化工主营产品毛利率
图:2009-2011年科隆化工研发支出及其占营业收入的比例
图:2009-2011年科隆化工前五名客户贡献收入及占比
表:2011年科隆化工前五名客户名称、收入及营收占比
图:2009-2011年科隆化工前五名供应商采购额及占比
表:2011年科隆化工前五名供应商名称、采购金额及占比
表:2009-2011年科隆化工环氧乙烷衍生物产品产量、产能和产能利用率
图:2009-2011年科隆化工聚醚单体产销量及产销率
表:2009-2011年科隆化工聚羧酸减水剂产品产量、产能和产能利用率
图:2009-2011年科隆化工聚羧酸减水剂浓缩液产销率及产销率
图:2009-2011年科隆化工聚羧酸减水剂泵送剂产销率及产销率
表:2009-2011年科隆化工主营产品平均销售价格
图:2008-2011年浙江皇马营业收入及同比增长
表:浙江皇马聚乙二醇单甲醚MPEG系列产品
表:浙江皇马烯丙基聚氧乙烯APEG系列产品
表:浙江皇马甲氧基聚乙二醇甲基丙烯酸酯产品
表:上海台界聚乙二醇单甲醚MPEG系列产品
表:上海台界烯丙基聚氧乙烯APEG系列产品
图:2011-2013年佳化化学营业收入与净利润
图:2011-2013年佳化化学(分地区)主营收入占比
表:2011-2013年佳化化学(分地区)营业收入
表:2011-2013年佳化化学(分产品)主营收入占比
表:2011-2013年佳化化学(分产品)营业收入
表:2011-2013年佳化化学主营业务及分产品毛利率
图:2011-2013年佳化化学前五名客户营业收入及净利润
表:2013年佳化化学前五名客户名称、收入贡献及占比
图:2011-2013年佳化化学非离子表面活性剂业务销量、收入及单价
图:2011-2013年佳化化学非离子表面活性剂业务产能及利用率
表:2013年佳化化学募投项目
图:2007-2009年威尔化工主营收入和净利润
表:2013年威尔化工万吨封端醚项目相关产品及产能
表:威尔化工MPEG系列产品
表:威尔化工丙烯醇醚系列产品
表:2013年江苏苏博特(分产品)产能
表:江苏苏博特产品应用范例
图:2008-2014年建研集团营业收入与净利润
图:2011-2013年建研集团(分地区)营收占比
表:2011-2013年建研集团(分地区)营业收入
图:2010-2013年建研集团(分产品)营收占比
表:2010-2013年建研集团(分产品)营业收入
图:2010-2013年建研集团(分产品)毛利率
图:2010-2013年建研集团研发费用及营收占比
图:2010-2013年建研集团前五名客户营业收入及营收占比
图:2010-2013年建研集团外加剂业务收入及毛利率
图:2008-2013年建研集团外加剂产能及销量
表:2013年建研集团外加剂产品子公司及其营业收入、净利润
图:2012-2017年建研集团营业收入与净利润
图:2010-2013年华伟银凯营业收入与营业利润
图:2010-2013年华伟银凯(分产品)营业收入
图:2010-2013年华伟银凯(分产品)营收占比
表:2011-2013年华伟银凯(分地区)营业收入
图:2010-2013年华伟银凯聚羧酸减水剂营业收入与毛利率
Comparison between Advantages and Disadvantages of Various Polyether Monomers in Superplasticizer Field
Polyether Monomer (MPEG/TPEG/APEG) Industry Chain
Share of Three Polyether Monomers in Chinese Polycarboxylate Superplasticizer Market
China's Volume of Polyether Monomer Used in Superplasticizer, 2007-2013
Polyether Monomer Related Capacity and Expansion of Major Chinese Enterprises, 2013-2014
China's Polyether Monomer Price Trend (by Product), 2009-2014
China's Volume of Polyether Monomer Used in Superplasticizer, 2011-2017E
China's EO Output and Apparent Consumption, 2006-2013
China's EO Capacity Structure (by Region), 2013
China's EO Consumption Structure, 2013
China's EO Capacity Distribution (by Enterprise Property), 2013
China's EO Production Planned in the Second Half of 2014
Average Market Price of EO (Industrial First-grade) in China, 2008-2014
China's Methanol Capacity, 2007-2013
China's Refined Methanol Output, 2007-2014
China's Refined Methanol Output Structure (by Region), 2013
China's Methanol Import/Export Volume and Foreign-trade Dependence, 2008-2014
Active Contract Settlement Price of Methanol in China, 2011-2013
China's AA Apparent Consumption, 2008-2013
China's AA&AE Capacity (by Enterprise/Product), 2013
Expansion Projects of Major Chinese AA&AE Manufacturers (by Product), 2014-2016
Monthly Average Price of AA&AE (by Product) in China, 2010-2014
China's Polycarboxylate Superplasticizer Consumption, 2007-2013
China's Polycarboxylate Superplasticizer Projects Planned and Under Construction (Part), 2013-2014
Sales Volume and Market Share of Top 10 Polycarboxylate Superplasticizer Manufacturers in China, 2013
Sales of Top 10 Polycarboxylate Superplasticizer Manufacturers in China, 2013
China's AEO Output and Growth Rate, 2006-2013
China's Apparent Consumption and Self-sufficiency Rate of Surfactant AEO, 2008-2013
China's Output of Washing Powder and Detergent, 2008-2014
China's Import/Export Volume of Non-ionic Surfactant, 2008-2014
China's Import/Export Unit Price of Non-ionic Surfactant, 2008-2014
Distribution of China's Non-ionic Surfactant Import Sources (by Import Volume), 2013
Distribution of China's Non-ionic Surfactant Export Destinations (by Export Volume), 2013
Revenue and Net Income of Dow, 2008-2014
Sales Structure of Dow (by Division), 2014
Sales and EBITDA of Dow's High Performance Materials Division, 2009-2014
Sales Structure of Dow's High Performance Materials Division (by Product), 2013
Revenue and Net Income of Clariant, 2008-2014
Business Introduction of Clariant by Division
Revenue Structure of Clariant (by Business), 2013
Revenue and EBITDA of Clariant - Care Chemicals, 2012-2013
Revenue and EBITDA of Clariant - Natural Resources, 2012-2013
Main Subsidiaries of Clariant in China, 2013
Business of Clariant's Main Subsidiaries in China, 2013
Revenue and Net Income of LOTTE, 2011-2014
Business Segments and Main Products of LOTTE
Revenue Structure of LOTTE (by Business), 2013
Main Products and Capacity of LOTTE as of 2013
LOTTE's Projects Planned and Under Construction as of March 2014
Sales and Net Income of LOTTE's Main Subsidiaries in China, 2012-2013
Revenue and Net Income of Liaoning Oxiranchem, 2008-2014
Operating Revenue Structure of Liaoning Oxiranchem (by Region), 2008-2013
Revenue Breakdown of Liaoning Oxiranchem (by Region), 2008-2013
Operating Revenue Structure of Liaoning Oxiranchem (by Product), 2008-2013
Revenue Breakdown of Liaoning Oxiranchem (by Product), 2008-2013
Consolidated Gross Margin of Liaoning Oxiranchem, 2008-2014
Gross Margin of Liaoning Oxiranchem (by Product), 2008-2013
R&D Costs and % of Total Revenue of Liaoning Oxiranchem, 2010-2013
Liaoning Oxiranchem's Revenue from Top 5 Clients and % of Total Revenue, 2010-2013
Name List and Revenue Contribution of Liaoning Oxiranchem's Top 5 Clients, 2013
Business Location Map of Liaoning Oxiranchem
Output and Sales Volume of Liaoning Oxiranchem's Polyether Monomer, 2011-2013
Revenue and Gross Margin of Liaoning Oxiranchem's Polyether Monomer, 2008-2013
Introduction to EO Deep Processing Related Subsidiaries of Liaoning Oxiranchem, 2013
Revenue and Net Income of EO Deep Processing Related Subsidiaries of Liaoning Oxiranchem, 2013
Progress of Liaoning Oxiranchem's Key Construction Projects, 2013
Capacity of Liaoning Oxiranchem's EO Derivatives, 2013
Revenue and Net Income of Liaoning Oxiranchem, 2012-2017E
Revenue and Net Income of Kelong Fine Chemical, 2009-2011
Revenue Breakdown of Kelong Fine Chemical (by Product), 2009-2011
Revenue Structure of Kelong Fine Chemical (by Product), 2009-2011
Revenue Breakdown of Kelong Fine Chemical (by Region), 2009-2011
Revenue Structure of Kelong Fine Chemical (by Region), 2009-2011
Gross Margin of Main Products of Kelong Fine Chemical, 2009-2011
R&D Costs and % of Total Revenue of Kelong Fine Chemical, 2009-2011
Kelong Fine Chemical's Revenue from Top 5 Clients and % of Total Revenue, 2009-2011
Name List and Revenue Contribution of Kelong Fine Chemical's Top 5 Clients, 2011
Kelong Fine Chemical's Procurement from Top 5 Suppliers and % of Total Procurement, 2009-2011
Name List and Procurement Contribution of Kelong Fine Chemical's Top 5 Suppliers, 2011
Output, Capacity and Capacity Utilization of Kelong Fine Chemical's EO Derivatives, 2009-2011
Output, Sales Volume and Sales-Output Ratio of Kelong Fine Chemical's Polyether Monomer, 2009-2011
Output, Capacity and Capacity Utilization of Kelong Fine Chemical's Polycarboxylate Superplasticizer Products, 2009-2011
Output, Sales Volume and Sales-Output Ratio of Kelong Fine Chemical's Polycarboxylate Superplasticizer Concentrates, 2009-2011
Output, Sales Volume and Sales-Output Ratio of Kelong Fine Chemical's Polycarboxylate Superplasticizer (Pumping Agent), 2009-2011
Average Selling Price of Kelong Fine Chemical's Main Products, 2009-2011
Revenue and YoY Growth of Huangma Chemical, 2009-2011
MPEG Products of Huangma Chemical
APEG Products of Huangma Chemical
MPEGMA Products of Huangma Chemical
MPEG Products of Taijie Chemical
APEG Products of Taijie Chemical
Revenue and Net Income of Jiahua Chemicals
Operating Revenue Structure of Jiahua Chemicals (by Region), 2011-2013
Revenue Breakdown of Jiahua Chemicals (by Region), 2011-2013
Operating Revenue Structure of Jiahua Chemicals (by Product), 2011-2013
Revenue Breakdown of Jiahua Chemicals (by Product), 2011-2013
Main Business and Gross Margin (by Product) of Jiahua Chemicals, 2011-2013
Jiahua Chemicals' Revenue from Top 5 Clients and % of Total Revenue, 2011-2013
Name List and Revenue Contribution of Jiahua Chemicals' Top 5 Clients, 2013
Sales Volume, Revenue and Unit Price of Jiahua Chemicals' Non-ionic Surfactant, 2011-2013
Capacity and Capacity Utilization of Jiahua Chemicals' Non-ionic Surfactant, 2011-2013
Fundraising Projects of Jiahua Chemicals, 2013
Operating Revenue and Net Income of WELL Chemical, 2007-2009
Related Products and Capacity of WELL Chemical's 10KT Terminated Ether Project, 2013
MPEG Products of WELL Chemical
Allyl Alcohol Ether Products of WELL Chemical
Capacity of Sobute New Materials (by Product), 2013
Product Application of Sobute New Materials (Model)
Revenue and Net Income of Building Research, 2008-2014
Revenue Structure of Building Research (by Region), 2011-2013
Revenue Breakdown of Building Research (by Region), 2011-2013
Revenue Structure of Building Research (by Product), 2010-2013
Revenue Breakdown of Building Research (by Product), 2010-2013
Gross Margin of Building Research (by Product), 2010-2013
R&D Costs and % of Total Revenue of Building Research, 2010-2013
Building Research's Revenue from Top 5 Clients and % of Total Revenue, 2010-2013
Revenue and Gross Margin of Building Research's Admixtures, 2010-2013
Capacity and Sales Volume of Building Research's Admixtures, 2008-2013
Revenue and Net Income of Building Research's Admixture Subsidiaries, 2013
Revenue and Net Income of Building Research, 2012-2017E
Revenue and Operating Income of Huawei Yinkai, 2010-2013
Revenue Breakdown of Huawei Yinkai (by Product), 2010-2013
Revenue Structure of Huawei Yinkai (by Product), 2010-2013
Revenue Breakdown of Huawei Yinkai (by Region), 2011-2013
Revenue and Gross Margin of Huawei Yinkai's Polycarboxylate Superplasticizer, 2010-2013
如果这份报告不能满足您的要求,我们还可以为您定制报告,请 留言说明您的详细需求。
|