|
|
|
报告导航:研究报告—
生命科学—制药医疗
|
|
2014-2017年中国医院行业发展与投资研究报告 |
 |
字数:5.7万 |
页数:157 |
图表数:154 |
|
中文电子版:8000元 |
中文纸版:4000元 |
中文(电子+纸)版:8500元 |
|
英文电子版:2500美元 |
英文纸版:2700美元 |
英文(电子+纸)版:2800美元 |
|
编号:PQ011
|
发布日期:2014-08 |
附件:下载 |
 |
|
|
由于市场需求的刺激和医改的稳步推进,近年来中国医院行业发展较快。2011-2013年中国医院数量实现年复合增长率达到6%,而2005-2010年仅为2.26%。2011-2013年中国医院行业收入年复合增长率达到23.6%,预计2014-2017年仍能保持20%以上增速,至2017年可达40664亿元。
与此同时,各路社会资本正通过自建、并购(包括参与公立医院改制)、合资、联营等形式涉足中国医院市场,促进了民营医院扩张。截至2013年底,中国民营医院已占据中国医院总量的45.8%,较2006年增加了24.5个百分点。不过,从整个行业收入比重来看,公立医院占到九成以上,仍占主导地位,但其占比呈现逐年减少的趋势。
在民营医院投资浪潮中,专科医院由于投资相对小、回报率高以及市场需求旺盛等因素,已成为社会资本最为热衷的投资领域。目前,中国专科医院中民营医院的比例达到了65%左右。专科医院如口腔医院、眼科医院、整形外科&美容医院的利润率可达到10%以上,远高于中国医院整体水平(5%左右),市场需求较旺。
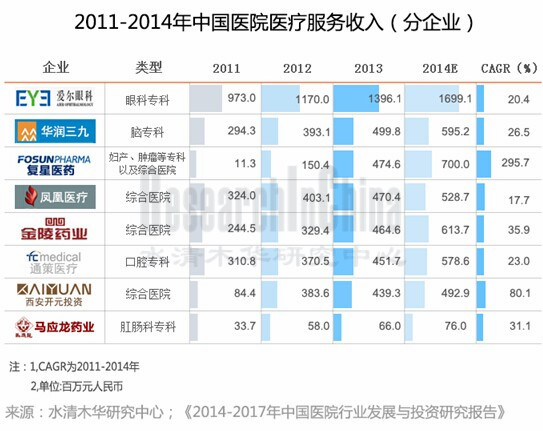
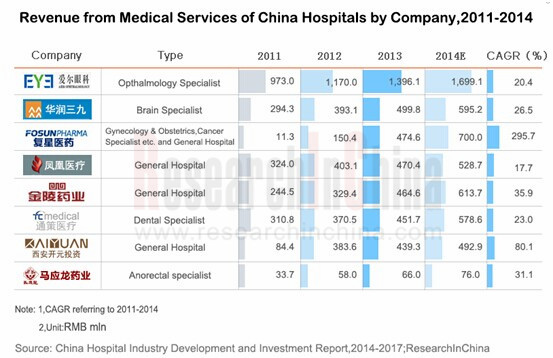
复兴医药、金陵药业、福瑞股份、武汉健民、益佰制药、华润三九和康美药业等以医药为主营业务的企业也正积极向下游医疗服务延伸。其中,复星医药已通过兼并/收购的方式布局妇产、肿瘤等专科以及综合医院领域。2013年复星医药来自医院医疗服务的收入达到4.746亿元,较上年增长215.6%。
外资企业主要采取合作经营、参股、合资新建医院(外资主导)的方式在华运营,如美中互利和睦家、新加坡百汇班底等,其主要定位于中高端医疗市场。截至2014年6月底,和睦家医院网点已覆盖北京、上海、无锡、广州、天津五大城市,并正在建设青岛和广州的两家医院。
2014-2017年中国医院行业发展与投资研究报告》主要包括以下几个方面:
 中国医院行业市场概况,包括各类医院数量变化情况、经营情况、医疗服务现状、竞争格局等; 中国医院行业市场概况,包括各类医院数量变化情况、经营情况、医疗服务现状、竞争格局等;
中国专科医院发展现状,包括专科医院总体运行情况和眼科、口腔、整形外科、美容、妇产、儿童、肿瘤等专科医院经营现状、发展前景等;
中国医院行业发展预测,包括中国医疗保障现状、推进城镇化对中国医疗市场影响以及医疗资源供给与需求预测等;
中国医院行业投资分析,包括社会资本进入医院行业相关政策、民营医院与公立医院运营效率对比、专科医院及公立医院投资机会、外资医院在华经营模式等;
中国17家涉足医院市场的企业经营情况、投资并购、医疗服务及发展预测等。
China hospital industry has been developing quickly in recent years, thanks to the market demand stimulus and steady progress in health care reform. The number of Chinese hospitals grew at a CAGR of 6% in 2011-2013, higher than 2.26% in 2005-2010. The revenue of China hospital industry jumped at a CAGR of 23.6% in 2011-2013, and it is expected to maintain the growth rate of over 20% and hit RMB4.07 trillion in 2017.
At the same time, various social capital flows to the Chinese hospital market by self-establishment, mergers and acquisitions (including participation in the restructuring of public hospitals), joint ventures, associates and other forms, which boosts the expansion of private hospitals. As of the end of 2013, Chinese private hospitals had accounted for 45.8% of the total Chinese hospitals, increasing by 24.5 percentage points compared with 2006. However, from the point of view of revenue structure, public hospitals still took a dominant position with the proportion of over 90%, but the figure shows a decreasing trend now.
In the private hospital investment boom, specialized hospitals involved with small investment, high returns and strong market demand have become a hotspot for social capital. Currently, the proportion of Chinese specialized hospitals in private hospitals reaches about 65%. Specialized hospitals in huge demand, such as dental hospitals, ophthalmic hospitals, plastic surgery & cosmetic hospitals, even achieve the profit margins of more than 10%, much higher than the overall level of Chinese hospitals (about 5%).
The enterprises focusing on medicine, including Shanghai Fosun Pharmaceutical, Jinling Pharmaceutical, Inner Mongolia Furui Medical Science, Wuhan Jianmin Pharmaceutical, Yibai Pharmaceutical, China Resources Sanjiu and Kangmei Pharmaceutical, are actively extending to downstream medical services. Shanghai Fosun Pharmaceutical has stepped in obstetrics & gynecology, tumor and other areas through mergers and acquisitions; its revenue from hospital medical services reached RMB474.6 million in 2013, representing a substantial increase of 215.6% over previous year.
Targeting medium and high-end medical markets, foreign-funded enterprises mainly adopt cooperative operation, equity participation, joint ventures (under the lead of foreign investors) and other approaches to develop business in China, such as Chindex United Family Hospital and Parkway Pantai. United Family Hospital had covered Beijing, Shanghai, Wuxi, Guangzhou and Tianjin by the end of June 2014, and its hospitals in Qingdao and Guangzhou are under construction.
The report highlights the followings:
China hospital industry market overview: number of hospitals of all sorts, operation, status quo of medical service, competition pattern, etc.
Current development of specialized hospitals in China: overall operation, operation of ophthalmic hospitals, dental hospitals, plastic surgery hospitals, cosmetic hospitals, obstetrics and gynecology hospitals, Children’s hospitals, and tumor hospitals as well as their development outlook;
Development prediction of China hospital industry: status quo of China medical security, influence of urbanization enhancement on China healthcare market, supply and demand of medical resources;
Investment in China hospital industry: related polices on social capital flowing into the hospital industry, operational efficiency comparison between Private hospitals and public ones, investment opportunities of specialized hospitals and public hospitals, business mode of foreign-funded hospitals in China;
Operation, investment, mergers & acquisitions, medical services and development prediction of 17 companies involved in the Chinese hospital market.
第一章 中国医院行业概述
1.1 定义
1.2 分类
1.3 产业链
第二章 中国医院行业市场概况
2.1 医院数量
2.1.1 医院数量稳步增长
2.1.2 民营医院增长速度较快
2.1.3 医院分布地域差异显著
2.2 营业收入
2.2.1 营业总收入快速增长
2.2.2 综合医院收入占比最大
2.2.3 综合医院药品收入占比缓慢下降
2.3 利润水平
2.3.1 利润率水平整体改善
2.3.2 专科医院利润率最高
2.4 医疗服务
2.4.1 医疗资源分布严重不均
2.4.2 医疗人员不足影响行业增长
2.5 竞争格局
第三章 中国专科医院发展现状
3.1 专科医院运行情况
3.1.1 民营专科医院比例持续增长
3.1.2 专科医院收入呈快速增长趋势
3.1.3 专科医院利润率分化严重
3.2 各类专科医院现状
3.2.1 眼科医院
3.2.2 口腔医院
3.2.3 整形外科和美容医院
3.2.4 妇产医院
3.2.5 儿童医院
3.2.6 肿瘤医院
第四章 中国医院行业发展预测分析
4.1 中国医疗保障现状
4.1.1 医保体系
4.1.2 医保覆盖率接近饱和
4.1.3 城乡居民大病医保
4.2 城镇化推动医院行业发展
4.2.1 中国城镇化现状
4.2.2 城镇化将优化医疗保健体系
4.2.3 异地医保结算稳步推进
4.2.4 城镇化通过医疗保障体系贡献增量
4.2.5 医保基金结余率有望进一步降低
4.2.6 县医院医疗资源供给能力将提升
4.2.7 城镇化将推动政府投资城市医疗资源
第五章 中国医院行业投资分析
5.1 政策环境转暖
5.2 公立医院与民营医院对比分析
5.2.1 公立医院占据主导地位
5.2.2 民营医院运营效率更高
5.3 社会资本投资机会
5.3.1 专科医疗领域
5.3.2 综合性公立医院
5.4 外资医院发展方向及经营模式
5.4.1 外资医院在华现状
5.4.2 外资医院发展方向
5.4.3 外资医院经营方式
第六章 中国医院主要企业
6.1 爱尔眼科
6.1.1 企业简介
6.1.2 经营情况
6.1.3 营收构成
6.1.4 毛利率
6.1.5 医疗服务
6.1.6 发展预测
6.2 通策医疗
6.2.1 企业简介
6.2.2 经营情况
6.2.3 营收构成
6.2.4 毛利率
6.2.5 医疗服务
6.2.6 发展预测
6.3 马应龙
6.3.1 企业简介
6.3.2 经营情况
6.3.3 营收构成
6.3.4 毛利率
6.3.5 医疗服务
6.3.6 发展预测
6.4 复星医药
6.4.1 企业简介
6.4.2 经营情况
6.4.3 营收构成
6.4.4 毛利率
6.4.5 研发和投资
6.4.6 医疗服务
6.4.7 发展预测
6.5 金陵药业
6.5.1 企业简介
6.5.2 经营情况
6.5.3 营收构成
6.5.4 毛利率
6.5.5 医疗服务
6.5.6 发展预测
6.6 新华医疗
6.6.1 企业简介
6.6.2 经营情况
6.6.3 营收构成
6.6.4 毛利率
6.6.5 医疗服务
6.6.6 发展预测
6.7 开元投资
6.7.1 企业简介
6.7.2 经营情况
6.7.3 营收构成
6.7.4 毛利率
6.7.5 医疗服务
6.7.6 发展预测
6.8 福瑞股份
6.8.1 企业简介
6.8.2 经营情况
6.8.3 营收构成
6.8.4 毛利率
6.8.5 医疗服务
6.8.6 发展预测
6.9 武汉健民
6.9.1 企业简介
6.9.2 经营情况
6.9.3 营收构成
6.9.4 毛利率
6.9.5 医疗服务
6.9.6 发展预测
6.10 泰和城
6.10.1 企业简介
6.10.2 经营情况
6.10.3 营收构成
6.10.3 毛利率
6.10.4 医疗服务
6.11 和睦家
6.11.1 企业简介
6.11.2 经营情况
6.11.3 医疗服务
6.12 百汇班底
6.12.1 企业简介
6.12.2 经营情况
6.12.3 医疗服务
6.13鳯凰医疗
6.13.1 企业简介
6.13.2 经营情况
6.13.3 医疗服务
6.14益佰制药
6.14.1 企业简介
6.14.2 经营情况
6.14.3 医疗服务
6.15华润三九
6.15.1 企业简介
6.15.2 经营情况
6.15.3 医疗服务
6.16康美药业
6.16.1 企业简介
6.16.2 经营情况
6.16.3 医疗服务
6.17模塑科技
6.17.1 企业简介
6.17.2 经营情况
6.17.3 医疗服务
第七章 总结与预测
7.1 总结
7.2 预测
1. Overview of China Hospital Industry
1.1 Definition
1.2 Classification
1.3 Industry Chain
2. Overview of China Hospital Market
2.1 Number of Hospitals
2.1.1 Number of Hospitals Grows Steadily
2.1.2 Private Hospitals Show Faster Growth Rate
2.1.3 Distinct Regional Distribution of Hospitals
2.2 Revenue
2.2.1 Total Revenue Surges Rapidly
2.2.2 Revenue of General Hospitals Occupies Lion’s Share
2.2.3 Proportion of Revenue from Medicine of General Hospitals on a Slow Decline
2.3 Profit
2.3.1 Profit Margin Recovers
2.3.2 Gross Margin of Specialized Hospitals Records the Highest
2.4 Medical Service
2.4.1 Severely Uneven Distribution of Medical Resources
2.4.2 Insufficient Medical Personal Impacts the Growth of Hospital Industry
2.5 Competition Pattern
3. Current Development of Specialized Hospitals in China
3.1 Operation
3.1.1 Proportion of Private Specialized Hospitals Continues to Rise
3.1.2 Revenue Generated by Specialized Hospitals Sees Rapid Growth
3.1.3 Specialized Hospitals Differ Dramatically in Profit Margin
3.2 Status Quo of Various Specialized Hospitals
3.2.1 Ophthalmic Hospitals
3.2.2 Dental Hospitals
3.2.3 Plastic Surgery and Cosmetic Hospitals
3.2.4 Obstetrics and Gynecology Hospitals
3.2.5 Children's Hospitals
3.2.6 Tumor Hospitals
4. Development Forecast of China Hospital Industry
4.1 Status Quo of China Medical Insurance
4.1.1 Medical Insurance System
4.1.2 Medical Insurance Nearly Realizes 100% Coverage
4.1.3 Medical Insurance for Serious Illness of Urban and Rural Residents
4.2 Urbanization Bolsters Development of the Hospital Industry
4.2.1 Status Quo of Urbanization in China
4.2.2 Urbanization Expects to Optimize Medical Insurance System
4.2.3 Trans-regional Medical Insurance Settlement is Promoted Soundly
4.2.4 Urbanization Incrementation Depends on the Contribution of Medical Insurance System
4.2.5 Medical Insurance Fund Balance Rate Will See Further Decrease
4.2.6 Medical Resource Supply of County-Level Hospitals Will Improve
4.2.7 Urbanization Will Encourage Central Government to Invest in Urban Medical Resources
5. Investment in China Hospital Industry
5.1 Policy Environment Becomes Warm
5.2 Comparison between Public Hospitals and Private Hospitals
5.2.1 Public Hospitals Occupy a Dominant Position
5.2.2 Private Hospitals See Higher Efficiency of Operation
5.3 Investment Opportunities of Social Capital
5.3.1 Specialized Medical Field
5.3.2 General Public Hospitals
5.4 Development Direction and Operation Mode of Foreign Hospitals
5.4.1 Status Quo of Foreign Hospitals in China
5.4.2 Development Direction of Foreign Hospitals
5.4.3 Operation Mode of Foreign Hospitals
6 Major Chinese Enterprises
6.1 Aier Eye Hospital Group
6.1.1 Profile
6.1.2 Operation
6.1.3 Revenue Structure
6.1.4 Gross Margin
6.1.5 Medical Services
6.1.6 Prediction
6.2 TC Medical
6.2.1 Profile
6.2.2 Operation
6.2.3 Revenue Structure
6.2.4 Gross Margin
6.2.5 Medical Services
6.2.6 Prediction
6.3 Mayinglong Pharm
6.3.1 Profile
6.3.2 Operation
6.3.3 Revenue Structure
6.3.4 Gross Margin
6.3.5 Medical Services
6.3.6 Prediction
6.4 Shanghai Fosun Pharmaceutical
6.4.1 Profile
6.4.2 Operation
6.4.3 Revenue Structure
6.4.4 Gross Margin
6.4.5 R&D and Investment
6.4.6 Medical Services
6.4.7 Prediction
6.5 Jinling Pharmaceutical
6.5.1 Profile
6.5.2 Operation
6.5.3 Revenue Structure
6.5.4 Gross Margin
6.5.5 Medical Services
6.5.6 Prediction
6.6 Shinva Medical
6.6.1 Profile
6.6.2 Operation
6.6.3 Revenue Structure
6.6.4 Gross Margin
6.6.5 Medical Services
6.6.6 Prediction
6.7 Xi’an Kaiyuan Investment
6.7.1 Profile
6.7.2 Operation
6.7.3 Revenue Structure
6.7.4 Gross Margin
6.7.5 Medical Services
6.7.6 Prediction
6.8 Inner Mongolia Furui Medical Science
6.8.1 Profile
6.8.2 Operation
6.8.3 Revenue Structure
6.8.4 Gross Margin
6.8.5 Medical Services
6.8.6 Prediction
6.9 Wuhan Jianmin Pharmaceutical
6.9.1 Profile
6.9.2 Operation
6.9.3 Revenue Structure
6.9.4 Gross Margin
6.9.5 Medical Services
6.9.6 Prediction
6.10 CMS Holdings Ltd.
6.10.1 Profile
6.10.2 Operation
6.10.3 Revenue Structure
6.10.4 Gross Margin
6.10.5 Medical Services
6.11 United Family Hospital
6.11.1 Profile
6.11.2 Operation
6.11.3 Medical Services
6.12 Parkway Pantai
6.12.1 Profile
6.12.2 Operation
6.12.3 Medical Services
6.13 Phoenix Healthcare
6.13.1 Profile
6.13.2 Operation
6.13.3 Medical Services
6.14 Yibai Pharmaceutical
6.14.1 Profile
6.14.2 Operation
6.14.3 Medical Services
6.15 China Resources Sanjiu
6.15.1 Profile
6.15.2 Operation
6.15.3 Medical Services
6.16 Kangmei Pharmaceutical
6.16.1 Profile
6.16.2 Operation
6.16.3 Medical Services
6.17 Jiangnan Mould & Plastic Technology
6.17.1 Profile
6.17.2 Operation
6.17.3 Medical Services
7 Summary and Forecast
7.1 Summary
7.2 Forecast
表:中国医院类型及简介
图:中国医院行业产业链
图:2005-2013年中国医院数量及同比增长
图:2006-2013年中国医院数量(按等级)
图:2006-2013年中国医院数量(按经济类型)
图:2006-2013年中国医院数量(按管理类别)
表:2006-2013年中国医院数量(按机构类别)
表:2014年4月中国各地区医院数量
图:2005-2013年中国医院行业总收入及同比增长
图:2012年中国医院总收入构成(按收入来源)
图:2008-2013年中国医院行业总收入构成(按机构类别)
表:2008-2013年中国医院行业平均收入(按机构类别)
图:2005-2013年中国平均每所综合医院总收入
图:2008-2013年中国平均每所综合医院业务收入(分业务)
图:2008-2013年中国平均每所综合医院药品加价率
图:2006-2013年中国医院利润率
图:2009-2013年中国医院利润率(按机构类别)
图:2005-2013年中国医院诊疗人次
图:2005-2013年中国医院病床数及病床使用率
表:2006-2013年中国医院、病床及病床使用率对比分析(按经济类型)
图:2006-2013年中国医院执业医师和注册护士数量
图:2006-2013年中国医科毕业人数
图:2012年中国各医疗领域公立和非公立医院比例
图:2006-2013年中国专科医院数量及其占比
图:2006-2013年中国专科医院构成(按经济类型)
表:2010-2012年中国各类专科医院数量
图:2005-2013年中国专科医院总收入及同比增长
表:2010-2012年中国各类专科医院总收入
表:2010-2012年中国各类专科医院利润率
图:2006-2012年中国眼科医院数量
表:2006-2012年中国眼科专科医院收入和利润
表:2006-2012年中国眼科专科医院病床使用率和医师服务效率情况
图:2006-2012年中国口腔医院数量
表:2006-2012年中国口腔专科医院收入和利润
表:2006-2012年中国口腔专科医院病床使用率和医师服务效率情况
表:通策医疗、佳美口腔、瑞尔齿科竞争对比
图:2006-2012年中国整形外科和美容医院数量
表:2006-2012年中国整形外科和美容专科医院收入和利润
图:2006-2012年中国妇产医院数量
表:2006-2012年中国妇产专科医院收入和利润
表:2006-2012年中国妇产专科医院病床使用率和医师服务效率情况
图:2006-2012年中国儿童医院数量
表:2006-2012年中国儿童专科医院收入和利润
表:2006-2012年中国儿童专科医院病床使用率和医师服务效率情况
图:2006-2012年中国肿瘤医院数量
表:2006-2012年中国肿瘤专科医院收入和利润
表:2006-2012年中国肿瘤专科医院病床使用率和医师服务效率情况
表:中国医保体系构成
图:2005-2013年中国医保覆盖人口情况
图:2005-2013年中国医保总覆盖率
表:2009-2013年中国三种医疗保险人均支出
图:2000-2013年中国城镇化率
图:2005-2013年中国医疗保健支出构成
图:2007-2013年中国城镇职工基本保险及新农合人均筹资状况
图:2005-2013年中国城镇职工医保与新农合基金结余率
表:2009-2014年中国县级医院建设扶持政策
图:2015年中国深度城镇化对医疗服务影响
表:1985-2014年中国社会资本进入医疗服务领域里程碑事件
表:2009-2014年中国社会资本进入医疗服务领域的相关政策
表:中国民营医院与公立医院政策方面差别
图:中国公立医院委托代理链
图:2008-2013年中国公立医院收入及市场份额
图:2008-2013年中国公立医院利润及利润率
图:2008-2013年中国民营医院收入及市场份额
图:2008-2013年中国民营医院利润额及利润率
表:中国主要医疗服务专科项目比较
表:中国医疗服务体系市场化趋势
表:中国公立医院既有产权制度改革模式
表:1999-2014年中国社会资本试水公立医院改制部分案例
表:中国部分中外合作经营医院合作方及主要医疗服务
表:中国部分外资主导合资医院合作方及主要服务
图:2009-2014年爱尔眼科营业收入、净利润及资产负债率
表:2009-2013年爱尔眼科(分产品)营业收入
表:2009-2013年爱尔眼科(分地区)营业收入
表:2009-2014年爱尔眼科毛利率(分产品)
图:2014-2017年爱尔眼科营业收入和净利润预测
图:2009-2014年通策医疗营业收入、净利润及资产负债率
图:2009-2014年通策医疗(分产品)营业收入
图:2009-2014年通策医疗(分地区)营业收入
表:2009-2014年通策医疗毛利率(分产品)
图:通策医疗客户定位
表:2011和2013年通策医疗各子公司经营情况对比分析
图:2014-2017年通策医疗营业收入和净利润预测
图:2009-2014年马应龙营业收入、净利润及资产负债率
表:2009-2013年马应龙(分产品)营业收入
表:2009-2013年马应龙(分地区)营业收入
表:2009-2014年马应龙毛利率(分产品)
图:马应龙肛肠连锁医院发展历史
表:马应龙旗下肛肠医院建立方式及股权占比
图:2009-2013年马应龙医院诊疗收入及同比增长
表:马应龙肛肠专科医院与爱尔眼科和通策医疗对比
图:2014-2017年马应龙营业收入和净利润预测
图:2009-2014年复星医药营业收入、净利润及资产负债率
图:2009-2013年复星医药(分产品)营业收入
图:2009-2013年复星医药(分地区)营业收入
表:2009-2014年复星医药毛利率(分产品)
图:2009-2013年复星医药研发支出及其营收占比
图:2014年和睦家已布局地区及预计布局地区
图:2011-2013年复星医药医疗服务收入及同比增长
图:2014-2017年复星医药营业收入和净利润预测
图:2009-2014年金陵药业营业收入、净利润及资产负债率
图:2009-2013年金陵药业(分产品)营业收入
表:2009-2013年金陵药业(分地区)营业收入
表:2009-2014年金陵药业毛利率(分产品)
图:2009-2013年金陵药业医疗收入及同比增长
图:2014-2017年金陵药业营业收入和净利润预测
图:2009-2014年新华医疗营业收入、净利润及资产负债率
图:2009-2013年新华医疗(分产品)营业收入
图:2009-2013年新华医疗(分地区)营业收入
表:2009-2014年新华医疗毛利率(分产品)
图:2014-2017年新华医疗营业收入和净利润预测
图:2009-2014年开元投资营业收入、净利润及资产负债率
表:2009-2013年开元投资(分行业)营业收入
表:2009-2013年开元投资(分地区)营业收入
表:2009-2014年开元投资毛利率(分产品)
图:2011-2013年开元投资医疗业收入
表:2011-2013年西安高新医院营业收入、净利润及净利润率
图:2014-2017年开元投资营业收入和净利润预测
图:2009-2014年福瑞股份营业收入、净利润及资产负债率
图:2009-2013年福瑞股份(分产品)营业收入
表:2009-2013年福瑞股份(分地区)营业收入
表:2009-2014年福瑞股份毛利率(分产品)
表:福瑞股份连锁医院投入资金及运营时间
图:2014-2017年福瑞股份营业收入和净利润预测
图:2009-2014年武汉健民营业收入、净利润及资产负债率
表:2009-2013年武汉健民(分产品)营业收入
表:2009-2013年武汉健民(分地区)营业收入
表:2009-2014年武汉健民毛利率(分产品)
图:2014-2017年武汉健民营业收入和净利润预测
图:2009-2014年泰和城营业收入和净利润
图:2011-2013年泰和城(分产品)营业收入
表:2009-2014年泰和城毛利率(分产品)
图:泰和城服务网络覆盖地区
图:2012和2013年泰和城医院收入及其营收占比
图:2007-2013年和睦家医院营业收入及同比增长
表:2014年和睦家医院、诊所数(按地区)
图:2011-2014财年百汇班底营业收入、净利润及净利润率
图:2011-2013财年IHH Healthcare在华营业收入及同比增长
表:百汇班底在华医疗中心及服务
图:2010-2013年凤凰医疗营业收入、净利润及资产负债率
图:2010-2013年凤凰医疗综合性医院服务收入及同比增长
图:2013年凤凰医疗医院管理收入构成(分医院)
图:2009-2014年益佰制药营业收入、净利润及资产负债率
图:2009-2013年益佰制药医疗服务收入及同比增长
图:2009-2014年华润三九营业收入、净利润及资产负债率
图:2009-2013年华润三九医疗服务收入及同比增长
图:2009-2014年康美药业营业收入、净利润及资产负债率
图:2009-2014年模塑科技营业收入、净利润及资产负债率
表:2011-2017年中国医院医疗服务收入(分企业)预测
图:2010-2017年中国医院数量及同比增长预测
图:2010-2017年中国医院行业总收入及同比增长预测
图:2010-2017年中国医院行业总收入预测(按经济类型)
图:2010-2017年中国专科医院数量及其占比预测
图:2010-2017年中国专科医院总收入及同比增长预测
Types and Brief Introduction of Hospitals in China
China Hospital Industry Chain
Number of Hospitals and YoY Growth in China, 2005-2013
Number of Hospitals in China by Grade, 2006-2013
Number of Hospitals in China by Ownership, 2006-2013
Number of Hospitals in China by Management Mode, 2006-2013
Number of Hospitals in China by Institution Nature, 2006-2013
Number of Hospitals in China by Region, Apr 2014
Total Revenue and YoY Growth of China Hospital Industry, 2005-2013
Revenue Structure of Chinese Hospitals by Source of Revenue, 2012
Revenue Structure of China Hospital Industry by Institution Nature, 2008-2013
Average Revenue of China Hospital Industry by Institution Nature, 2008-2013
Average Revenue of Each General Hospital in China, 2005-2013
Average Revenue of Each General Hospital in China by Business, 2008-2013
Makeup Percentage of Drugs of Each General Hospital in China, 2008-2013
Profit Margin of Chinese Hospitals, 2006-2013
Profit Margin of Chinese Hospitals by Institution Nature, 2009-2013
Outpatient Visits of Chinese Hospitals, 2005-2013
Number of Hospital Beds and Utilization of Chinese Hospitals, 2005-2013
Comparison between Chinese Hospitals, Number of Beds and Utilization by Ownership, 2006-2013
Number of Certified Doctors and Registered Nurses of Chinese Hospitals, 2006-2013
Number of Chinese Medical Graduates, 2006-2013
Proportion of Public and Non-Public Hospitals in Various Medical Fields of China, 2012
Number and Proportion of Specialized Hospitals in China, 2006-2013
Constitution of Specialized Hospitals in China by Ownership, 2006-2013
Number of Specialized Hospitals in China by Classification, 2010-2012
Total Revenue and YoY Growth of Specialized Hospitals in China, 2005-2013
Total Revenue of Specialized Hospitals in China, 2010-2012
Profit Margin of Specialized Hospitals in China, 2010-2012
Number of Ophthalmic Hospitals in China, 2006-2012
Revenue and Profit of Ophthalmic Hospitals in China, 2006-2012
Utilization of Hospital Beds and Service Efficiency of Doctors of Chinese Ophthalmic Hospitals, 2006-2012
Number of Chinese Dental Hospitals, 2006-2012
Revenue and Profit of Chinese Dental Hospitals, 2006-2012
Utilization of Hospital Beds and Service Efficiency of Doctors of Chinese Dental Hospitals, 2006-2012
Competition Comparison: TC Medical vs. Jiamei Stomatological vs. ARRAIL Dental
Number of Chinese Plastic Surgery and Cosmetic Hospitals, 2006-2012
Revenue and Profit of Chinese Plastic Surgery and Cosmetic Hospitals, 2006-2012
Number of Chinese Obstetrics and Gynecology Hospitals, 2006-2012
Revenue and Profit of Chinese Obstetrics and Gynecology Hospitals, 2006-2012
Utilization of Hospital Beds and Service Efficiency of Doctors of Chinese Obstetrics and Gynecology Hospitals, 2006-2012
Number of Chinese Children’s Hospitals, 2006-2012
Revenue and Profit of Chinese Children’s Hospitals, 2006-2012
Utilization of Hospital Beds and Service Efficiency of Doctors of Chinese Children’s Hospitals, 2006-2012
Number of Chinese Tumor Hospitals, 2006-2012
Revenue and Profit of Chinese Tumor Hospitals, 2006-2012
Utilization of Hospital Beds and Service Efficiency of Doctors of Chinese Tumor Hospitals, 2006-2012
Composition of China’s Medical Insurance System
Population Coverage of Medical Insurance System in China, 2005-2013
Coverage of China Medical Insurance System, 2005-2013
Per Capita Expenditure of Three Kinds of Medical Insurances in China, 2009-2013
Urbanization Rate of China, 2000-2013
Healthcare Expenditure Structure of China, 2005-2013
Basic Insurances of China’s Urban Workers and Average Per Capita Fundraising of New Rural Cooperative Medical System, 2007-2013
Medical Insurances of China’s Urban Workers and Balance Rate of New Rural Cooperative Medical System, 2005-2013
Favorable Polices on the Construction of County-Level Hospitals, 2009-2014
Influence of In-Depth Urbanization on Medical Service in China, 2015E
Landmark Cases on Social Capitals Flowing to Medical Service Field in China, 1985-2014
Policies Regarding Social Capitals Flowing to Medical Service Field in China, 2009-2014
Policy Differences between Privately-owned Hospitals and Public Hospitals
Entrustment Chain of Public Hospitals in China
Revenue and Market Share of Chinese Public Hospitals, 2008-2013
Profits and Profit Margin of Chinese Public Hospitals, 2008-2013
Revenue and Market Share of Chinese Private Hospitals, 2008-2013
Profits and Profit Margin of Chinese Private Hospitals, 2008-2013
Comparison between Major Specialized Medical Services in China
Marketization Trend of China Medical Service System
Reform Mode of Existing Property Rights System of Public Hospitals in China
Pilot Cases of China’s Social Capitals Contributing to Public Hospital Restructuring, 1999-2014
Co-partners and Major Medical Services of Some Sino-foreign Cooperative Hospitals in China
Co-partners and Major Medical Services of Foreign-led Joint Venture Hospitals in China
Revenue, Net Income and Asset-Liability Ratio of Aier Eye Hospital Group, 2009-2014
Revenue of Aier Eye Hospital Group by Product, 2009-2013
Revenue of Aier Eye Hospital Group by Region, 2009-2013
Gross Margin of Aier Eye Hospital Group by Product, 2009-2014
Revenue and Net Income of Aier Eye Hospital Group, 2014-2017E
Revenue, Net Income and Asset-Liability Ratio of TC Medical, 2009-2014
Revenue of TC Medical by Product, 2009-2014
Revenue of TC Medical by Region, 2009-2014
Gross Margin of TC Medical by Product, 2009-2014
Target Clients of TC Medical
Operation Comparison between Subsidiaries under TC Medical, 2011 vs 2013
Revenue and Net Income of TC Medical, 2014-2017E
Revenue, Net Income and Asset-Liability Ratio of Mayinglong Pharm, 2009-2014
Revenue of Mayinglong Pharm by Product, 2009-2013
Revenue of Mayinglong Pharm by Region, 2009-2013
Gross Margin of Mayinglong Pharm by Product, 2009-2014
Development History of Anorectum Chain Hospitals under Mayinglong Pharm
Establishment Mode and Equity Structure of Anorectum Hospitals under Mayinglong Pharm
Diagnosis & Treatment Revenue and YoY Growth of Hospitals under Mayinglong Pharm, 2009-2013
Comparison: Anorectum Hospitals under Mayinglong Pharm vs. Aier Eye Hospital Group vs. TC Medical
Revenue and Net Income of Mayinglong Pharm, 2014-2017E
Revenue, Net Income and Asset-Liability Ratio of Shanghai Fosun Pharmaceutical, 2009-2014
Revenue of Shanghai Fosun Pharmaceutical by Product, 2009-2013
Revenue of Shanghai Fosun Pharmaceutical by Region, 2009-2013
Gross Margin of Shanghai Fosun Pharmaceutical by Product, 2009-2014
R&D Costs and % of Total Revenue of Shanghai Fosun Pharmaceutical, 2009-2013
Established Regions and Expected Expansion of United Family Hospital, 2014
Medical Service Revenue and YoY Growth of Shanghai Fosun Pharmaceutical, 2011-2013
Revenue and Net Income of Shanghai Fosun Pharmaceutical, 2014-2017E
Revenue, Net Income and Asset-Liability Ratio of Jinling Pharmaceutical , 2009-2014
Revenue of Jinling Pharmaceutical by Product, 2009-2013
Revenue of Jinling Pharmaceutical by Region, 2009-2013
Gross Margin of Jinling Pharmaceutical by Product, 2009-2014
Medical Revenue and YoY Growth of Jinling Pharmaceutical, 2009-2013
Revenue and Net Income of Jinling Pharmaceutical, 2014-2017E
Revenue, Net Income and Asset-Liability Ratio of Shinva Medical, 2009-2014
Revenue of Shinva Medical by Product, 2009-2013
Revenue of Shinva Medical by Region, 2009-2013
Gross Margin of Shinva Medical by Product, 2009-2014
Revenue and Net Income of Shinva Medical, 2014-2017E
Revenue, Net Income and Asset-Liability Ratio of Xi’an Kaiyuan Investment, 2009-2014
Revenue of Xi’an Kaiyuan Investment by Sector, 2009-2013
Revenue of Xi’an Kaiyuan Investment by Region, 2009-2013
Gross Margin of Xi’an Kaiyuan Investment by Product, 2009-2014
Medical Revenue of Xi’an Kaiyuan Investment, 2011-2013
Revenue, Net Income and Net Profit Margin of Xi’an Gaoxin Hospitals, 2011-2013
Revenue and Net Income of Xi'an Kaiyuan Investment, 2014-2017E
Revenue, Net Income and Asset-Liability Ratio of Inner Mongolia Furui Medical Science, 2009-2014
Revenue of Inner Mongolia Furui Medical Science by Product, 2009-2013
Revenue of Inner Mongolia Furui Medical Science by Region, 2009-2013
Gross Margin of Inner Mongolia Furui Medical Science by Product, 2009-2014
Investment and Operating Time of Chain Hospitals under Inner Mongolia Furui Medical Science
Revenue and Net Income of Inner Mongolia Furui Medical Science, 2014-2017E
Revenue, Net Income and Asset-Liability Ratio of Wuhan Jianmin Pharmaceutical, 2009-2014
Revenue and Net Income of Wuhan Jianmin Pharmaceutical, 2009-2014
Revenue of Wuhan Jianmin Pharmaceutical by Product, 2009-2013
Revenue of Wuhan Jianmin Pharmaceutical by Region, 2009-2013
Gross Margin of Wuhan Jianmin Pharmaceutical by Product, 2009-2014
Revenue and Net Income of Wuhan Jianmin Pharmaceutical, 2014-2017E
Revenue and Net Income of CMS, 2009-2014
Revenue of CMS by Product, 2011-2013
Gross Margin of CMS by Product, 2009-2014
Service Network Coverage Regions of CMS
Revenue and Proportion of Hospitals of CMS, 2012-2013
Revenue and YoY Growth of United Family Hospital, 2007-2013
Number of United Family Hospital’s Outlets by Region, 2014
Revenue, Net Income and Net Profit Margin of Parkway Pantai, FY2011-2014
Revenue of IHH Healthcare and YoY Growth in China, FY2011-2013
Medical Treatment Centers and Services of Parkway Pantai in China
Revenue, Net Income and Asset-Liability Ratio of Phoenix Healthcare, 2010-2013
Service Revenue and YoY Growth of General Hospitals under Phoenix Healthcare, 2010-2013
Hospital Management Revenue Structure (by Hospital) of Phoenix Healthcare, 2013
Revenue, Net Income and Asset-Liability Ratio of Yibai Pharmaceutical, 2009-2014
Medical Service Revenue and YoY Growth of Yibai Pharmaceutical, 2009-2013
Revenue, Net Income and Asset-Liability Ratio of China Resources Sanjiu, 2009-2014
Medical Service Revenue and YoY Growth of China Resources Sanjiu, 2009-2013
Revenue, Net Income and Asset-Liability Ratio of Kangmei Pharmaceutical, 2009-2014
Revenue, Net Income and Asset-Liability Ratio of Jiangnan Mould & Plastic Technology, 2009-2014
Medical Service Revenue of Chinese Hospitals (by Enterprise), 2011-2017E
Number and YoY Growth of Chinese Hospitals, 2010-2017E
Total Revenue and YoY Growth of Chinese Hospital Industry, 2010-2017E
Total Revenue of Chinese Hospital Industry by Ownership, 2010-2017E
Number and Proportion of Chinese Specialized Hospitals, 2010-2017E
Total Revenue and YoY Growth of Chinese Specialized Hospitals, 2010-2017E
如果这份报告不能满足您的要求,我们还可以为您定制报告,请 留言说明您的详细需求。
|