|
|
|
报告导航:研究报告—
TMT产业—电子半导体
|
|
2013-2014年全球及中国IC先进封装设备行业研究报告 |
 |
字数:1.8万 |
页数:130 |
图表数:170 |
|
中文电子版:8500元 |
中文纸版:4250元 |
中文(电子+纸)版:9000元 |
|
英文电子版:2300美元 |
英文纸版:2500美元 |
英文(电子+纸)版:2600美元 |
|
编号:ZYW181
|
发布日期:2014-08 |
附件:下载 |
 |
|
|
《2013-2014年全球及中国IC先进封装设备行业研究报告》包含以下内容:
1、半导体产业概况
2、内存与晶圆代工行业现状
3、半导体下游市场分析
4、新兴先进封装技术趋势
5、封装设备行业分析与排名
6、15家先进封装设备厂家研究
封装设备可以分Wafer Level和Die Level两大类型,通常Wafer Level Packaging计算在Wafer设备里,因为其设备在Wafer制造过程中也有使用。Wafer Level Packaging主要应用在5个领域,分别是Analog &Mixed Signal(包括IPD、PA、PMU、Local Power、IC Driver、Audio&Video)、Wireless Connectivity(包括Bluetooth+FM+WLAN Combo、GPS Single Chip)、Optoelectronic(包括CIS、AL Sensor)、MEMS&Sensor(包括Accelerometers、Gyroscope、RF-MEMS、Pressure Sensor、Fingerprint Sensor),最后还有Misc Logic and Memory(包括Logic gate 、EEPROMs)。这些大多是Fan-in设计,引脚(Pin)数量通常低于20。
未来WLCSP要扩大应用范围,必须采用Fan-out设计,不过目前Fan-out设计不够成熟。Fan-in设计限制了Wafer Level Packaging的应用范围,其市场目前来看缺乏潜力,当然如果Fan-out设计成熟,WLCSP将迎来新发展。
Wafer Level Packaging设备包括Process Tool (主要是CVD或PVD、Etching 、Sputtering)、Packaging Lithography、Contact Probers、Packaging Inspection。其中Process Tool领域主要厂家是Applied Material(包括被收购的NEXX)、ULVAC。Packaging Lithography领域主要厂家是Ultratech、SUSS、EV Group。Contact Probers领域主要是Tokyo Seimitsu和Tokyo Electron(已被Applied Material收购)。Packaging Inspection领域主要是Rudolph、Camtek、KLA-TENCOR。2014年Wafer Packaging Level设备市场规模大约13亿美元。
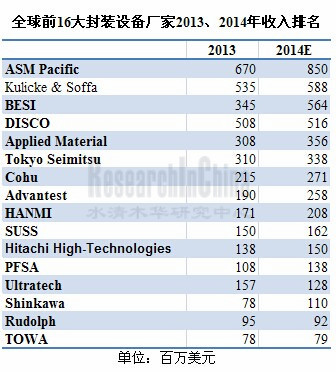
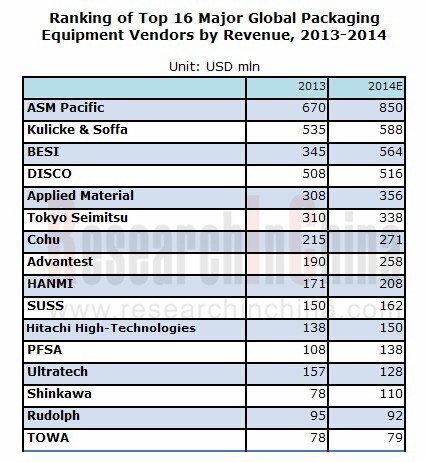
Die Packaging Level设备主要包括Wire Bonder(主要厂家Kulicke & Soffa、ASM Pacific、Shinkawa)、Die Bonder(主要厂家ASM Pacific、Hitachi High-Technologies、BESI、Canon)、Flip-chip Bonder(主要厂家PFSA、BESI、ASM Pacific、Toray Engineering、Hanmi)、Test Handler(主要厂家Delta Design、Advantest、Epson、Tesec)、Wafer Dicing Saws(主要厂家DISCO、Tokyo Seimitsu)、Molding / Encapsulation(主要厂家Towa、BESI、Dai-ichi Seiko)、Package singulation(主要厂家Hanmi、ASM Pacific、DISCO)。
半导体设备是周期性明显的行业,2001-2007年期间处于上升期,2008和2009年连续暴跌,2010年大涨超过100%,之后从2011年开始连续3年下滑,2014年迎来爆发。预计2014年Die Packaging Level设备市场规模大增20%达到41亿美元,2015年达43亿美元,2016年再进入下降通道。主要增长点在Die Bonder、Flip-chip Bonder、Test Handler。
Global and China IC Advanced Packaging Equipment Industry Report, 2013-2014 mainly deals with the followings:
1. Overview of semiconductor industry
2. Status quo of memory and wafer foundry industry
3. Downstream market of semiconductor industry
4. Trend in emerging advanced packaging technology
5. Packaging equipment industry analysis and ranking
6. 15 major advanced packaging equipment vendors
Packaging equipment can fall into two categories: wafer level and die level. And the former is typically included in wafer equipment as it is used in the manufacturing of wafer. Wafer level packaging is primarily used in the following 5 fields, namely, Analog & Mixed Signal (including IPD, PA, PMU, Local Power, IC Driver, and Audio & Video), Wireless Connectivity (including Bluetooth+FM+WLAN Combo and GPS Single Chip), Optoelectronic (including CIS, AL Sensor), MEMS & Sensor (including Accelerometers, Gyroscope, RF-MEMS, Pressure Sensor, and Fingerprint Sensor), as well as Misc Logic and Memory (covering Logic gate and EEPROMs). And these applications mostly adopt the Fan-in design, with the number of Pin usually less than 20.
In future, WLCSP will be required to follow the Fan-out design to expand its applications. However, the current Fan-out design, which is not mature, restricts the application of wafer level packaging, leaving an untapped market potential for now. But if the Fan-out design is mature, WLCSP will embark on a new development stage.
Wafer level packaging equipment consists of Process Tool (mainly including CVD and PVD, Etching, Sputtering), Packaging Lithography, Contact Probers, and Packaging Inspection. Among them, the main vendors of Process Tool are Applied Material (including the acquired NEXX) and ULVAC; the major companies in Packaging Lithography field are Ultratech, SUSS, and EV Group; the companies involved in Contact Probers are represented by Tokyo Seimitsu and Tokyo Electron(already acquired by Applied Material); the companies engaging in Packaging Inspection principally include Rudolph, Camtek, and KLA-TENCOR. In 2014, the market size of wafer packaging level equipment will be very likely to reach approximately USD1.3 billion.
Die packaging level equipment mainly involves Wire Bonder (main vendors are Kulicke & Soffa, ASM Pacific, and Shinkawa), Die Bonder (represented by ASM Pacific, Hitachi High Technologies, BESI, and Canon), Flip chip Bonder (typical vendors cover PFSA, BESI, ASM Pacific, Toray Engineering, and Hanmi), Test Handler (Delta Design, Advantest, Epson, and Tesec serve as the major players), Wafer Dicing Saws (players include DISCO and Tokyo Seimitsu), Molding/Encapsulation (Towa, BESI, Dai-ichi Seiko are the typical vendors), and Package singulation (Hanmi, ASM Pacific, and DISCO play the main role).
With obvious periodicity, semiconductor devices saw a rise during 2001-2007 but a slump in 2008-2009, while fiercely surged by 100% in 2011, then declined for 3 consecutive years from 2011. And in 2014, they will witness an explosive growth, with the estimated market size of die packaging level equipment rising significantly by 20% to USD4.1 billion. And this figure is projected to climb to USD4.3 billion in 2015 and then begin to fall in 2016. The major growth engine would be Die Bonder, Flip-chip Bonder, and Test Handler.
第一章、全球半导体产业
1.1、全球半导体产业概况
1.2、半导体产业供应链
1.3、半导体封装简介
第二章、IC封装行业上下游分析
2.1、半导体产业地域格局
2.2、半导体产业支出趋势
2.3、DRAM内存产业
2.3.1、DRAM内存产业现状
2.3.2、DRAM内存厂家市场占有率
2.3.3、移动DRAM内存厂家市场占有率
2.4、NAND闪存
2.5、晶圆代工产业
2.6、晶圆代工行业竞争分析
2.7、晶圆代工产业排名
2.8、手机市场
2.9、PC市场
2.10、平板电脑市场
2.11、FPGA与CPLD市场
第三章、封测技术趋势
3.1、WIDE IO/HMC MEMORY
3.2、EMBEDDED COMPONENT SUBSTRATE
3.3、EMBEDDED TRACE SUBSTRATE
3.4、手持设备IC封装 IC PACKAGING FOR HANDSET
3.4.1、手持设备IC封装现状
3.4.2、POP封装
3.4.3、FOWLP
3.5、SIP封装
3.5.1、MURATA
3.5.2、环隆电气USI
3.6、2.5D封装(SI/GLASS/ORGANIC INTERPOSER)
3.6.1、2.5D封装简介
3.6.2、2.5D封装应用
3.6.3、2.5D INTERPOSER市场规模
3.6.4、2.5D 封装供应商
3.7、TSV(3D)封装
3.7.1、TSV封装设备
第四章、封装设备产业分析
4.1、封测产业规模
4.2、MIDDLE-END中段封测产业
4.3、封装设备市场规模
4.4、封装设备市场占有率
4.5、封装设备厂家排名
第五章、封装设备厂家研究
5.1、ASM PACIFIC
5.2、KULICKE & SOFFA
5.3、BESI
5.4、ADVANTEST
5.5、HITACHI HIGH-TECHNOLOGIES
5.6、TERADYNE
5.7、DISCO
5.8、TOWA
5.9、HANMI
5.10、PFSA
5.11、SUSS MICROTEC
5.12、COHU SEMICONDUCTOR EQUIPMENT GROUP
5.13、SHINKAWA
5.14、TOKYO SEIMITSU
5.15、ULTRATECH
1. Global Semiconductor Industry
1.1 Overview
1.2 Supply Chain
1.3 Semiconductor Packaging Introduction
2. Upstream & Downstream of IC Packaging Industry
2.1 Semiconductor Industry by Location
2.2 Semiconductor Industry Capital Spending Trend
2.3 DRAM memory Industry
2.3.1 Status Quo
2.3.2 Market Share of DRAM memory Vendors
2.3.3 Market Share of Mobile DRAM memory Vendors
2.4 NAND Flash
2.5 Wafer Foundry Industry
2.6 Wafer Foundry Competition
2.7 Ranking in Wafer Foundry Industry
2.8 Mobile Phone Market
2.9 PC Market
2.10 Tablet PC Market
2.11 FPGA and CPLD Market
3. Packaging & Testing Technology Trend
3.1 Wide IO/HMC Memory
3.2 Embedded Component Substrate
3.3 Embedded Trace Substrate
3.4 IC Packaging for Handset
3.4.1 Status Quo
3.4.2 PoP Packaging
3.4.3 FOWLP
3.5 SIP Packaging
3.5.1 Murata
3.5.2 USI (Taiwan)
3.6 2.5D Packaging (SI/GLASS/ORGANIC INTERPOSER)
3.6.1 Introduction
3.6.2 Application
3.6.3 2.5D Interposer Market Size
3.6.4 Suppliers
3.7 TSV (3D) Packaging
3.7.1 Equipment
4. Packaging Equipment Industry
4.1 Market Size of Packaging &Testing Industry
4.2 Middle-end Packaging &Testing Industry
4.3 Market Size of Packaging Equipment
4.4 Market Share of Packaging Equipment
4.5 Ranking of Packaging Equipment Vendors
5. Packaging Equipment Vendors
5.1 ASM PACIFIC
5.2 KULICKE & SOFFA
5.3 BESI
5.4 ADVANTEST
5.5 HITACHI HIGH-TECHNOLOGIES
5.6 TERADYNE
5.7 DISCO
5.8 TOWA
5.9 HANMI
5.10 PFSA
5.11 SUSS MICROTEC
5.12 GROUP
5.13 SHINKAWA
5.14 TOKYO SEIMITSU
5.15 ULTRATECH
1990-2014 Semiconductor Industry Growth versus Worldwide GDP Growth
2012-2014年全球半导体产业季度收入
2012-2018年全球半导体市场产品分布
Semiconductor Outsourced Supply Chain
Semiconductor Company Systems
Semiconductor Outsourced Supply Chain Example
1Q14 Top25 Semiconductor Sales Leaders
1990-2013 Worldwide IC Sales by Company Headquarters Location
2013 Fabless IC Sales Marketshare by Company Headquarters Location(77.9B)
2008-2013 Top 10 IC Manufacturers in China
2011-2014F Top 10 Spenders Capital Spending Outlook
1994-2013 Top 5 Share of Total Semiconductor Capital Spending
1Q14-WW-Semiconductor-CapitalSpending-Share-of-FullZYear-Budget
2008-2016年全球DRAM与NAND市场规模
1Q/12-4Q/14 DRAM supply/demand
2005-2015年DRAM产业CAPEX
2012-2014 DDR3 4Gb ASP
2012-2014 NAND MLC 32Gb ASP
2Q13-1Q14 Revenue Ranking for Branded DRAM Vendor
Q1/07-Q1/14 DRAM Market Share
2009-2011年Mobile DRAM 市场份额
2012年Mobile DRAM 市场份额
2Q13-1Q14 Revenue Ranking for Branded Mobile DRAM Vendor
2012 年 品牌(Brandbed)NAND Flash厂家市场份额
2014年1季度品牌(Brandbed)NAND Flash厂家市场份额
1Q12-4Q14 NAND Supply/Demand
NAND tech migration roadmap
2008-2017年全球Foundry市场规模
2012-2017 Foundry Revenue of Advanced Nodes
2012-2018 Global Foundry capacity by node
2012-2018 Global Foundry revenue by node
Global ranking by foundry
2008-2016年平均每部手机IC成本
2007-2015年全球手机出货量
Worldwide Smartphone Sales to End Users by Vendor in 2013 (Thousands of Units)
Worldwide Smartphone Sales to End Users by Operating System in 2013 (Thousands of Units)
Worldwide Mobile Phone Sales to End Users by Vendor in 2013 (Thousands of Units)
2008-2015年全球PC用CPU与Discrete GPU 出货量
2008-2015年笔记本电脑出货量
2010-2013年全球主要笔记本电脑ODM厂家出货量
2011-2016年全球平板电脑出货量
2013年平板电脑主要品牌市场占有率
2012、2013年全球平板电脑制造厂家产量
2011年FPGA、CPLD市场下游分布与地域分布
1999-2013年主要FPGA厂家市场占有率
Mobile DRAM Trend
WIDE IO的优点
SK Hynix WIDE IO2 Roadmap
HMC Architecture
HMC BENEFITS
Advantages of Embedded Passive/Active Substrate
Embedded Component Substrate Process
Comparison of Embedded Active & Passive Components
Roadmap of Embedded Passive Substrate
Structure Roadmap of Embedded Active Substrate
FOWLP and PLP Process Comparison
WHY EMBEDDED TRACE?
EMBEDDED TRACE Package Features
EMBEDDED TRACE Package Sweet Spot (for Wire Bonding)
EMBEDDED TRACE Package Sweet Spot (for FLIP CHIP)
Apple iPad 4 LTE A1459 IC Package Type List
PoP封装发展趋势
2014年SiP封装主要厂家市场占有率
FY2009-FY2014 Murata Sales and Operation Margin
FY2009-FY2014 Murata Sales by region
2011年1季度-2014年2季度Murata收入、新订单与Backlog
2011年1季度-2014年2季度Murata运营利润、净利润
2011年1季度-2014年2季度Murata Order by Product
FY2010-FY2014 Murata Sales by Product
FY2010-FY2014 Murata Sales by Application
2008-2014年环隆电气收入与毛利率
2013年1季度-2014年2季度环隆电气季度收入与毛利率
2013年1季度-2014年2季度环隆电气季度收入产品分布
2008-2014年环旭电子收入与营业利润率
2011-2013年环旭电子收入下游分布
2011-2013年环旭电子各项产品产量
2.5D Interposer Manffacturing Revenue
2010-2017 Breakdown by interposer bulk material
TSV下游应用
TSV设备供应商
2012-2017年TSV封装设备分布
2006-2015年OSAT市场规模
1990-2020 Share of IC Package Value Add
2011\2016 全球IC封装类型出货量分布
Middle-End中段封测产业 Process
2007-2016 Die Packaging Level设备市场规模
2010年1季度-2014年2季度Semi Equipment Book-to-bill
2013、2014年Die Packaging Level设备产品分布
2014 Wire Bonder Vendor Market Share
2014 Flip-chip Bonder Vendor Market Share
2014 Die Bonder Vendor Market Share
2014 Test Handler Vendor Market Share
ASM分支结构
ASM太平洋产品线
2009-2014 ASM Pacific收入与税前利润
2009-2013 ASM Pacific Assets与Liabilities
2012-2013年ASM Pacific收入业务分布
ASM Pacific Quarterly sales trend by Business
2012-2013年 ASM Pacific EBIT业务分布
2007-2014 ASM Pacific book-to-bill
2012-2013年 ASM Pacific收入地域分布
2011-2013 ASM Pacific收入产品分布
1993-2015 ASM Pacific capex/sales
2007-2014财年Kulicke & Soffa收入与运营利润率
2011-2013财年Kulicke & Soffa前10大客户
Kulicke & Soffa全球分布
2011年2季度-2014年2季度Kulicke & Soffa收入
2011年2季度-2014年2季度Kulicke & Soffa营业利润率
2011年2季度-2014年2季度Kulicke & Soffa R&D 支出
2009-2018年Wire Bonder Equipment Market
2012-2018 Copper Bonder Unit
BESI Organization
2009-2014 BESI Revenue and Orders
2009-2014 BESI Revenue \Operation Margin\Net Margin
1Q12-2Q14 BESI Quarterly Revenue and Orders
1Q12-2Q14 BESI Quarterly Revenue and Net Margin
BESI Milestone
1Q12-2Q14 BESI Quarterly Expense
1Q12-2Q14 BESI Quarterly Headcount
1Q12-2Q14 BESI Quarterly Cash and Debt
2013 BESI Market Share
2013 BESI Revenue Breakdown by Product
BESI Product Position
BESI Product
BESI Global Operation
2012年2季度-2014年2季度Advantest收入与毛利率
2012年2季度-2014年2季度Advantest新订单额
FY2013-Q1/FY2015 Advantest Order by business
FY2013-Q1/FY2015 Advantest Order by Region
FY2013-Q1/FY2015 Advantest Sales by Business
FY2013-Q1/FY2015 Advantest Sales by Region
2013年3季度-2014年2季度Advantest 资产负债
2007-2015财年Hitachi High-Technologies收入与运营利润率
2011-2015财年Hitachi High-Technologies收入部门分布
2011-2014财年Hitachi High-Technologies运营利润部门分布
2013-2015财年Hitachi High-Technologies Electronic Device Systems收入业务分布
2014-2015财年Hitachi High-Technologies Electronic Device Systems Front-end 收入Field 分布
2006-2014年Teradyne收入与营业利润率
2011-2013 Teradyne Net revenues by country as a percentage of total revenues
2011-2014 Teradyne收入产品分布
DISCO Organization Chart
FY2010-FY2015 DISCO收入与营业利润
Q1/FY2005-Q4/FY2013 DISCO Quarterly Consolidated Financial Results
Q1/FY2005-Q4/FY2013 DISCO Quarterly Sales/Orders
Q1/FY2010-Q4/FY2013 DISCO Quarterly Sales Breakdown by Product
Q4/FY2013 Product and Equipment Sales Breakdown
FY2012-FY2013 DISCO Equipment, Non-consolidated Cutting and Dicing Saws Sales Breakdown by Application
FY2012-FY2013 DISCO Equipment, Non-consolidated Grinders and Polishers Sales Breakdown by Application
FY2012-FY2013 DISCO Consolidated Sales Breakdown by Region
FY2000-FY2014 DISCO Consolidated R&D/CAPEX Forecast
Towa Organization Chart
FY2010-FY2015 TOWA收入与营业利润
FY2011-FY2014 TOWA 收入产品分布
FY2011-FY2014 TOWA 订单产品分布
FY2011-FY2014 TOWA 收入低于分布
2010-2014 Hanmi收入与营业利润率
2007-2015Hanmi收入产品分布
2008-2014 SUSS MicroTec销售额与EBITDA率
2008-2014 SUSS MicroTec 订单额
2014年H1 SUSS Sales and Order By Segment
2014年H1 SUSS Sales and Order By Region
2008-2014 Cohu收入与营业利润率
2008-2014 Cohu收入产品分布
2011-2013 Cohu Semiconductor equipment收入产品分布
FY2009-FY2015 Shinkawa收入与营业利润
FY2011-FY2014 Shinkawa收入产品分布
FY2011-FY2014 Shinkawa收入地域分布
FY2009-FY2015 Tokyo Seimitsu收入与营业利润
FY2012-FY2015 Tokyo Seimitsu收入产品分布
Q1/FY2010-Q1/FY2015 Tokyo Seimitsu Semiconductor Equipment Quarterly Sales
Q1/FY2010-Q1/FY2015 Tokyo Seimitsu Semiconductor Equipment Quarterly Order
2009-2014 Ultratech收入与营业利润率
2011-2013 Ultratech收入产品分布
Semiconductor Industry Growth versus Worldwide GDP Growth, 1990-2014
Quarterly Revenue of Global Semiconductor Industry, 2012-2014
Breakdown of Global Semiconductor Market by Product, 2012-2018E
Semiconductor Outsourced Supply Chain
Semiconductor Company Systems
Semiconductor Outsourced Supply Chain Example
Top 25 Semiconductor Sales Leaders, 1Q2014
Worldwide IC Sales by Company Headquarters Location, 1990-2013
Fabless IC Sales Market Share by Company Headquarters Location (77.9B), 2013
Top 10 IC Manufacturers in China, 2008-2013
Top 10 Spenders Capital Spending Outlook, 2011-2014F
Top 5 Share of Total Semiconductor Capital Spending, 1994-2013
Worldwide Semiconductor Capital Spending Share of Full Year Budget, 1Q2014
Market Size of Global DRAM and NAND, 2008-2016E
DRAM Supply/Demand, 1Q2012-4Q2014
CAPEX of DRAM Industry, 2005-2015E
ASP of 4Gb DDR3, 2012-2014
ASP of 32Gb MLC NAND, 2012-2014
Ranking of Branded DRAM Vendors by Revenue, 2Q2013-1Q2014
Market Share of DRAM, Q12007-Q12014
Market Share of Mobile DRAM, 2009-2011
Market Share of Mobile DRAM, 2012
Ranking of Branded Mobile DRAM Vendors by Revenue, 2Q2013-1Q2014
Market Share of Branded NAND Flash Vendors, 2012
Market Share of Branded NAND Flash Vendors, 2014Q1
NAND Supply/Demand, 1Q2012-4Q2014
NAND Tech Migration Roadmap
Market Size of Global Foundry, 2008-2017E
Foundry Revenue of Advanced Nodes, 2012-2017E
Global Foundry Capacity by Node, 2012-2018E
Global Foundry Revenue by Node, 2012-2018E
Global Ranking by Foundry
Average IC Costs of Each Mobile Phone, 2008-2016E
Shipments of Global Mobile Phones, 2007-2015E
Worldwide Smartphone Sales to End Users by Vendor in 2013
Worldwide Smartphone Sales to End Users by Operating System, 2013
Worldwide Mobile Phone Sales to End Users by Vendor, 2013
Shipments of Global CPU and Discrete GPU for PC, 2008-2015E
Shipments of NB PC, 2008-2015E
Shipments of Global NB PC ODM Vendors, 2010-2013
Shipments of Global Tablet PC, 2011-2016E
Market Share of Major Tablet PC Brands, 2013
Output of Global Tablet PC Vendors, 2012-2013
MFPGA and CPLD Markets by Application and by Region, 2011
Market Share of Major FPGA Vendors, 1999-2013
Mobile DRAM Trend
Strengths of WIDE IO
SK Hynix WIDE IO2 Roadmap
HMC Architecture
HMC BENEFITS
Advantages of Embedded Passive/Active Substrate
Embedded Component Substrate Process
Comparison of Embedded Active & Passive Components
Roadmap of Embedded Passive Substrate
Structure Roadmap of Embedded Active Substrate
FOWLP and PLP Process Comparison
WHY Embedded Trace?
Embedded Trace Package Features
Embedded Trace Package Sweet Spot (for Wire Bonding)
Embedded Trace Package Sweet Spot (for FLIP CHIP)
Apple iPad 4 LTE A1459 IC Package Type List
Trend in PoP Packaging
Market Share of Major SiP Packaging Vendors, 2014
Sales and Operation Margin of Murata, FY 2009-FY 2014
Sales of Murata by Region, FY 2009-FY 2014
Revenue, New Orders and Backlog of Murata, 2011Q1-2014Q2
Operating Income and Net Income of Murata, 2011Q1-2014Q2
Order of Murata by Product, 2011Q1-2014Q2
Sales of Murata by Product, FY 2010-FY 2014
Murata Sales by Application, FY 2010-FY 2014
Revenue and Gross Margin of USI (Taiwan), 2008-2014
Quarterly Revenue and Gross Margin of USI (Taiwan), 2013Q1-2014Q2
Quarterly Revenue Breakdown of USI (Taiwan) by Product, 2013Q1-2014Q2
Revenue and Operating Income of USI (Shanghai), 2008-2014
Revenue Breakdown of USI (Shanghai) by Downstream, 2011-2013
Output of Various Products of USI (Shanghai), 2011-2013
2.5D Interposer Manufacturing Revenue
Breakdown by Interposer Bulk Material, 2010-2017E
TSV Downstream Application
TSV Equipment Suppliers
TSV Packaging Equipment Distribution, 2012-2017E
OSAT Market Size, 2006-2015E
Share of IC Package Added Value, 1990-2020E
Global IC Packaging Shipment by Type, 2011\2016E
Middle-End Packaging & Testing Process
Market Size of Die Level Packaging Equipment, 2007-2016E
Semi Equipment Book-to-bill, 2010Q1-2014Q2
Breakdown of Die Packaging Level Equipment by Product, 2013-2014
Wire Bonder Vendor Market Share, 2014
Flip-chip Bonder Vendor Market Share, 2014
Die Bonder Vendor Market Share, 2014
Test Handler Vendor Market Share, 2014
Branches of ASM
Product Line of ASM Pacific
Revenue and EBT of ASM Pacific, 2009-2014
Assets and Liabilities of ASM Pacific, 2009-2013
Revenue Breakdown of ASM Pacific by Business, 2012-2013
Quarterly sales trend by Business of ASM Pacific, 2007-2014E
EBIT Breakdown of ASM Pacific by Business, 2012-2013
Book-to-bill of ASM Pacific, 2007-2014
Revenue Breakdown of ASM Pacific by Region, 2012-2013
Revenue Breakdown of ASM Pacific by Product, 2011-2013
Capex/Sales of ASM Pacific, 1993-2015E
Revenue and Operating Margin of Kulicke & Soffa, FY 2007-FY 2014
Top 10 Clients of Kulicke & Soffa, FY 2011-FY 2013
Global Distribution of Kulicke & Soffa
Revenue of Kulicke & Soffa, 2011Q2-2014Q2
Operating Margin of Kulicke & Soffa, 2011Q2-2014Q2
R&D Costs of Kulicke & Soffa, 2011Q2-2014Q2
Wire Bonder Equipment Market, 2009-2018E
Copper Bonder Unit, 2012-2018E
BESI Organization
Revenue and Orders of BESI, 2009-2014
Revenue \Operation Margin\Net Margin of BESI, 2009-2014
Quarterly Revenue and Orders of BESI, 1Q2012-2Q2014
Quarterly Revenue and Net Margin of BESI, 1Q2012-2Q2014
Milestone of BESI
Quarterly Expense of BESI, 1Q12-2Q14
Quarterly Headcount of BESI, 1Q12-2Q14
Quarterly Cash and Debt of BESI, 1Q12-2Q14
Market Share of BESI, 2013
Revenue Breakdown of BESI by Product, 2013
BESI’s Product Position
BESI’s Products
BESI’s Global Operation
Revenue and Gross Margin of Advantest, 2Q12-2Q14
New Orders of Advantest, 2Q12-2Q14
Advantest Order by Business, FY 2013-Q1/FY 2015
Advantest Order by Region, FY 2013-Q1/FY 2015
Sales of Advantest by Business, FY 2013-Q1/FY 2015
Sales of Advantest by Region, FY 2013-Q1/FY 2015
Assets and Liabilities of Advantest, 2013Q3-2014Q2
Revenue and Operation Margin of Hitachi High-Technologies, FY 2007-FY 2015
Revenue Breakdown of Hitachi High-Technologies by Segment, FY 2011-FY 2015
Operation Margin Breakdown of Hitachi High-Technologies by Segment, FY 2011-FY 2014
Revenue Breakdown of Hitachi High-Technologies’ Electronic Device Systems by Business, FY 2013-FY 2015
Front-end Revenue Breakdown of Hitachi High-Technologies’ Electronic Device Systems by Field, FY 2014-FY 2015
Revenue and Operating Income of Teradyne, 2006-2014
Net Revenue of Teradyne by Country and % of Total Revenue, 2011-2013
Revenue Breakdown of Teradyne by Product, 2011-2014
Organization Chart of DISCO
Revenue and Operating Income of DISCO, FY 2010-FY 2015
Quarterly Consolidated Financial Results of DISCO, Q1/FY 2005-Q4/FY 2013
Quarterly Sales/Orders of DISCO, Q1/FY 2005-Q4/FY 2013
Quarterly Sales Breakdown of DISCO by Product, Q1/FY 2010-Q4/FY 2013
Product and Equipment Sales Breakdown, Q4/FY 2013
Equipment, Non-consolidated Cutting and Dicing Saws Sales Breakdown of DISCO by Application, FY 2012-FY 2013
Equipment, Non-consolidated Grinders and Polishers Sales Breakdown of DISCO by Application, FY 2012-FY 2013
Consolidated Sales Breakdown of DISCO by Region, FY 2012-FY 2013
Consolidated R&D/CAPEX Forecast of DISCO, FY 2000-FY 2014
Organization Chart of Towa
Revenue and Operating Income of TOWA, FY 2010-FY 2015
Revenue Breakdown of TOWA by Product, FY 2011-FY 2014
Orders Breakdown of TOWA by Product, FY 2011-FY 2014
Revenue Breakdown of TOWA by Region, FY 2011-FY 2014
Revenue and Operating Margin of Hanmi, 2010-2014
Revenue Breakdown of Hanmi by Product, 2007-2015E
Sales and EBITDA Margin of SUSS MicroTec, 2008-2014
Orders of SUSS MicroTec, 2008-2014
Sales and Orders of SUSS by Segment, 2014H1
Sales and Orders of SUSS by Region, 2014H1
Revenue and Operating Margin of Cohu, 2008-2014
Revenue Breakdown of Cohu by Product, 2008-2014
Revenue Breakdown of Cohu Semiconductor Equipment by Product, 2011-2013
Revenue and Operating Income of Shinkawa, FY 2009-FY 2015
Revenue Breakdown of Shinkawa by Product, FY 2011-FY 2014
Revenue Breakdown of Shinkawa by Region, FY 2011-FY 2014
Revenue and Operating Income of Tokyo Seimitsu, FY 2009-FY 2015
Revenue Breakdown of Tokyo Seimitsu by Product, FY 2012-FY 2015
Quarterly Sales of Tokyo Seimitsu’s Semiconductor Equipment, Q1/FY 2010-Q1/FY 2015
Quarterly Order of Tokyo Seimitsu’s Semiconductor Equipment, Q1/FY 2010-Q1/FY 2015
Revenue and Operating Margin of Ultratech, 2009-2014
Revenue Breakdown of Ultratech by Product, 2011-2013
如果这份报告不能满足您的要求,我们还可以为您定制报告,请 留言说明您的详细需求。
|