|
|
|
报告导航:研究报告—
制造业—化工
|
|
2014-2017年中国苯乙烯产业链研究报告 |
 |
字数:2.4万 |
页数:105 |
图表数:154 |
|
中文电子版:7500元 |
中文纸版:3750元 |
中文(电子+纸)版:8000元 |
|
英文电子版:2250美元 |
英文纸版:2400美元 |
英文(电子+纸)版:2550美元 |
|
编号:HK048
|
发布日期:2014-08 |
附件:下载 |
 |
|
|
苯乙烯是聚合物的重要单体。2013年,全球苯乙烯总产能约达到3310万吨,主要分布于东北亚、北美和西欧地区。其中,中国苯乙烯产能居全球首位,占比达21.4%。
苯乙烯主要用于生产发泡性聚苯乙烯(EPS)、通用性聚苯乙烯GPPS、高抗冲聚苯乙烯HIPS、丙烯腈-丁二烯-苯乙烯共聚物(ABS)、丁苯橡胶(SBR)等,2013年中国EPS、GPPS、HIPS和ABS对苯乙烯的需求量占比之和为75%左右。
1、 EPS
中国EPS产能有过剩趋势,2013年产量为368万吨,约8%用于出口。国内市场主要由台湾见龙机构(中国大陆子公司)和无锡兴达泡塑新材料股份有限公司占据,2013年二者产能占比之和约达43%。
2、 ABS
中国ABS市场发展较快,2013年产量达129.7万吨,对外依存度高达55.8%,未来增长空间较大。2013年,中国ABS主要生产企业仅有11家,宁波LG甬兴化工有限公司和镇江奇美化工有限公司产能排名前两位,产能占比之和约达45%。
2013年,中国苯乙烯表观消费量达895.2万吨,自给率为59.5%,仍有一定的进口替代空间。此外,建筑保温、汽车等行业较快发展也将拉动EPS、GPPS、HIPS、ABS等消费量的增长,从而促进苯乙烯需求的增加。
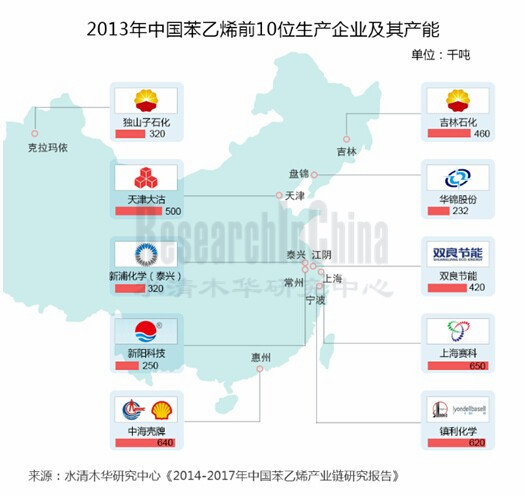
2013年,中国苯乙烯生产企业主要为中石化和中石油旗下子公司,二者苯乙烯产能占比之和达50%左右。其中产能最大的为上海赛科石油化工有限责任公司(中石化与BP合资公司),苯乙烯产能达65万吨/年。
水清木华研究中心《2014-2017年中国苯乙烯产业链研究报告》主要包括以下几个内容:
 全球苯乙烯产能及分布等; 全球苯乙烯产能及分布等;
中国苯乙烯市场供需、进出口、竞争格局、价格分析及2014-2017年发展预测等;
中国苯乙烯上游-纯苯、乙烯的市场供需、进出口、竞争格局、价格分析等;
中国苯乙烯下游--EPS、GPPS、HIPS、ABS、SAN、SBR的市场供需、进出口、竞争格局、价格分析等;
中国11家苯乙烯及其下游产品生产企业的经营分析、苯乙烯业务、发展及预测等。
Styrene is an important monomer of a polymer. Global styrene capacity totaled 33.10 million tons in 2013, mainly distributed in Northeast Asia, North America and Western Europe. China boasts the largest styrene capacity with a share of 21.4% in the world.
Styrene is used predominately in the production of expanded polystyrene (EPS), general purpose polystyrene (GPPS), high impact polystyrene (HIPS), acrylonitrile-butadiene-styrene copolymer (ABS) and styrene-butadiene rubber (SBR). China’s demand for styrene from EPS, GPPS, HIPS and ABS together accounted for about 75% of total amount in 2013.
1. EPS
China now is seeing a trend of overcapacity in EPS, whose output in 2013 was 3.68 million tons, with about 8% for export. Domestic EPS market is dominated by Taiwanese Loyal Group through its subsidiaries in Mainland China and Wuxi Xingda New Foam Plastics Materials Co., Ltd., which together held 43% of total EPS capacity in China in 2013.
2. ABS
China’s ABS market develops rapidly, with output amounting to 1.297 million tons in 2013 but 55.8% of demand depending on imports, showing vast room for future development. In 2013, there were only 11 major ABS producers in China, of which Ningbo LG Yongxing Chemical Co. Ltd. and Zhenjiang Chimei Chemical Co., Ltd. were the top two with a combined capacity share of 45%.
China’s apparent consumption of styrene in 2013 was 8.952 million tons, 59.5% of which were self-produced, presenting a certain space for import substitution. In addition, rapid development of building insulation, automobile and other sectors fueled the consumption growth of EPS, GPPS, HIPS and ABS, thus bolstering the demand for styrene.
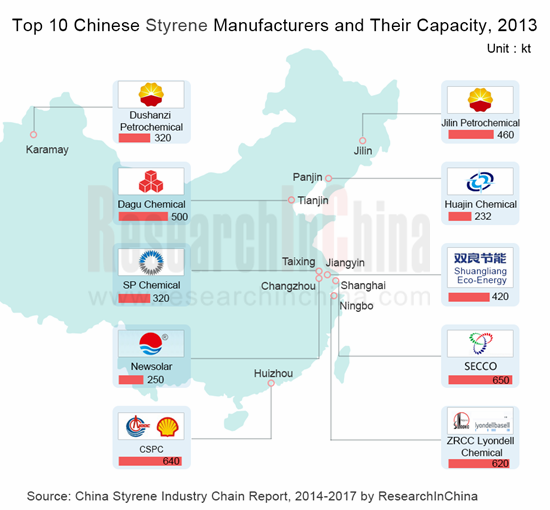
In 2013, major domestic styrene producers were subsidiaries under Sinopec and PetroChina, together occupying roughly 50% of total styrene capacity, of which Shanghai SECCO Petrochemical Company Limited, a joint venture between Sinopec and BP, has the largest styrene capacity, standing at 650 kt/a.
China Styrene Industry Chain Report, 2014-20017 by ResearchInChina focuses on the following:
 Global styrene capacity and distribution; Global styrene capacity and distribution;
Supply and demand, import and export, competitive landscape, price and development forecast for 2014-2017 of the Chinese styrene market;
Supply and demand, import and export, competitive landscape and price of benzene and ethylene, upstream sectors of styrene in China;
Supply and demand, import and export, competitive landscape and price of EPS, GPPS, HIPS, ABS, SAN and SBR, downstream sectors of styrene in China;
Operation, styrene business, development and forecast of 11 Chinese styrene and downstream products producers.
第一章 苯乙烯概述
1.1 定义
1.2 发展历程
1.3 用途
1.4 生产工艺
1.5 产业链
第二章 苯乙烯市场分析
2.1 全球市场
2.2 中国市场
2.2.1 相关政策
2.2.2 供给分析
2.2.3 需求分析
2.2.4 进出口分析
2.2.5 竞争格局
2.2.6 价格分析
第三章 中国苯乙烯上游行业分析
3.1 纯苯
3.1.1 供给分析
3.1.2 市场需求
3.1.3 进出口分析
3.1.4 价格分析
3.2 乙烯
3.2.1 供给
3.2.2 需求
3.2.3 进出口
3.2.4 价格分析
第四章 中国苯乙烯下游行业分析
4.1 可发性聚苯乙烯(EPS)
4.1.1 供给分析
4.1.2 需求分析
4.1.3 进出口分析
4.1.4 竞争格局
4.1.5 价格分析
4.2 聚苯乙烯(PS)
4.2.1 供给分析
4.2.2 需求分析
4.2.3 进出口分析
4.2.4 竞争格局
4.2.5 价格分析
4.3 丙烯腈-丁二烯-苯乙烯共聚物(ABS)
4.3.1 供给分析
4.3.2 需求分析
4.3.3 进出口分析
4.3.4 竞争格局
4.3.5 价格分析
4.4 丙烯腈-苯乙烯共聚物(SAN)
4.4.1 市场概述
4.3.2 进出口分析
4.3.3 价格分析
4.5 丁苯橡胶(SBR)
4.5.1 供给分析
4.5.2 需求分析
4.5.3 进出口分析
4.5.4 竞争格局
4.5.5 价格分析
第五章 中国主要企业
5.1 双良节能
5.1.1 企业简介
5.1.2 经营情况
5.1.3 营收构成
5.1.4 毛利率
5.1.5 苯乙烯业务
5.1.6 预测与展望
5.2 华锦股份
5.2.1 企业简介
5.2.2 经营情况
5.2.3 营收构成
5.2.4 毛利率
5.2.5 客户及供应商
5.2.6 苯乙烯业务
5.2.7 预测与展望
5.3 上海赛科
5.3.1 企业简介
5.3.2 经营情况
5.3.3 苯乙烯业务
5.4 中海壳牌
5.4.1 企业简介
5.4.2 苯乙烯业务
5.5 镇利化学
5.5.1 企业简介
5.5.2 经营情况
5.5.3 苯乙烯业务
5.6 见龙机构
5.6.1 公司简介
5.6.2 EPS业务
5.7 兴达泡塑
5.7.1 企业简介
5.7.2 EPS业务
5.8 台达化工
5.8.1 企业简介
5.8.2 经营情况
5.8.3 营收构成
5.8.4 EPS业务
5.9 镇江奇美
5.9.1 企业简介
5.9.2 PS/ABS业务
5.10 扬子巴斯夫
5.10.1 企业简介
5.10.2 PS业务
5.11 申华化学
5.11.1 企业简介
5.11.2 经营情况
5.11.3 丁苯橡胶业务
第六章 总结及预测
6.1 总结
6.2 供需预测
1. Overview of Styrene
1.1 Definition
1.2 Development History
1.3 Application
1.4 Production Technology
1.5 Industry Chain
2. Styrene Market
2.1 Global Market
2.2 Chinese Market
2.2.1 Relevant Policies
2.2.2 Supply
2.2.3 Demand
2.2.4 Import and Export
2.2.5 Competitive Landscape
2.2.6 Price
3. Upstream Sectors of Styrene in China
3.1 Benzene
3.1.1 Supply
3.1.2 Demand
3.1.3 Import and Export
3.1.4 Price
3.2 Ethylene
3.2.1 Supply
3.2.2 Demand
3.2.3 Import and Export
3.2.4 Price
4. Downstream Sectors of Styrene in China
4.1 EPS
4.1.1 Supply
4.1.2 Demand
4.1.3 Import and Export
4.1.4 Competitive Landscape
4.1.5 Price
4.2 PS
4.2.1 Supply
4.2.2 Demand
4.2.3 Import and Export
4.2.4 Competitive Landscape
4.2.5 Price
4.3 ABS
4.3.1 Supply
4.3.2 Demand
4.3.3 Import and Export
4.3.4 Competitive Landscape
4.3.5 Price
4.4 SAN
4.4.1 Market Overview
4.3.2 Import and Export
4.3.3 Price
4.5 SBR
4.5.1 Supply
4.5.2 Demand
4.5.3 Import and Export
4.5.4 Competitive Landscape
4.5.5 Price
5. Major Chinese Companies
5.1 Shuangliang Eco-Energy Systems
5.1.1 Profile
5.1.2 Operation
5.1.3 Revenue Structure
5.1.4 Gross Margin
5.1.5 Styrene Business
5.1.6 Forecast and Outlook
5.2 North Huajin Chemical Industries
5.2.1 Profile
5.2.2 Operation
5.2.3 Revenue Structure
5.2.4 Gross Margin
5.2.5 Customers and Suppliers
5.2.6 Styrene Business
5.2.7 Forecast and Outlook
5.3 Shanghai SECCO Petrochemical
5.3.1 Profile
5.3.2 Operation
5.3.3 Styrene Business
5.4 CNOOC and Shell Petrochemicals
5.4.1 Profile
5.4.2 Styrene Business
5.5 Ningbo ZRCC Lyondell Chemical
5.5.1 Profile
5.5.2 Operation
5.5.3 Styrene Business
5.6 Loyal Group
5.6.1 Profile
5.6.2 EPS Business
5.7 Wuxi Xingda New Foam Plastics Materials
5.7.1 Profile
5.7.2 EPS Business
5.8 Taita Chemical
5.8.1 Profile
5.8.2 Operation
5.8.3 Revenue Structure
5.8.4 EPS Business
5.9 Zhenjiang Chimei Chemical
5.9.1 Profile
5.9.2 PS/ABS Business
5.10 BASF-YPC
5.10.1 Profile
5.10.2 PS Business
5.11 Shen Hua Chemical Industrial
5.11.1 Profile
5.11.2 Operation
5.11.3 SBR Business
6. Summary and Forecast
6.1 Summary
6.2 Supply and Demand Forecast
表:苯乙烯用途
图:苯乙烯工艺路线
图:苯乙烯产业链
图:2013年全球苯乙烯产能地区分布
图:2013年全球及中国苯乙烯产能、产量和表观消费量对比
图:2005-2013年中国苯乙烯产能及增长率
图:2005-2013年中国苯乙烯产量及开工率
表:截止2013年底中国苯乙烯主要生产企业及其产能
表:2014年中国拟/在建苯乙烯项目
图:2005-2013年中国苯乙烯表观消费量及自给率
表:苯乙烯下游产品及主要应用
图:2013年中国苯乙烯下游需求结构
图:2009-2014年中国苯乙烯进出口量
图:2009-2014年中国苯乙烯进出口平均价格
图:2013年中国苯乙烯进口来源
图:2013年中国苯乙烯出口目的地
图:2013年中国苯乙烯(按企业性质)产能分布
表:2013年中国苯乙烯行业竞争格局
图:2013年中国苯乙烯(按地区)产能分布
表:2013年中国苯乙烯(按工艺路线)产能分布
图:2006-2014年中国苯乙烯(99.5%)市场价格走势
表:2014年8月1日中国苯乙烯(分地区)市场价格
表:2014年中国苯乙烯(分企业)市场价格
图:2006-2013年中国纯苯产能及增长率
图:2006-2013年中国纯苯产量及增长率
图:2013年中国纯苯(分地区)产量占比
图:2008-2013年中国纯苯表观消费量及自给率
图:2013年中国纯苯下游需求结构
图:2009-2014年中国纯苯进出口量
图:2009-2014年中国纯苯进出口平均价格
图:2013年中国纯苯进口来源结构(按进口量)
图:2006-2014年中国纯苯市场价格走势
表:2014年8月15日中国纯苯(分地区)市场价格
表:2012-2013年中国纯苯主要厂商出厂价格
图:2013年中国乙烯(分企业)产能占比
表:2013年中国乙烯生产企业及其产能
图:2006-2013年中国乙烯产量及增长率
图:2013年中国乙烯(分地区)产量占比
图:2006-2013年中国乙烯表观消费量及增长率
表:2009-2014年中国乙烯进出口量
表:2009-2014年中国乙烯进口平均价格
表:2013年中国乙烯进口来源分布(按进口量)
表:2013年中国乙烯出口目的地分布(按出口量)
图:2009-2014年东北亚乙烯价格走势
表:截止2013年底中国EPS主要生产企业及其产能
表:2007-2013年中国EPS产量及增长率
表:2007-2013年中国EPS表观消费量及增长率
图:2009-2014年中国EPS进出口量
图:2009-2014年中国EPS进出口平均价格
图:2013年中国EPS进口来源
图:2013年中国EPS出口目的地
表:2013年中国EPS行业竞争格局
图:2013年中国EPS产能地区分布
图:2008-2014年无锡兴达EPS(阻燃料)价格走势
表:2014年8月15日中国EPS(分企业)市场价格
表:截止2013年底中国PS主要生产企业及其产能
表:2014年中国PS拟/在建项目
图:2009-2013年中国PS产量及增长率
图:2009-2013年中国PS表观消费量及增长率
图:2009-2014年中国PS进出口量
图:2009-2014年中国PS进出口平均价格
图:2013年中国PS进口来源
图:2013年中国PS出口目的地
表:2013年中国PS行业竞争格局
图:2013年中国PS产能地区分布
图:2006-2014年中国PS(透明 666 D)价格走势
表:2014年8月15日中国PS(分地区)市场价格
表:2014年8月15日中国PS(分企业)市场价格
表:截止2013年底中国ABS主要生产企业及其产能
表:2014年中国ABS拟/在建项目情况
图:2010-2013年中国ABS产量及增长率
图:2013年中国ABS(分地区)产量占比
图:2010-2013年中国ABS表观消费量及增长率
图:2009-2014年中国ABS进出口量
图:2009-2014年中国ABS进出口平均价格
图:2013年中国ABS进口来源
图:2013年中国ABS出口目的地
表:2013年中国ABS行业竞争格局
图:2013年中国ABS产能地区分布
图:2006-2014年中国ABS(757k)市场价格走势
表:2014年8月8日中国ABS(分地区)市场价格
表:2014年8月8日中国ABS(分企业)市场价格
表:SAN树脂分类及用途
表:SAN树脂下游领域及应用产品
图:2009-2014年中国SAN进出口量
图:2009-2014年中国SAN进出口平均价格
图:2013年中国SAN进口来源
图:2013年中国SAN出口目的地
图:2006-2014年中国SAN市场价格走势
表:2014年8月8日中国SAN(分企业)市场价格
表:截止2013年底中国丁苯橡胶主要生产企业及其产能
表:2014年中国丁苯橡胶拟/在建项目情况
图:2005-2013年中国丁苯橡胶产量及增长率
图:2010-2013年中国丁苯橡胶表观消费量及增长率
图:2010-2014年中国丁苯橡胶进出口量
图:2010-2014年中国丁苯橡胶进出口平均价格
表:2013年中国丁苯橡胶行业竞争格局
图:2013年中国丁苯橡胶(分品种)产能占比
图:2013年中国丁苯橡胶(分地区)产能占比
图:2006-2014年中国丁苯橡胶(1500)市场价格走势
表:2014年8月8日中国丁苯橡胶(分地区)市场价格
表:2014年8月8日中国丁苯橡胶(分企业)市场价格
图:2009-2013年双良节能营业收入和净利润
表:2011-2013年双良节能(分产品)营业收入
图:2011-2013年双良节能(分产品)营业收入占比
表:2011-2013年双良节能(分地区)营业收入
表:2011-2013年双良节能(分地区)营业收入占比
图:2011-2013年双良节能主营产品毛利率
图:2011-2013年双良节能苯乙烯、EPS产量
图:2011-2013年利士德化工总资产和净利润
表:2013-2017年双良节能营业收入和净利润预测
表:华锦股份业务板块及主要产品
表:2013年华锦股份主要产品产量
图:2009-2013年华锦股份营业收入和净利润
表:2011-2013年华锦股份(分行业)营业收入
图:2011-2013年华锦股份(分行业)营业收入占比
表:2011-2013年华锦股份(分产品)营业收入
图:2011-2013年华锦股份(分产品)营业收入占比
表:2011-2013年华锦股份(分地区)营业收入
图:2011-2013年华锦股份(分地区)营业收入占比
图:2011-2013年华锦股份(分行业)毛利率
表:2011-2013年华锦股份(分产品)毛利率
图:2011-2013年华锦股份前五名客户贡献收入及占比
表:2013年华锦股份前五名客户名称、收入贡献及占比
表:2013年华锦股份前五名供应商名称、采购金额及占比
图:2012-2013年华锦股份石化产品产销量
图:2012-2013年华锦股份精细化工产品产销量
表:2013-2017年华锦股份营业收入和净利润预测
表:2011-2013年上海赛科营业收入和净利润
表:2011-2013年上海赛科总资产和总负债
表:2013年上海赛科主要生产装置及其产能
表:2013年中海壳牌主要生产装置及产能
图:2012-2013年镇利化学营业收入和利税总额
图:2012-2013年镇利化学苯乙烯和环氧乙烷产量
表:2013年见龙机构EPS子公司及产能
表:2013年兴达泡塑EPS子公司及产能
表:2014年兴达泡塑在建EPS产能情况
图:2011-2013年台达化工营业收入及净利润
表:2011-2013年台达化工(分产品)营业收入
图:2011-2013年台达化工(分产品)营业收入占比
表:2011-2013年台达化工(分地区)营业收入
图:2011-2013年台达化工(分地区)营业收入占比
表:台达化工聚苯乙烯产品发展历程
表:2013年镇江奇美主营产品产能
表:2014年镇江奇美在建项目情况
表:2013年扬子巴斯夫主要生产装置及其产能
表:2013年扬巴苯乙烯生产装置及其产能
图:2010-2012年申华化学营业额
表:申华化学丁苯橡胶发展历程
表:2010-2012年申华化学丁苯橡胶产销量
表:2011-2013年中国苯乙烯市场部分企业收入对比
图:2013年中国苯乙烯及下游产品产能、产量
图:2013-2017年中国苯乙烯供需预测
图:2013-2017年中国苯乙烯下游需求结构预测
Applications of Styrene
Routing of Styrene
Industry Chain of Styrene
Distribution of Global Styrene Capacity by Region, 2013
Capacity, Output and Apparent Consumption of Styrene across the Globe and in China, 2013
China’s Styrene Capacity and Growth Rate, 2005-2013
China’s Styrene Output and Utilization of Capacity, 2005-2013
Major Chinese Styrene Producers and Their Capacities by the end of 2013
Styrene Projects Proposed/Under Construction, 2014
China’s Apparent Consumption of Styrene and Self-sufficiency, 2005-2013
Downstream Products and Their Major Applications of Styrene
Downstream Demand Structure of Styrene in China, 2013
Import and Export Volume of Styrene in China, 2009-2014
Average Import and Export Prices of Styrene in China, 2009-2014
Sources of Imported Styrene into China, 2013
Destinations of Exported Styrene from China, 2013
Capacity Distribution of Styrene in China (by Nature of Company), 2013
Competitive Landscape of China Styrene Industry, 2013
Capacity Distribution of Styrene in China (by Region), 2013
Capacity Distribution of Styrene in China (by Routing), 2013
Market Price Trend of Styrene (99.5%) in China, 2006-2014
Market Prices of Styrene in China (by Region), Aug. 1, 2014
Market Prices of Styrene in China (by Company), 2014
China’s Benzene Capacity and Growth Rate, 2006-2013
China’s Benzene Output and Growth Rate, 2006-2013
Output Structure of Benzene in China (by Region), 2013
China’s Apparent Consumption of Benzene and Self-sufficiency, 2008-2013
Downstream Demand Structure of Benzene in China, 2013
Import and Export Volume of Benzene in China, 2009-2014
Average Import and Export Prices of Benzene in China, 2009-2014
Sources Structure of Imported Benzene in China (by Import Volume), 2013
Market Price Trend of Benzene in China, 2006-2014
Market Prices of Benzene in China (by Region), Aug. 15, 2014
Ex-factory Prices of Benzene from Major Producers in China, 2012-2013
Capacity Structure of Ethylene in China (by Company), 2013
Ethylene Producers in China and Their Capacities, 2013
China’s Ethylene Output and Growth Rate, 2006-2013
Capacity Structure of Ethylene in China (by Region), 2013
China’s Apparent Consumption of Ethylene and Growth Rate, 2006-2013
Import and Export Volume of Ethylene in China, 2009-2014
Average Import Price of Ethylene in China, 2009-2014
Sources of Imported Ethylene into China (by Import Volume), 2013
Destinations of Exported Ethylene from China (by Export Volume), 2013
Price Trend of Ethylene in Northeast Asia, 2009-2014
Major EPS Producers in China and Their Capacities by the end of 2013
China’s EPS Output and Growth Rate, 2007-2013
China’s Apparent Consumption of EPS and Growth Rate, 2007-2013
Import and Export Volume of EPS in China, 2009-2014
Average Import and Export Prices of EPS in China, 2009-2014
Sources of Imported EPS into China, 2013
Destinations of Exported EPS from China, 2013
Competitive Landscape of China EPS Industry, 2013
Capacity Distribution of EPS in China by Region, 2013
Price Trend of Wuxi Xingda New Foam Plastics Materials’ EPS (Fuel Resistance), 2008-2014
Market Prices of EPS in China (by Company), Aug. 15, 2014
Major PS Producers in China and Their Capacities by the end of 2013
PS Projects Proposed/Under Construction in China, 2014
China’s PS Output and Growth Rate, 2009-2013
China’s Apparent Consumption of PS and Growth Rate, 2009-2013
Import and Export Volume of PS in China, 2009-2014
Average Import and Export Prices of PS in China, 2009-2014
Sources of Imported PS into China, 2013
Destinations of Exported PS from China, 2013
Competitive Landscape of China PS Industry, 2013
Capacity Distribution of PS in China by Region, 2013
Price Trend of PS (Clear/Transparent 666 D) in China, 2006-2014
Market Prices of PS in China (by Region), Aug. 15, 2014
Market Prices of PS in China (by Company), Aug. 15, 2014
Major ABS Producers in China and Their Capacities by the end of 2013
ABS Projects Proposed/Under Construction in China, 2014
China’s ABS Output and Growth Rate, 2010-2013
Output Structure of ABS in China (by Region), 2013
China’s Apparent Consumption of ABS and Growth Rate, 2010-2013
Import and Export Volume of ABS in China, 2009-2014
Average Import and Export Prices of ABS in China, 2009-2014
Sources of Imported ABS into China, 2013
Destinations of Exported ABS from China, 2013
Competitive Landscape of China ABS Industry, 2013
Capacity Distribution of ABS in China by Region, 2013
Market Price Trend of ABS (757K) in China, 2006-2014
Market Prices of ABS in China (by Region), Aug. 8, 2014
Market Prices of ABS in China (by Company), Aug. 8, 2014
Classification and Applications of SAN
Downstream Sectors and Applications of SAN
Import and Export Volume of SAN in China, 2009-2014
Average Import and Export Prices of SAN in China, 2009-2014
Sources of Imported SAN into China, 2013
Destinations of Exported SAN from China, 2013
Market Price Trend of SAN in China, 2006-2014
Market Prices of SAN in China (by Company), Aug. 8, 2014
Major SBR Producers in China and Their Capacities by the End of 2013
SBR Projects Proposed/Under Construction in China, 2014
China’s SBR Output and Growth Rate, 2005-2013
China’s Apparent Consumption of SBR and Growth Rate, 2010-2013
Import and Export Volume of SBR in China, 2010-2014
Average Import and Export Prices of SBR in China, 2010-2014
Competitive Landscape of China SBR Industry, 2013
Capacity Structure of SBR in China (by Variety), 2013
Capacity Structure of SBR in China (by Region), 2013
Market Price Trend of SBR (1500) in China, 2006-2014
Market Prices of SBR in China (by Region), Aug. 8, 2014
Market Prices of SBR in China (by Company), Aug. 8, 2014
Revenue and Net Income of Shuangliang Eco-Energy Systems, 2009-2013
Revenue Breakdown of Shuangliang Eco-Energy Systems (by Product), 2011-2013
Revenue Structure of Shuangliang Eco-Energy Systems (by Product), 2011-2013
Revenue Breakdown of Shuangliang Eco-Energy Systems (by Region), 2011-2013
Revenue Structure of Shuangliang Eco-Energy Systems (by Region), 2011-2013
Gross Margins of Main Products of Shuangliang Eco-Energy Systems, 2011-2013
Output of Styrene and EPS of Shuangliang Eco-Energy Systems, 2011-2013
Total Assets and Net Income of Leasty Chemical, 2011-2013
Revenue and Net Income of Shuangliang Eco-Energy Systems, 2013-2017E
Business Segments and Main Products of North Huajin Chemical Industries
Output of Main Products of North Huajin Chemical Industries, 2013
Revenue and Net Income of North Huajin Chemical Industries, 2009-2013
Revenue Breakdown of North Huajin Chemical Industries (by Sector), 2011-2013
Revenue Structure of North Huajin Chemical Industries (by Sector), 2011-2013
Revenue Breakdown of North Huajin Chemical Industries (by Product), 2011-2013
Revenue Structure of North Huajin Chemical Industries (by Product), 2011-2013
Revenue Breakdown of North Huajin Chemical Industries (by Region), 2011-2013
Revenue Structure of North Huajin Chemical Industries (by Region), 2011-2013
Gross Margin of North Huajin Chemical Industries (by Sector), 2011-2013
Gross Margin of North Huajin Chemical Industries (by Product), 2011-2013
North Huajin Chemical Industries’ Revenue from Top 5 Customers and % of Total Revenue, 2011-2013
Name List and Revenue Contribution of North Huajin Chemical Industries’ Top 5 Customers, 2013
Name List and Procurement of North Huajin Chemical Industries from Top 5 Suppliers, 2013
Petrochemicals Output and Sales Volume of North Huajin Chemical Industries, 2012-2013
Fine Chemicals Output and Sales Volume of North Huajin Chemical Industries, 2012-2013
Revenue and Net Income of North Huajin Chemical Industries, 2013-2017E
Revenue and Net Income of Shanghai SECCO Petrochemical, 2011-2013
Total Assets and Total Liabilities of Shanghai SECCO Petrochemical, 2011-2013
Main Production Plants and Their Capacities of Shanghai SECCO Petrochemical, 2013
Main Production Plants and Their Capacities of CNOOC and Shell Petrochemicals, 2013
Revenue and Total Pre-tax Profits of Ningbo ZRCC Lyondell Chemical, 2012-2013
Styrene and Ethylene Oxide Output of Ningbo ZRCC Lyondell Chemical, 2012-2013
EPS Subsidiaries and Their Capacities of Loyal Group, 2013
EPS Subsidiaries and Their Capacities of Wuxi Xingda New Foam Plastics Materials, 2013
EPS Capacity Under Construction of Wuxi Xingda New Foam Plastics Materials, 2014
Revenue and Net Income of Taita Chemical, 2011-2013
Revenue Breakdown of Taita Chemical (by Product), 2011-2013
Revenue Structure of Taita Chemical (by Product), 2011-2013
Revenue Breakdown of Taita Chemical (by Region), 2011-2013
Revenue Structure of Taita Chemical (by Region), 2011-2013
Development History of PS Products of Taita Chemical
Capacity of Main Products of Zhenjiang Chimei Chemical, 2013
Projects Under Construction of Zhenjiang Chimei Chemical, 2014
Main Production Plants and Their Capacities of BASF-YPC, 2013
Styrene Production Plants and Their Capacities of BASF-YPC, 2013
Turnover of Shen Hua Chemical Industrial, 2010-2012
Development History of SBR of Shen Hua Chemical Industrial
SBR Output and Sales Volume of Shen Hua Chemical Industrial, 2010-2012
Revenue Comparison among Some Companies in the Chinese Styrene Market, 2011-2013
Capacity and Output of Styrene and Its Downstream Products in China, 2013
Supply and Demand Forecast of Styrene in China, 2013-2017E
Downstream Demand Structure Forecast of Styrene in China, 2013-2017E
如果这份报告不能满足您的要求,我们还可以为您定制报告,请 留言说明您的详细需求。
|