|
|
|
报告导航:研究报告—
生命科学—生物科技
|
|
2014-2017年中国人用疫苗行业研究报告 |
 |
字数:4.2万 |
页数:142 |
图表数:136 |
|
中文电子版:8500元 |
中文纸版:4250元 |
中文(电子+纸)版:9000元 |
|
英文电子版:2600美元 |
英文纸版:2800美元 |
英文(电子+纸)版:2900美元 |
|
编号:ZYM057
|
发布日期:2014-08 |
附件:下载 |
 |
|
|
疫苗是为了预防、控制传染病的发生、流行,用于人体的预防性生物制品,需求相对刚性。2013年中国人用疫苗批签发量同比增长4.9%,市场规模同比增长2.8%。由于疑似接种疫苗引起死亡事件以及部分企业如深圳康泰、天坛生物、大连汉信等因未通过新版GMP面临部分产品停产等影响,2014年中国人用疫苗市场供需可能出现小幅下滑,但长期来看,仍将稳定增长。
受中国经济水平、国家疫苗预防政策及人们防疫意识等影响,目前中国实际接种疫苗以一类免费疫苗为主,批签发量占比约达80%左右。并且,中国卫生部门正尝试改善一类疫苗质量。如2014年广东惠州市率先试点将脊髓灰质炎灭活疫苗纳入免疫规划(本次试点所采购疫苗由赛诺菲巴斯德公司提供)。不过这只是部分改进计划,即第一二剂次接种注射脊髓灰质灭活疫苗IPV,第三四剂次仍然接种口服脊髓灰质减毒疫苗OPV。
中国人用疫苗市场仍主要被中生集团下属的北京天坛生物、成都所、上海所、兰州所、武汉所、长春所、医科院生物所等国有企业占据,但占比在下降。2013年中国国有企业疫苗批签发量占比达69.9%,较上年下降8.6个百分比;而民资企业、外资企业占比则较上年分别增长6个百分点、2.6个百分点。
受中国疫苗质量的提高、出口退税的增长(2009年出口退税由13%提高到15%)等利好因素影响,中国人用疫苗出口量及金额增长较快。2014年1-6月中国人用疫苗出口量、出口金额分别达65.08吨、1545万美元,较上年同期分别增长115.6%、50%。
此外,随着中国疫苗监管体系通过WHO的评估,成都所、天坛生物、华兰生物等国内多家疫苗企业正积极向世卫组织申请预认证以进一步拓展海外市场。2013年10月,成都所的乙脑疫苗成为国内首个通过WHO预认证的疫苗,被列入联合国采购清单;2014年4月,华兰生物的流感裂解疫苗接受WHO现场检查,有望2015实现出口。
《2014-2017年中国人用疫苗行业研究报告》主要包括以下几个方面:
 中国人用疫苗行业运行环境、总体现状、销售渠道等; 中国人用疫苗行业运行环境、总体现状、销售渠道等;
中国人用疫苗行业市场供需、竞争格局、进出口及发展预测等;
中国乙肝疫苗、流感疫苗、狂犬病疫苗、肺炎疫苗等10种疫苗细分产品的市场供需、竞争格局以及市场价格等;
中国11家主要人用疫苗企业的经营状况、疫苗业务及发展前景等。
Vaccines can prevent and control infectious diseases, so the demand for these biological products is relatively rigid. In 2013, China’s human vaccine lot release volume grew by 4.9% from a year earlier, and the market size expanded 2.8% year on year. As vaccination is suspected of causing death and some companies (such as Shenzhen Kangtai, Tiantan Biological and Dalian Hissen) have to shut down the production of some products after failing to pass the new GMP certification, China's human vaccine market supply and demand may witness a slight decline in 2014, but it is still expected to grow steadily in the long run.
Affected by China’s economic level, national vaccine prevention policies and people’s awareness, free EPI vaccines prevail in China with a share of approximately 80% in the total lot release volume. Also, the Chinese health authorities are trying to improve the quality of EPI vaccines. For example, Huizhou City of Guangdong province takes the lead to contain poliomyelitis inactivated vaccines into its immunization program (Sanofi Pasteur acts as a supplier in this program) for a trial in 2014. However, this program stipulates the injection of the poliomyelitis inactivated vaccine “IPV” for the first two vaccinations, while requires the oral administration of the poliomyelitis attenuated vaccine “OPV” for the third and fourth vaccinations.
Chinese human vaccine market is still dominated by Beijing Tiantan Biological, Chengdu Institute of Biology under Chinese Academy of Sciences, Shanghai Institute of Biological Products Co., Ltd. , Lanzhou Institute of Biological Products Co., Ltd., Wuhan Institute of Biological Products Co., Ltd., Changchun Institute of Biological Products Co., Ltd., Institute of Medical Biology under Chinese Academy of Medical Sciences and other state-owned enterprises; but, their market share is falling. In 2013, the lot release volume of Chinese state-owned enterprises accounted for 69.9%, down 8.6 percentage points compared with last year; whereas, the share of private and foreign-funded enterprises jumped by 6 percentage points and 2.6 percentage points over the previous year respectively.
The improved quality of Chinese vaccines, the increased export tax rebates (from 13% in 2009 to 15%) and other favorable factors have prompted China’s human vaccine export volume and value to grow quickly. From January to June of 2014, the export volume and value amounted to 65.08 tons and USD15.45 million respectively, representing the separate increase of 115.6% and 50% over the same period of last year.
As China’s vaccine regulatory system is recognized by WHO, Chengdu Institute of Biology under Chinese Academy of Sciences, Beijing Tiantan Biological, Hualan Biological and other domestic vaccine companies are actively submitting pre-certification application to WHO in order to further expand overseas markets. In October 2013, the JE (Japanese encephalitis) vaccines of Chengdu Institute of Biology under Chinese Academy of Sciences were pre-certified by WHO at first and included in the procurement list of the United Nations. WHO inspected the influenza (split virion) vaccines of Hualan Biological on the spot in April 2014, and these vaccines are expected to be exported in 2015.
The report covers the following:
Operating environment, status quo and sales channels of China human vaccine industry;
Market supply & demand, competition patterns, import & export and development prediction of China human vaccine industry;
Market supply & demand, competition patterns and market prices of 10 kinds of vaccine products including hepatitis B vaccine, influenza vaccine, rabies vaccine and pneumonia vaccine in China;
Operation, vaccine business and development prospects of 11 Chinese human vaccine enterprises.
第一章 人用疫苗行业概况
1.1 定义及分类
1.2 产业链
第二章 中国人用疫苗市场概况
2.1 总体现状
2.2 运营环境
2.2.1 国际市场
2.2.2 政策环境
2.2.3 中国生物制药市场
2.3 市场现状
2.4 市场供需
2.5 竞争格局
2.6 发展动态
2.7 销售渠道
第三章 中国人用疫苗细分市场分析
3.1 乙肝疫苗
3.1.1 市场供需
3.1.2 竞争格局
3.1.3 市场价格
3.2 流脑疫苗
3.2.1 市场供需
3.2.2 竞争格局
3.2.3 市场价格
3.2.4 市场预测
3.3 甲肝疫苗
3.3.1 市场供需
3.3.2 竞争格局
3.3.3市场价格
3.3.4 市场预测
3.4 流感疫苗
3.4.1 市场供需
3.4.2 竞争格局
3.4.3 市场价格
3.5 Hib 疫苗
3.5.1 市场供需
3.5.2 竞争格局
3.5.3 市场价格
3.5.4 市场预测
3.6 人用狂犬病疫苗
3.6.1 市场供需
3.6.2 竞争格局
3.6.3 市场价格
3.6.4 市场预测
3.7 水痘疫苗
3.7.1 市场供需
3.7.2 竞争格局
3.7.3 市场价格
3.8 肺炎疫苗
3.8.1 市场供需
3.8.2 竞争格局
3.8.3 市场价格
3.9 DTP 疫苗
3.9.1 市场供需
3.9.2 竞争格局
3.9.3 市场动态及预测
3.10 脊髓灰质炎疫苗
3.10.1 市场供需
3.10.2 竞争格局
第四章 中国人用疫苗进出口分析
4.1 出口分析
4.1.1 出口量及金额
4.1.2 出口区域分布
4.2 进口分析
4.2.1 进口量及金额
4.2.2 进口国家和地区
第五章 中国主要疫苗企业
5.1 中生集团
5.1.1 北京天坛生物制品股份有限公司
5.2华兰生物工程股份有限公司
5.2.1 公司简介
5.2.2 经营状况
5.2.3 营收构成
5.2.4 毛利率
5.2.5 客户与供应商
5.2.6 研发与投资
5.2.7 疫苗业务
5.2.8 发展前景及预测
5.3重庆智飞生物制品股份有限公司
5.3.1 公司简介
5.3.2 经营状况
5.3.3 营收构成
5.3.4 毛利率
5.3.5 主要客户
5.3.6 研发与投资
5.3.7 发展前景及预测
5.4云南沃森生物技术股份有限公司
5.4.1 公司简介
5.4.2 经营状况
5.4.3 营收构成
5.4.4 毛利率
5.4.5 客户与供应商
5.4.6 研发与投资
5.4.7 发展前景及预测
5.5科兴控股生物技术有限公司
5.5.1 公司简介
5.5.2 经营状况
5.5.3营收构成
5.5.4 研发与投资
5.6辽宁成大股份有限公司
5.6.1 公司简介
5.6.2 经营状况
5.6.3 营收构成
5.6.4 毛利率
5.6.5 主要客户
5.6.6 疫苗业务
5.6.7 发展前景及预测
5.7 长春百克生物科技股份公司
5.7.1 公司简介
5.7.2 经营状况
5.8 长春长生生物科技股份有限公司
5.8.1 公司简介
5.8.2 经营状况
5.9 浙江天元生物药业有限公司
5.9.1 公司简介
5.9.2 经营状况
5.10 深圳康泰生物制品股份有限公司
5.10.1 公司简介
5.10.2 经营状况
5.11大连汉信生物制药有限公司
5.11.1 公司简介
5.11.2 经营状况
1. Overview of Vaccine Industry
1.1 Definition & classification
1.2 Industry Chain
2. China Human Vaccine Industry & Market
2.1 Overview
2.2 Operating Environment
2.2.1 International Market
2.2.2 Policy Environment
2.2.3 Biopharmaceutical Market in China
2.3 Status Quo
2.4 Supply & Demand
2.5 Competition Pattern
2.6 Dynamics
2.7 Sales Channel
3. Human Vaccine Market Segments in China
3.1 Hepatitis B Vaccine
3.1.1 Supply & Demand
3.1.2 Competition Pattern
3.1.3 Market Price
3.2 Meningococcal Vaccines
3.2.1 Supply & Demand
3.2.2 Competition Pattern
3.2.3 Market Price
3.2.4 Market Forecast
3.3 Hepatitis A Vaccine
3.3.1 Supply & Demand
3.3.2 Competition Pattern
3.3.3 Market Price
3.3.4 Market Forecast
3.4 Influenza Vaccine
3.4.1 Supply & Demand
3.4.2 Competition Pattern
3.4.3 Market Price
3.5 Hib Vaccine
3.5.1 Supply & Demand
3.5.2 Competition Pattern
3.5.3 Market Price
3.5.4 Market Forecast
3.6 Rabies Vaccine
3.6.1 Supply & Demand
3.6.2 Competition Pattern
3.6.3 Market Price
3.6.4 Market Forecast
3.7 Varicella Vaccine
3.7.1 Supply & Demand
3.7.2 Competition Pattern
3.7.3 Market Price
3.8 Pneumococcal Vaccines
3.8.1 Supply & Demand
3.8.2 Competition Pattern
3.8.3 Market Price
3.9 DTP Vaccine
3.9.1 Supply & Demand
3.9.2 Competition Pattern
3.9.3 Market Dynamics & Forecast
3.10 Poliomyelitis Vaccine
3.10.1 Supply & Demand
3.10.2 Competition Pattern
4. China’s Import and Export of Vaccines
4.1 Export
4.1.1 Export Volume and Value
4.1.2 Export Country and Region
4.2 Import
4.2.1 Import Volume and Value
4.2.2 Import Country and Region
5. Major Vaccine Manufacturers in China
5.1 China National Biotec Group
5.1.1 Beijing Tiantan Biological Products Co., Ltd
5.2 Hualan Biological Engineering Inc.
5.2.1 Profile
5.2.2 Operation
5.2.3 Revenue Structure
5.2.4 Gross Margin
5.2.5 Customers and Suppliers
5.2.6 R&D and Investment
5.2.7 Vaccine Business
5.2.8 Development and Prospects
5.3 Chongqing Zhifei Biological Products Co., Ltd
5.3.1 Profile
5.3.2 Operation
5.3.3 Revenue Structure
5.3.4 Gross Margin
5.3.5 Customers
5.3.6 R&D and Investment
5.3.7 Development and Prospects
5.4 Walvax Biotechnology Co., Ltd
5.4.1 Profile
5.4.2 Operation
5.4.3 Revenue Structure
5.4.4 Gross Margin
5.4.5 Customers and Suppliers
5.4.6 R&D and Investment
5.4.7 Development and Prospects
5.5 Sinovac Biotech Ltd.
5.5.1 Profile
5.5.2 Operation
5.5.3 Revenue Structure
5.5.4 R&D and Investment
5.6 Liaoning Chengda Co., Ltd.
5.6.1 Profile
5.6.2 Operation
5.6.3 Revenue Structure
5.6.4 Gross Margin
5.6.5 Customers
5.6.6 Vaccine Business
5.6.7 Development and Prospects
5.7 Changchun BCHT Biotechnology Co. Ltd.
5.7.1 Profile
5.7.2 Operation
5.8 Changchun Changsheng Life Sciences Limited
5.8.1 Profile
5.8.2 Operation
5.9 Zhejiang Tianyuan Bio-Pharmaceutical Co., Ltd
5.9.1 Profile
5.9.2 Operation
5.10 Shenzhen Kangtai Biological Products Co. Ltd
5.10.1 Profile
5.10.2 Operation
5.11 Dalian Hissen Bio-Pharm Co., Ltd
5.11.1 Profile
5.11.2 Operation
表:人用疫苗分类
图:人用疫苗产业链
表:2013年中国一类人用疫苗种类及预防疾病
图:2008-2013年全球人用疫苗市场规模
图:2008-2013年全球疫苗top5企业的疫苗收入
表:2013年全球最畅销的疫苗top10
表:2005-2014年全球疫苗行业兼并购事件
表:2006-2013年中国疫苗行业相关政策
图:2008-2014年中国生物生化制药行业营业收入与利润总额
图: 2007-2013年中国人用疫苗市场规模
表:中国人用疫苗种类及供应商
表:2007-2013年中国主要疫苗企业的疫苗业务毛利率
表:2007-2013年中国一类疫苗与二类疫苗批签发量
图:2008-2013年中国一类人用疫苗批签发量占比(按企业性质)
图: 2008-2013年中国二类人用疫苗批签发量占比(按企业性质)
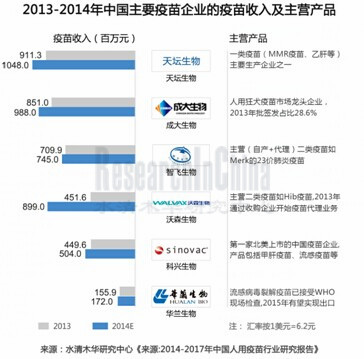
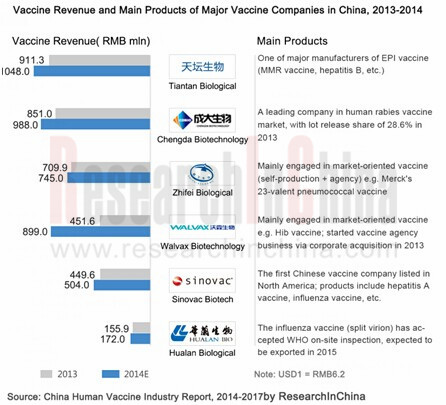
图:2011-2013年中国主要疫苗企业的疫苗业务收入
表:截至2014年8月中国部分疫苗研发情况
表:2011-2013年中国人用疫苗行业涉及外资企业事件
图:中国人用疫苗销售渠道示意图
图:2007-2013年中国乙肝疫苗批签发量(分剂型)
表:2008-2013 中国乙肝疫苗(CHO Cell)供应商及其批签发量
表:2007-2013年中国乙肝疫苗(Yeast) 供应商及其批签发量
表:2014年中国部分地区疫苗市场价格
图:2008-2013年中国流脑发病数及死亡数
图:2007-2013年中国流脑疫苗批签发量(分类型)
表:2007-2013年中国A群流脑疫苗供应商及其批签发量
表:2007-2013年中国 A+C 流脑疫苗供应商及其批签发量
表:2008-2013年中国ACYW135 流脑疫苗供应商及其批签发量
表:2014年中国部分地区流脑疫苗市场价格
图:2013-2017年中国流脑疫苗需求量(分类型)
图:2008-2013年中国甲肝疫苗发病数及死亡数
图:2007-2013年中国甲肝疫苗批签发量
表:2007-2013中国年甲肝疫苗供应商及其批签发量
表:2014年中国部分地区甲肝疫苗市场价格
图:2013-2017年中国甲肝疫苗市场需求预测
图:2008-2013年中国流感疫苗发病数及死亡率
图:2009-2012年中国H1N1 流感发病数及死亡数
表:2007-2013年中国流感疫苗批签发量(分类型)
表:2007-2013年中国流感裂解疫苗供应商及其批签发量
表:2007-2012年中国亚单位流感疫苗供应商及其批签发量
表:2014年中国部分地区流感疫苗市场价格
图:2007-2013 年中国Hib疫苗批签发量
表:2007-2013年中国Hib疫苗供应商及其批签发量
表:2014年中国部分地区流感疫苗市场价格
图:2013-2017年中国流感疫苗销量预测
图:2007-2013年中国狂犬病发病数及死亡数
图:2007-2013 年中国人用狂犬病疫苗批签发量
图:2007-2013年中国人用狂犬病批签发量(分类型)
表:2007-2013 年中国人用(Vero Cell )狂犬病疫苗供应商及其批签发量
表:2007-2013年中国人用( BHK Cell)狂犬病疫苗供应商及其批签发量
表: 2014年中国部分地区人用狂犬病疫苗市场价格
图:2013-2017年中国人用狂犬病疫苗需求量预测
图:2007-2013年中国水痘疫苗批签发量
表:2007-2013年中国水痘疫苗供应商及其批签发量
表:2014年中国部分水痘疫苗市场价格
表: 2007-2013年中国肺炎疫苗批签发量
表:2007-2013年中国7-价/23价肺炎疫苗供应商及其批签发量
表:2014年中国部分地区肺炎疫苗市场价格
表:2007-2013年中国百白破疫苗批签发量
表:2007-2013年中国无细胞百白破疫苗供应商及其批签发量
图:2007-2013年中国脊髓灰质炎疫苗批签发量
表: 2007-2013年中国脊髓灰质炎疫苗供应商及其批签发量
图:2009- 2014中国人用疫苗出口量及金额
图: 2009- 2014年中国人用疫苗出口均价
表:2013年中国人用疫苗出口国家和地区分布
图:2009- 2014年中国人用疫苗进口量及金额
图:2009- 2014年中国进口人用疫苗均价
表:2013年中国进口人用疫苗来源国家和地区
表:2013天坛生物子公司及其收入、利润
图:2007-2014年天坛生物营业收入和营业利润
图:2007-2013年天坛生物(分行业)营业收入
表:2007-2013年天坛生物(分地区)营业收入
图:2007-2013年天坛生物前五供应商及其采购金额占总采购金额比重
图:2007-2013年天坛生物前五客户收入贡献及占总营业收入的比重
表:2013年天坛生物前五客户名称、收入贡献及其占比
图: 2007-2013年天坛生物(分行业)毛利率
图:2009-2013年天坛生物研发成本及占营业收入的比重
图: 2007-2013年天坛生物疫苗营业收入
表:2009-2013年天坛生物(分产品)批签发量
图:2012-2017年天坛生物营业收入与营业利润
图:2007-2013年华兰生物营业收入和营业利润
表:2007-2013年华兰生物(分行业)营业收入
表:2007-2013年华兰生物(分产品)营业收入
表:2007-2014年华兰生物(分产品)毛利率
图:2007-2013年华兰生物前五客户收入贡献及占总营业收入的比重
图:2007-2012年华兰生物前五供应商采购金额及占总采购金额的比重
图:2007-2013年华兰生物研发投入及占营业收入的比重
表:2011-2013年华兰生物(分产品)批签发量
图:2008-2013年华兰生物疫苗营业收入及毛利率
图:2012-2017年华兰生物营业收入与营业利润
表: 智飞生物及其子公司主营产品
图:2008-2014年智飞生物营业收入与营业利润
表:2011-2013年智飞生物(分产品)营业收入
表:2011-2013年智飞生物(分产品)批签发量
表:2009-2013年智飞生物(分地区)营业收入
图:2009-2014年智飞生物毛利率
表:2008-2013年智飞生物自产疫苗毛利率
表:2008-2013年智飞生物代理疫苗毛利率
图:2008-2013年智飞生物前五客户营业收入及占同期营业收入的比重
图:2008-2013年智飞生物研发投入及占同期营业收入的比重
表: 截至2013年底智飞生物在研产品其进度
图:2012-2017年智飞生物营业收入与营业利润预测
图:沃森生物产业布局
图:2009-2014年沃森生物营业收入与营业利润
表:2009-2013年沃森生物(分产品)营业收入
表:2009-2013年沃森生物(分产品)批签发量
表:2010-2013年沃森生物(分地区)营业收入
表:2007-2013年沃森生物(分产品)毛利率
图:2008-2013年沃森生物前五客户收入及占同期营业收入的比重
表:2013年沃森生物前五客户名称、收入贡献及占同期营业收入的比重
图:2008-2013年沃森生物前五供应商采购金额及占营业收入的比重
图: 2009-2013年沃森生物研发投入及占同期营业收入的比重
表:截至2013年底沃森生物在研产品及进度
图:2012-2017年沃森生物营业收入与营业利润预测
图:科兴生物股权结构
表:2008-2014年科兴生物营业收入与营业利润
表:2011-2013年科兴生物(分产品)疫苗销量
表:2008-2014年科兴生物(分产品)营业收入
表:2008-2013年科兴生物(分产品)疫苗批签发量
图:2008-2013年科兴生物研发投入及占同期营业收入的比重
图:2008-2014年辽宁成大营业收入与营业利润
表:2008-2013年辽宁成大(分行业)营业收入
表:2008-2013年辽宁成大(分地区)营业收入
表:2008-2014年辽宁成大(分行业)毛利率
图:2008-2013年辽宁成大前五客户收入及同期营业收入的比重
表:2013年辽宁成大前五客户名称、收入贡献及占同期营业收入的比重
表:2008-2013年辽宁成大疫苗业务收入及毛利率
图:2012-2017年辽宁成大营业收入与营业利润
图:2009-2013年百克生物营业收入与营业利润
图: 2008-2013年百克生物(分产品)疫苗批签发量
表:2008-2013年长春长生(分产品)批签发量
表: 浙江天元疫苗种类
表:2008-2013年浙江天元(分产品)疫苗批签发量疫苗
表:2007-2013年大连汉信(分剂型)乙肝疫苗批签发量
表:2009-2013年大连汉信(分产品)疫苗批签发量
表:2013年大连汉信部分在研疫苗
Classification of Vaccines
Vaccine Industry Chain
EPI Human Vaccine Varieties in China, 2013
Global Human Vaccine Market Scale, 2008-2013
Sales Value of the Global Top 5 Human Vaccine Manufacturers, 2008-2013
Top 10 Best-selling Vaccines Worldwide, 2013
Main Mergers & Acquisitions in the Vaccine Industry Worldwide, 2005- 2014
Policies in Vaccine Industry in China
Operating Revenue and Total Profit of Biological & Biochemical Product Industry in China, 2007- 2014
China’s Human Vaccine Market Scale, 2007-2013
Major Human Vaccine Varieties and Producers in China
Gross Margin of Major Human Vaccine Manufacturers in China, 2007-2013
The Release and Percentage (by Volume) of EPI and Extra EPI Vaccines in China, 2007-2013
China’s EPI Human Vaccine Market Shares by Release, 2008-2013
China’s Extra EPI Human Vaccine Market Shares by Release, 2008-2013
Vaccine Business Revenue of Key Vaccine Enterprises in China, 2011-2013
Development of Some New Vaccine in China by the end of Aug., 2014
Some Events Related to Vaccine Business of Foreign Enterprises in China, 2011-2013
Vaccine Distribution Channel in China
Lot Release Volume of Hepatitis B Vaccine in China by Dosage Form, 2007-2013
Hepatitis B Vaccine (CHO Cell) Suppliers and Lot Release Volume in China, 2008-2013
Hepatitis B Vaccine (Yeast) Suppliers and Lot Release Volume in China, 2007-2013
Market Prices of Hepatitis B Vaccine in Some Regions of China, 2014
Meningitis Morbidity and Mortality in China, 2008-2013
Meningococcal Vaccines Lot Release Volume in China by Type, 2007-2013
Suppliers and Lot Release Volume of A-Group Meningococcal Vaccines, 2007-2013
Suppliers and Lot Release Volume of A+C Meningococcal Vaccines, 2007-2013
Suppliers and Lot Release Volume of ACYW135 Meningococcal Vaccines in China, 2008-2013
Market Prices of Meningococcal Vaccines in Some Regions of China, 2014
Consumption Forecast of A-MCV, AC-MCV and ACYW135 in China, 2013-2017E
Hepatitis A Morbidity and Mortality in China, 2008-2013
Hepatitis A Vaccine Lot Release Volume in China, 2007-2013
Hepatitis A Vaccine Suppliers and Lot Release Volume in China, 2007-2013
Market Price of Hepatitis A Vaccine in China, 2014
Consumption Forecast of Hepatitis A Vaccine in China, 2013-2017E
Influenza Morbidity and Mortality in China, 2008-2013
H1N1 Influenza Morbidity and Mortality in China, 2009-2012
Lot Release Volume of Influenza Vaccine in China, 2007-2013
Suppliers and Lot Release Volume of Influenza Split Vaccine in China, 2007-2013
Influenza Subunit Vaccine Suppliers and Lot Release Volume in China, 2007-2012
Market Price of Influence Vaccine in China, 2014
Hib Vaccine Lot Release Volume in China, 2007-2013
Hib Vaccine Suppliers and Lot Release Volume in China, 2007-2013
Market Prices of Hib Vaccine in Some Regions of China, 2014
Sales Volume of Hib Vaccine in China, 2013-2017E
Rabies Morbidity and Mortality in China, 2007-2013
Human Rabies Vaccine Lot Release Volume in China, 2007-2013
Human Rabies Vaccine Lot Release Volume in China by Type, 2007-2013
Human Vero Cell Rabies Vaccine Suppliers and Lot Release Volume in China, 2007-2013
Human BHK Cell Rabies Vaccine Suppliers and Lot Release Volume in China, 2007-2013
Market Price of Human Rabies Vaccine in Some Regions of China, 2014
Demand Forecast of Human Rabies Vaccine in China, 2012-2015
Varicella Vaccine Lot Release Volume in China, 2007-2013
Suppliers and Lot Release Volume of Varicella Vaccine in China, 2007-2013
Market Price of Varicella Vaccine in Some Regions of China, 2014
Pneumococcal Vaccines Lot Release Volume in China, 2007-2013
Suppliers of 7-valent and 23-valent Pneumococcal Vaccines and Their Lot Release Volume in China, 2007-2013
Market Prices of Pneumococcal Vaccines in Some Regions of China, 2014
DTP Vaccine Lot Release Volume in China, 2007-2013
DTPa Vaccine Suppliers and Lot Release Volume in China, 2007-2013
Poliomyelitis Vaccine Lot Release Volume in China, 2007-2013
Poliomyelitis Vaccine Suppliers and Lot Release Volume in China, 2007-2013
Export Volume and Value of Human Vaccine in China, 2009- 2014
Export Average Unit Price of Human Vaccine in China, 2009- 2012
China’s Human Vaccine Export Volume and Value by Country, 2013
Import Volume and Value Human Vaccine in China, 2009- 2012
Import Average Unit Price of Human Vaccine in China, 2009- 2014
China’s Human Vaccine Import Volume and Value by Country, 2013
Major Shareholding Companies of Tiantan Biological and Their Revenue, Net Income, 2013
Revenue and Operating Income of Tiantan Biological, 2007-2014
Revenue Breakdown of Tiantan Biological by Sector, 2007-2013
Revenue Breakdown of Tiantan Biological by Region, 2007-2013
Tiantan Biological’s Procurement from Top 5 Suppliers and % of Total Procurement, 2007-2013
Tiantan Biological’s Revenue from Top 5 Customers and % of Total Revenue, 2007-2013
Name List and Revenue Contribution of Tiantan Biological’s Top 5 Customers, 2013
Gross Margin of Tiantan Biological by Sector, 2007-2013
R&D Costs and % of Total Revenue of Tiantan Biological, 2009-2013
Vaccine Revenue and Gross Margin of Tiantan Biological, 2007-2013
Lot Release Volume and Proportion of Beijing Tiantan Biological by Products, 2009-2013
Revenue and Operating Income of Tiantan Biological, 2012-2017E
Revenue and Operating Income of Hualan Biological, 2007-2013
Revenue Breakdown of Hualan Biological by Sector, 2007-2013
Revenue Breakdown of Hualan Biological by Product, 2007-2013
Gross Margin of Hualan Biological by Product, 2007-2014
Hualan Biological’s Revenue from Top 5 Customers and % of Total Revenue, 2007-2013
Hualan Biological’s Procurement from Top 5 Suppliers and % of Total Procurement, 2007-2012
R&D Costs and % of Total Revenue of Hualan Biological, 2007-2013
Lot Release Volume and Proportion of Hualan Biological by Products, 2011-2013
Vaccine Revenue and Gross Margin of Hualan Biological, 2008-2013
Revenue and Operating Income of Hualan Biological, 2012-2017E
Main Products of Zhifei Biological and Its Subsidiaries
Revenue and Operating Income of Zhifei Biological, 2007-2014
Revenue Breakdown of Zhifei Biological by Products, 2011-2012
Revenue Breakdown of Zhifei Biological by Products,20111-2013
Lot Release Volume and Proportion of Zhifei Biological by Products, 2011-2013
Revenue Breakdown of Zhifei Biological by Region, 2009-2013
Gross Margin of Zhifei Biological, 2009-2014
Gross Margin of Zhifei Biological’s Self- owned Products , 2008-2014
Gross Margin of Zhifei Biological’s Agent Products , 2008-2013
Zhifei Biological’s Revenue from Top 5 Clients and % of Total Revenue, 2008-2013
R&D Expenditure and Its Proportion to Revenue of Zhifei Biological, 2008-2013
Progress of the Products under Research of Zhifei Biological by the end of 2013
Revenue and Operating Income of Zhifei Biological, 2012-2017E
Industrial Layout of Walvax Biotechnology
Revenue and Operating Income of Walvax Biotechnology, 2009-2014
Revenu e Breakdown of Walvax Biotechnology by Sector, 2009-2013
Lot Release Volume and Proportion of Walvax Biotechnology by Products, 2009-2013
Revenue Breakdown of Walvax Biotechnology by Region, 2010-2013
Gross Margin of Walvax Biotechnology by Products, 2007-2013
Walvax Biotechnology’s Revenue from Top 5 Clients and % of Total Revenue, 2008-2013
Name List, Revenue Contribution and % to Total Revenue of Top 5 Clients of Walvax Biotechnology, 2013
Walvax Biological’s Procurement from Top 5 Suppliers and % of Total Procurement, 2008-2013
R&D Costs and % of Total Revenue of Walvax Biotechnology, 2009-2013
Progress of Products under Research of Walvax Biotechnology by the end of 2013
Revenue and Operating Income of Walvax Biotechnology, 2012-2017E
Equity Structure of Sinovac Biotech Ltd
Revenue and Profit of Sinovac Biotech Ltd., 2008-2014
Vaccine Sales Volume of Sinovac Biotech Ltd by Product, 2011-2013
Revenue Breakdown of Sinovac Biotech Ltd by Products, 2008-2014
Lot Release and Proportion of Sinovac Biotech Ltd., 2008-2013
R&D Expenditure and Its Proportion to Revenue of Sinovac Biotech Ltd.,2007-2013
Revenue and Operating Income of Liaoning Chengda, 2008-2014
Revenue Breakdown of Liaoning Chengda by Sector, 2008-2013
Revenue Breakdown of Liaoning Chengda byRegion, 2008-2013
Gross Margin of Liaoning Chengda by Sector, 2008-2014
Liaoning Chengda’s Revenue from Top 5 Customers and % of Total Revenue,2008-2013
Name List, Revenue Contribution and % to Total Revenue of Top 5 Customers of Liaoning Chengda, 2013
Vaccine Revenue and Gross Margin of Liaonig Chengda, 2008-2013
Revenue and Operating Income of Liaoning Chengda, 2012-2017E
Revenue and Operating Income of Changchun BCHT, 2009-2013
Lot Release and Proportion of Changchun BCHT, 2008-2013
Lot Release and Proportion of Changchun Changsheng by product, 2008-2013
Vaccines of Zhejiang Tianyuan Bio-Pharmaceutical
Lot Rlease and Proportion of Zhejiang Tianyuan Bio-Pharmaceutical by Product, 2008-2013
Lot Release and Market Share of Kangtai Biological Hepatitis B Vaccine, 2007-2013
Lot Release and Proportion of Hissen Bio-pharm, 2009-2013
Vaccine Projects of Hissen Bio-pharm, 2013
如果这份报告不能满足您的要求,我们还可以为您定制报告,请 留言说明您的详细需求。
|