|
|
|
报告导航:研究报告—
农业与食品—农业
|
|
2014-2017年全球及中国制糖行业研究报告 |
 |
字数:3.7万 |
页数:125 |
图表数:142 |
|
中文电子版:7500元 |
中文纸版:3750元 |
中文(电子+纸)版:8000元 |
|
英文电子版:2200美元 |
英文纸版:2350美元 |
英文(电子+纸)版:2500美元 |
|
编号:QJC012
|
发布日期:2014-08 |
附件:下载 |
 |
|
|
2008/09-2012/13年度,全球原糖产量CAGR为5.4%,其市场经历了从供不应求到供给过剩的转变。2013/14年度原糖产量有所下降,达到1.757亿吨。预计2014/15年度,全球原糖产量将继续下行,全球原糖高库存的局面有望开始扭转。
中国是全球重要的食糖生产国之一。2013/14年度,中国糖产量达1331.8万吨,同比增长1.9%,位于全球第三位。蔗糖是中国主要食糖品种,其产量占中国糖产量90%以上。广西由于甘蔗种植面积大,食糖产量居全国第一,2013年其产糖量占全国食糖产量的64.3%。
受甘蔗生产规律影响,中国甘蔗产量将进入下降通道,持续时间或将延续至2016/17榨季。同时,受自然环境、产业政策等因素的限制,未来中国糖产量增长空间有限。
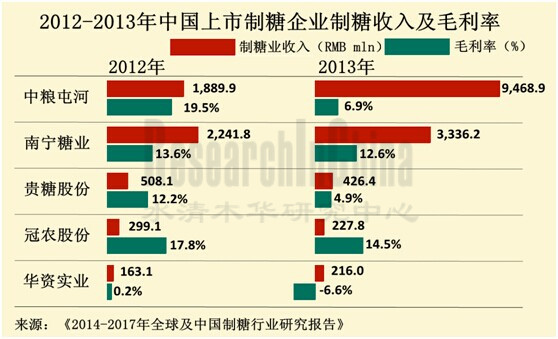
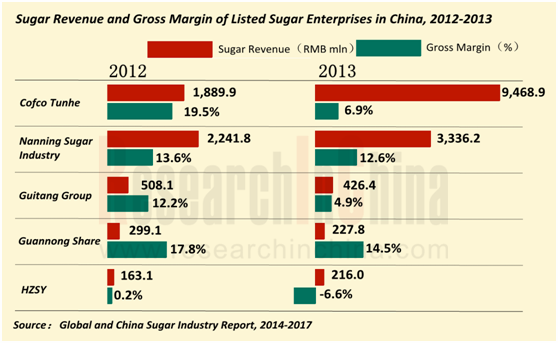
2012年以来,尽管下游需求保持增长,但受食糖价格走低和生产成本提高的影响,中国制糖企业亏损面提高。2014年上半年,中国多达66.0%的制糖企业出现亏损。尽管中国糖厂,尤其是中小型企业面临经营困境,但行业整合难度较大。
通过并购方式加快糖业整合符合政府期望,但大型制糖企业普遍面临现金短缺,并购不具备技术和成本优势的中小型企业不符合其本身利益。目前大型制糖企业如南宁糖业更倾向于采取技术改造的方式来提高制糖业务;而贵糖股份、冠农股份等公司则正通过压缩制糖业务,扩大其他产业的方式来扭转困境。
《2014-2017年全球及中国制糖行业研究报告》的内容主要包括以下几方面:
 全球制糖行业的发展现状、市场供需、进出口贸易、价格走势等; 全球制糖行业的发展现状、市场供需、进出口贸易、价格走势等;
中国制糖行业发展现状、市场供需、进出口贸易、价格走势、发展前景等;
中国制糖行业下游产业及竞争品行业发展现状、进出口贸易、发展前景等;
全球2家,中国11家主要制糖企业经营现状、投资并购、业务分析及发展预测等。
During 2008/09-2012/13, the global raw sugar output presented a CAGR of 5.4% as the market experienced a shift from a short supply to oversupply. In 2013-2014, the output of raw sugar somewhat declined to 175.7 million tons. It is predicted that in 2014/15 the global raw sugar output will continue to fall, and that high inventory of global sugar will thus be very likely to reverse.
As one of the world's important table sugar producers, China saw the sugar output of 13.318 million tons, up 1.9% from a year earlier, ranking the third place around the globe. Cane sugar is the major sugar variety in China, with its output accounting for over 90% of the total sugar output in the country. With larger planting area, Guangxi leads China in table sugar output, with its sugar output for 2013 occupying 64.3% of the national total.
Affected by the laws of sugarcane production, the sugarcane output in China will show a downward trend, which would probably last through 2016/17 season. On the other hand, restricted by the factors like natural environment and industry policies, China’s sugar output will grow by a limited margin.
Since 2012, despite a rising downstream demand, China’s sugar manufacturers has suffered great losses, hurt by lower table sugar prices and rising costs of production. In H1 2014, up to 66.0% of Chinese sugar producers made losses. Although sugar factories, especially small and medium-sized enterprises, were facing business difficulties, yet industry integration is difficult.
The acceleration of sugar industry integration through mergers and aquisitions is in line with the government’s expectation, but large sugar manufacturers are generally in a shortage of funds, and if they acquire small and medium-sized enterprises that have no technical and cost advantages, they would suffer losses. At present, some big sugar manufacturers like Nanning Sugar Industry are more inclined to take technological upgrading to improve sugar business while others such as Guangxi Guitang (Group) and Xinjiang Guannong Fruit & Antler Group would reverse the plight by cutting sugar business and expanding other industries.
Global and China Sugar Industry Report, 2014-2017 mainly deals with the followings:
Development status, supply and demand, import and export, price trend, etc. of global sugar industry;
Development status, supply and demand, import and export, price trend, development prospects, etc. of sugar industry in China
Development status, import and export, development prospects, etc. of downstream industries and rival commodities industries of sugar industry in China;
Operation, investment and M&A, business analysis, development forecast, etc. of 2 global and 11 Chinese major sugar companies.
第一章 制糖相关概念
1.1 制糖相关概念
1.2 制糖产业链
第二章 国际制糖行业发展概况
2.1 全球糖料生产概况
2.1.1 甘蔗生产
2.1.2 甜菜生产
2.2 全球原糖生产概况
2.2.1 供需分析
2.2.2 供给结构
2.2.3 国际贸易
2.2.4 糖价走势
2.3 主要国家分析
2.3.1 巴西
2.3.2 印度
2.3.3 泰国
2.3.4 澳大利亚
2.3.5 欧盟27国
2.3.6 美国
2.3.7 俄罗斯
第三章 中国制糖行业发展概况
3.1 政策环境
3.1.1 制糖行业“十二五”发展规划
3.1.2 国家储备制度
3.1.3 食糖进口关税制度
3.2 中国糖料生产
3.2.1 甘蔗
3.2.2 甜菜
3.3 中国食糖生产概况
3.3.1 食糖生产
3.3.2 需求
3.3.3 进出口
3.3.4 价格走势
3.4 制糖企业
第四章 中国制糖下游产业及替代品行业分析
4.1 下游行业
4.1.1 饮料行业
4.1.2 糖果行业
4.1.3 糕点行业
4.1.4 乳制品行业
4.2 替代品行业
4.2.1 淀粉糖
4.2.2 木糖醇
第五章 全球重点企业分析
5.1英联食品
5.1.1 企业简介
5.1.2 经营状况
5.1.3 营收构成
5.1.4 制糖业务
5.2 COSAN
5.2.1 企业简介
5.2.2 经营状况
5.2.3 营收构成
5.2.4 毛利率
5.2.5 甘蔗压榨业务
5.2.6 仓储业务
第六章 中国重点企业分析
6.1 南宁糖业
6.1.1 公司介绍
6.1.2 经营状况
6.1.3 营收构成
6.1.4 毛利率
6.1.5 客户情况
6.1.6 制糖业务
6.1.7 预测与展望
6.2 贵糖股份
6.2.1 公司介绍
6.2.2 经营状况
6.2.3 营收构成
6.2.4 毛利率
6.2.5 客户情况
6.2.6 制糖业务
6.2.7 预测与展望
6.3 中粮屯河
6.3.1 公司介绍
6.3.2 经营状况
6.3.3 营收构成
6.3.4 毛利率
6.3.5 客户情况
6.3.6 制糖业务
6.3.7 预测与展望
6.4 华资实业
6.4.1 公司介绍
6.4.2 经营状况
6.4.3 营收构成
6.4.4 毛利率
6.4.5 客户情况
6.4.6 制糖业务
6.4.7 预测与展望
6.5 冠农股份
6.5.1公司介绍
6.5.2经营状况
6.5.3营收构成
6.5.4毛利率
6.5.5客户情况
6.5.6制糖业务
6.5.7预测与展望
6.6 南华糖业
6.6.1 公司简介
6.6.2 经营情况
6.6.3 子公司
6.6.4 募资项目
6.7 东糖集团
6.7.1 公司简介
6.7.2 经营情况
6.7.3 子公司
6.8 农垦糖业
6.8.1 公司简介
6.8.2 子公司
6.9 英茂糖业
6.9.1 公司简介
6.9.2 经营情况
6.9.3 子公司
6.10 博天糖业
6.10.1 公司简介
6.10.2 子公司
6.11 恒福糖业
第七章 总结与展望
7.1 全球食糖产业
7.1.1 气候影响
7.1.2 市场价格
7.2 中国制糖业
7.2.1 增产空间
7.2.2 政策导向
7.2.3 市场价格
7.2.4 企业经营
1. Sugar Related Concepts
1.1 Sugar Related Concepts
1.2 Sugar Industry Chain
2. Development of Global Sugar Industry
2.1 Global Sugar Crop Production
2.1.1 Sugarcane
2.1.2 Beet
2.2 Global Raw Sugar Production
2.2.1 Supply & Demand
2.2.2 Supply Structure
2.2.3 International Trade
2.2.4 Sugar Price Trend
2.3 Major Countries
2.3.1 Brazil
2.3.2 India
2.3.3 Thailand
2.3.4 Australia
2.3.5 EU-27 Nations
2.3.6 USA
2.3.7 Russia
3. Development of China Sugar Industry
3.1 Policy Environment
3.1.1 12th Five-Year Development Plan for Sugar Industry
3.1.2 National Reserve System
3.1.3 Sugar Import Tariff System
3.2 Sugar Crop Production
3.2.1 Sugarcane
3.2.2 Beet
3.3 Overview of Table Sugar Production in China
3.3.1 Table Sugar Production
3.3.2 Demand
3.3.3 Import & Export
3.3.4 Price Trend
3.4 Sugar Enterprises
4. Downstream Industry & Alternatives Industry of China Sugar Industry
4.1 Downstream Industry
4.1.1 Beverage
4.1.2 Candy
4.1.3 Pastry
4.1.4 Dairy
4.2 Substitutes Industry
4.2.1 Starch Sugar
4.2.2 Xylitol
5. Global Key Companies
5.1 Associated British Foods plc
5.1.1 Profile
5.1.2 Operation
5.1.3 Revenue Structure
5.1.4 Sugar Business
5.2 COSAN
5.2.1 Profile
5.2.2 Operation
5.2.3 Revenue Structure
5.2.4 Gross Margin
5.2.5 Sugarcane Crushing Business
5.2.6 Warehousing Business
6. Key Companies in China
6.1 Nanning Sugar Industry Co., Ltd.
6.1.1 Profile
6.1.2 Operation
6.1.3 Revenue Structure
6.1.4 Gross Margin
6.1.5 Customers
6.1.6 Sugar Business
6.1.7 Forecast & Prospect
6.2 Guangxi Guitang (Group) Co., Ltd.
6.2.1 Profile
6.2.2 Operation
6.2.3 Revenue Structure
6.2.4 Gross Margin
6.2.5 Customers
6.2.6 Sugar Business
6.2.7 Forecast & Prospect
6.3 COFCO Tunhe
6.3.1 Profile
6.3.2 Operation
6.3.3 Revenue Structure
6.3.4 Gross Margin
6.3.5 Customers
6.3.6 Sugar Business
6.3.7 Forecast & Prospect
6.4 Baotou Huazi Industrial Co., Ltd.
6.4.1 Profile
5.4.2 Operation
6.4.3 Revenue Structure
6.4.4 Gross Margin
6.4.5 Customers
6.4.6 Sugar Business
6.4.7 Forecast & Prospect
6.5 Xinjiang Guannong Fruit & Antler Group Co., Ltd
6.5.1 Profile
6.5.2 Operation
6.5.3 Revenue Structure
6.5.4 Gross Margin
6.5.5 Customers
6.5.6 Sugar Business
6.5.7 Forecast & Prospect
6.6 Guangxi Yangpu Nanhua Sugar Industry Group Co., Ltd.
6.6.1 Profile
6.6.2 Operation
6.6.3 Subsidiaries
6.6.4 Fundraising Projects
6.7 Dongtang Group
6.7.1 Profile
6.7.2 Subsidiary
6.8 GuangXi State Farms Sugar Industrial Group Company Limited
6.8.1 Profile
6.8.2 Subsidiaries
6.9 Yunnan Yinmore Sugar Group Company Ltd.
6.9.1 Profile
6.9.2 Operation
6.9.3 Subsidiaries
6.10 Botian Sugar
6.10.1 Profile
6.10.2 Subsidiaries
6.11 Guangdong Hengfu Sugar Industry Group Co., Ltd.
7 Summary & Outlook
7.1 Global Tablet Sugar Industry
7.1.1 Climate Effect
7.1.2 Market Price
7.2 Sugar Industry in China
7.2.1 Yield Increase Potential
7.2.2 Policy Orientation
7.2.3 Market Price
7.2.4 Corporate Operation
图:制糖工业产业链
图:2006-2013年全球甘蔗产量
图:2006-2013年全球各大洲甘蔗产量占比
图:2006-2013年美洲各区域甘蔗产量占比
图:2006-2013年亚洲各区域甘蔗产量占比
表:2013年全球十大甘蔗主产国产量占比
图:2006-2013年全球甜菜产量
图:2006-2013全球各大洲甜菜产量占比
图:2006-2013欧洲各区域甜菜产量占比
图:2006-2013亚洲各区域甜菜产量占比
图:2006-2013美洲各区域甜菜产量占比
表:2013年全球十大甜菜主产国产量占比
图:2008/09-2014/15年度全球原糖产需量及库存
图:1970s-2000s全球蔗糖、甜菜糖产量占比
图:2008/09-2014/15年度全球原糖贸易量
图:2010-2014年ICE原糖主力合约月度平均价
图:2010-2014年LIFFE砂糖主力合约月度平均价
图:2008/09-2014/15年度巴西原糖产量及出口量
图:2013/14年度巴西原糖产量分布
图:2013/14年度巴西中南部各州原糖产量占比
图:2008/09-2014/15年度印度原糖产量及进出口量
图:2013/14年度印度各州甘蔗种植面积占比
图:2008/09-2014/15年度泰国原糖产量及出口量
图:2007/08-2014/15年度澳大利亚原糖产量及出口量
图:2008/09-2014/15年度欧盟27国原糖产量及进出口量
图:2008/09-2014/15年度美国原糖产量及进口量
图:2007/08-2013/14年度美国蔗糖、甜菜糖产量占比
图:FY2008-FY2014年美国糖进口结构
图:2008/09-2014/15年度俄罗斯原糖产量及进口量
图:2006-2013年中国糖料(分产品)产量占比
图:2003-2012年中国甘蔗种植面积及同比增长率
图:2006-2013年中国甘蔗产量及同比增长率
图:2013年中国甘蔗主产区产量占比
图:2003-2012年中国甜菜种植面积及同比增长率
图:2006-2013年中国甜菜产量及同比增长率
图:2013年中国甜菜主产区产量占比
图:2006/07-2013/14年度中国糖产量及同比增长率
图:2013/14年度中国食糖主产区产量占比
图:2007/08-2013/14年度中国蔗糖、甜菜糖产量占比
图:2007/08-2013/14年度中国蔗糖、甜菜糖产量
图:2008/09-2014/15年度中国原糖需求量
图:2005-2014年中国食糖进出口量
图:2014年1-6月中国主要食糖进口国占比
图:2001-2014年中糖协综合糖价均价走势图
图:2001-2014年中国制糖企业数量(单位:家)
图:2001-2014年中国制糖行业亏损企业占比
图:2001-2014年中国饮料制造企业数量(单位:家)
图:2006-2014年中国软饮料产量及同比增长
图:2008-2014年中国饮料企业主营收入与利润总额
图:2001-2014年中国糖果、巧克力、蜜饯制造企业数量(单位:家)
图:2006-2014年中国糖果产量及同比增长
图:2008-2014年中国糖果、巧克力、蜜饯制造主营收入与利润总额
图:2001-2014年中国糕点面包制造企业数量(单位:家)
图:2006-2010年中国糕点产量及同比增长
图:2008-2014年中国糕点面包企业主营收入与利润总额
图:2003-2014年中国乳制品制造企业数量(单位:家)
图:2008-2014年中国乳制品产量及同比增长
图:2008-2013年中国乳制品制造企业主营收入与利润总额
图:2006-2013年中国淀粉糖产量及同比增长
图:2009-2014年中国木糖醇出口量及同比增长率
图:2009-2014年中国木糖醇出口均价
图:FY2008-FY2014年英联食品营业收入及净利润
图:FY2008-FY2014年英联食品(分地区)营业收入占比
表:FY2008-FY2014年英联食品(分地区)营业收入
表:英联食品主要产业
图:FY2008-FY2014年英联食品(分产业)营业收入占比
表:FY2008-FY2014年英联食品(分产业)营业收入
图:FY2008-FY2014年英联食品制糖业务营业收入及利润
图:FY2008-FY2014年英联食品制糖业务毛利率
图:FY2009-FY2014年COSAN营业收入和净利润
表:FY2013年COSAN主要业务
图:FY2014年COSAN主要业务营业收入占比
表:FY2011-FY2014年COSAN主要业务营业收入
图:FY2011-FY2014年COSAN公司Raízen Combustíveis业务经营情况
图:FY2011-FY2014年COSAN公司Raízen Energia业务经营情况
图:FY2011-FY2014年COSAN公司Comgás业务经营情况
图:FY2009-FY2014年COSAN毛利及毛利率
表:FY2012-FY2013年COSAN甘蔗压榨量
表:FY2012-FY2013年COSAN甘蔗压榨产品产量
表:FY2012-FY2013年COSAN甘蔗业务营业收入及占比
表:FY2014年COSAN甘蔗业务营业收入及增长率
图:FY2011-FY2014年COSAN公司Comgás业务经营情况
图:2008-2014年南宁糖业营业收入和净利润
图:2008-2014年南宁糖业(分地区)主营业务收入占比
图:2008-2014年南宁糖业(分地区)营业收入
表:2008-2014年南宁糖业(分产品)主营业务收入占比
表:2008-2014年南宁糖业(分产品)营业收入
图:2008-2014年南宁糖业主营产品毛利率
图:2008-2014年南宁糖业前五名客户销售收入贡献及占比
表:2014年上半年南宁糖业前五名客户收入贡献及占比
图:2008-2013年南宁糖业机制糖产销量
图:2008-2014年南宁糖业机制糖营业收入及毛利率
图:2008-2014年南宁糖业机制糖(分产品)毛利率
图:2012-2017年南宁糖业营业收入及净利润预测
图:2008-2014年贵糖股份营业收入和净利润
表:2008-2014年贵糖股份(分地区)营业收入占比
表:2008-2014年贵糖股份(分地区)营业收入
表:2008-2014年贵糖股份(分产品)主营业务收入占比
图:2008-2014年贵糖股份(分产品)营业收入
图:2008-2014年贵糖股份综合毛利率
表:2008-2013年贵糖股份(分产品)毛利率
表:2008-2013年贵糖股份(地区)毛利率
图:2008-2014年贵糖股份前五名客户销售金额收入及占比
表:2013年贵糖股份前五名客户名称、收入贡献及占比
图:2008-2013年贵糖股份产糖量
图:2008-2014年贵糖股份机制糖营业收入及毛利率
图:2012-2017贵糖股份营业收入及净利润预测
图:2008-2014年中粮屯河营业收入和净利润
图:2008-2013年中粮屯河(分地区)主营业务收入占比
图:2008-2013年中粮屯河(分地区)营业收入
表:2008-2013年中粮屯河(分产品)主营业务收入占比
表:2008-2013年中粮屯河(分产品)营业收入
图:2008-2014年中粮屯河毛利率
图:2008-2013年中粮屯河前五名客户营业收入贡献及占比
表:2013中粮屯河前五名客户收入贡献及占比
图:2008-2013年中粮屯河制糖业营业收入及毛利率
表:2013年中粮屯河制糖相关子公司经营情况
图:2012-2017年中粮屯河营业收入及净利润预测
图:2008-2014年华资实业营业收入和净利润
图:2008-2012年华资实业(分地区)主营业务收入占比
图:2008-2012年华资实业(分地区)营业收入
表:2008-2013年华资实业(分产品)主营业务收入占比
表:2008-2013年华资实业(分产品)营业收入
图:2009-2013年华资实业制糖业毛利率
图:2008-2013年华资实业前五名客户销售收入贡献及占比
表:2013年华资实业前五名客户收入贡献及占比
图:2008-2014年冠农股份营业收入和净利润
图:2008-2014年冠农股份(分地区)主营业务收入占比
图:2008-2014年冠农股份(分地区)营业收入
表:2008-2014年冠农股份(分产品)主营业务收入占比
表:2008-2014年冠农股份(分产品)营业收入
表:2008-2013年冠农股份主要产品毛利率
图:2008-2014年冠农股份前五名客户销售收入贡献及占比
表:2014年上半年冠农股份前五名客户名称、收入贡献及占比
图:2008-2014年冠农股份制糖营业收入与毛利率
图:2012-2017年冠农股份营业收入及净利润预测
表:2010-2013年南华糖业营业收入
表:2011年南华糖业主要子公司及其制糖生产情况
表:2012年南华糖业募集资金投资项目情况表
图:2010-2011年英茂糖业销售收入及利润
表:2009/10-2013/14年英茂糖业甘蔗压榨量及糖产量
表:英茂糖业下属主要糖厂及其产能
Sugar Industry Chain
Global Sugarcane Output, 2006-2013
Global Sugarcane Output Structure (%) by Continent, 2006-2013
Sugarcane Output Structure (%) by Region in Americas, 2006-2013
Sugarcane Output Structure (%) by Region in Asia, 2006-2013
Output Structure (%) of Global Major Top 10 Sugarcane Producers, 2013
Global Beet Output, 2006-2013
Global Beet Output Structure (%) by Continent, 2006-2013
Beet Output Structure (%) by Region in Europe, 2006-2013
Beet Output Structure (%) by Region in Asia, 2006-2013
Beet Output Structure (%) by Region in Americas, 2006-2013
Output Structure (%) of Global Major Top 10 Beet Producers, 2013
Output, Demand and Inventory of Global Raw Sugar, 2008/09-2014/15
Output Structure (%) of Global Cane Sugar and Beet Sugar, 1970s-2000s
Trade Volume of Global Raw Sugar, 2008/09-2014/15
Nearby Futures Price of ICE Raw Sugar, 2010-2014
Nearby Futures Price of LIFFE Granulated Sugar, 2010-2014
Output and Export Volume of Raw Sugar in Brazil, 2008/09-2014/15
Output Breakdown of Raw Sugar in Brazil, 2013/14
Output Structure (%) of Raw Sugar by State in Southern and Central Brazil, 2013/14
Output and Import & Export Volume of Raw Sugar in India, 2008/09-2014/15
Sugarcane Cultivated Area Structure (%) by State in India, 2013/14
Output and Export Volume of Raw Sugar in Thailand, 2008/09-2014/15
Output and Export Volume of Raw Sugar in Australia, 2007/08-2014/15
Output and Import & Export Volume of Raw Sugar in EU-27, 2008/09-2014/15
Output and Import Volume of Raw Sugar in the US, 2008/09-2014/15
Output Structure (%) of Cane Sugar and Beet Sugar in the US, 2007/08-2013/14
Sugar Import Structure in the US, FY2008-FY2014
Output and Import Volume of Raw Sugar in Russia, 2008/09-2014/15
Output Structure (%) of Sugar Crops in China by Product, 2006-2013
Sugarcane Cultivated Area and YoY Growth in China, 2003-2012
Sugarcane Output and YoY Growth in China, 2006-2013
Output Structure (%) of Main Sugarcane Producing Areas in China, 2013
Beet Cultivated Area and YoY Growth in China, 2003-2012
Output and YoY Growth of Beet in China, 2006-2013
Output Structure (%) of Main Beet Producing Areas in China, 2013
Output and YoY Growth of Sugar in China, 2006/07-2013/14
Output Structure (%) of Main Table Sugar Producing Areas in China, 2013/14
Output Structure (%) of Cane Sugar and Beet Sugar in China, 2007/08-2013/14
Output of Cane Sugar and Beet Sugar in China, 2007/08-2013/14
Demand for Raw Sugar in China, 2008/09-2014/15
Import & Export Volume of Table Sugar in China, 2005-2014
Proportion of China’s Table Sugar Imports from Countries, 1-6/2014
Trend Chart for Comprehensive Sugar Average Price from China Sugar Association, 2001-2014
Number of Sugar Producing Enterprises in China, 2001-2014
Proportion of Loss-making Enterprises in China Sugar Industry, 2001-2014
Number of Beverage Producing Enterprises in China, 2001-2014
Output and YoY Growth of Soft Drinks in China, 2006-2014
Operating Revenue and Total Profit of Beverage Enterprises in China, 2008-2014
Number of Candy, Chocolate and Conserves Producing Enterprises in China, 2001-2014
Candy Output and YoY Growth in China, 2006-2014
Operating Revenue and Total Profit of Candy, Chocolate and Conserves Producing Enterprises in China, 2008-2014
Number of Pastry & Bread Package Manufacturers in China, 2001-2014
Pastry Output and YoY Growth in China, 2006-2010
Operating Revenue and Total Profit of Pastry & Bread Producers in China, 2008-2014
Number of Dairy Manufacturers in China, 2003-2014
Dairy Output and YoY Growth in China, 2008-2014
Operating Revenue and Total Profit of Dairy Manufacturers in China, 2008-2013
Output and YoY Growth of Starch Sugar in China, 2006-2013
Export Volume and YoY Growth of Xylitol in China, 2009-2014
Average Export Price of Xylitol in China, 2009-2014
Revenue and Net Income of ABF, FY2008-FY2014
Revenue Structure of ABF by Region, FY2008-FY2014
Revenue Breakdown of ABF by Region, FY2008-FY2014
Major Segments of ABF
Revenue Structure of ABF by Segment, FY2008-FY2014
Revenue Breakdown of ABF by Segment, FY2008-FY2014
ABF’s Revenue and Profit from Sugar Business, FY2008-FY2014
ABF’s Gross Margin from Sugar Business, FY2008-FY2014
Revenue and Net Income of COSAN, FY2009-FY2014
Main Business of COSAN, FY2013
Revenue Structure of COSAN by Business, FY2014
COSAN‘s Operating Revenue, FY2011-FY2014
COSAN’s Operation of Raízen Combustíveis, FY2011-FY2014
COSAN’s Operation of Raízen Energia, FY2011-FY2014
COSAN’s Operation of Comgás, FY2011-FY2014
COSAN’s Gross Profit and Gross Margin, FY2009-FY2014
COSAN’s Sugarcane Squeezing Volume, FY2012-FY2013
Output of COSAN’s Sugarcane Squeezing Products, FY2012-FY2013
COSAN’s Revenue from Sugarcane and % of Total Revenue, FY2012-FY2013
COSAN’s Revenue and Growth Rate of Sugarcane, FY2014
COSAN’s Operation of Comgás Business, FY2011-FY2014
Revenue and Net Income of Nanning Sugar Industry, 2008-2014
Operating Revenue Structure of Nanning Sugar Industry by Region, 2008-2014
Revenue Breakdown of Nanning Sugar Industry by Region, 2008-2014
Operating Revenue Structure of Nanning Sugar Industry by Product, 2008-2014
Revenue Breakdown of Nanning Sugar Industry by Product, 2008-2014
Gross Margin of Main Products of Nanning Sugar Industry, 2008-2014
Nanning Sugar Industry’s Revenue from Top 5 Clients and % of Total Revenue, 2008-2014
Nanning Sugar Industry’s Revenue from Top 5 Clients and % of Total Revenue, 2014H1
Output and Sales Volume of Machine-made Sugar of Nanning Sugar Industry, 2008-2013
Revenue and Gross Margin of Machine-made Sugar of Nanning Sugar Industry, 2008-2014
Machine-made Sugar Gross Margin of Nanning Sugar Industry by Product, 2008-2014
Revenue and Net Income of Nanning Sugar Industry, 2012-2017E
Revenue and Net Income of Guangxi Guitang (Group), 2008-2014
Revenue Structure of Guangxi Guitang (Group) by Region, 2008-2014
Revenue Breakdown of Guangxi Guitang (Group) by Region, 2008-2014
Operating Revenue Structure of Guangxi Guitang (Group) by Product, 2008-2014
Revenue Breakdown of Guangxi Guitang (Group) by Product, 2008-2014
Consolidated Gross Margin of Guangxi Guitang (Group), 2008-2014
Gross Margin of Guangxi Guitang (Group) by Product, 2008-2013
Gross Margin of Guangxi Guitang (Group) by Region, 2008-2013
Guangxi Guitang (Group)’s Revenue from Top 5 Clients and % of Total Revenue, 2008-2014
Name list and Revenue Contribution of Guangxi Guitang (Group)’s Top 5 Clients, 2013
Sugar Output of Guangxi Guitang (Group), 2008-2013
Revenue and Gross Margin of Machine-made Sugar of Guangxi Guitang (Group), 2008-2014
Revenue and Net Income of Guangxi Guitang (Group), 2012-2017E
Revenue and Net Income of COFCO Tunhe, 2008-2014
Operating Revenue Structure of COFCO Tunhe by Region, 2008-2013
Revenue Breakdown of COFCO Tunhe by Region, 2008-2013
Operating Revenue Structure of COFCO Tunhe by Product, 2008-2013
Revenue Breakdown of COFCO Tunhe by Product, 2008-2013
Gross Margin of COFCO Tunhe, 2008-2014
COFCO Tunhe’s Revenue from Top 5 Clients and % of Total Revenue, 2008-2013
COFCO Tunhe’s Revenue from Top 5 Clients and % of Total Revenue, 2013
Sugar Revenue and Gross Margin of COFCO Tunhe, 2008-2013
Operation of COFCO Tunhe’s Sugar Subsidiaries, 2013
Revenue and Net Income of COFCO Tunhe, 2012-2017E
Revenue and Net Income of Baotou Huazi Industrial, 2008-2014
Operating Revenue Structure of Baotou Huazi Industrial by Region, 2008-2012
Revenue Breakdown of Baotou Huazi Industrial by Region, 2008-2012
Operating Revenue Structure of Baotou Huazi Industrial by Product, 2008-2013
Revenue Breakdown of Baotou Huazi Industrial by Product, 2008-2013
Sugar Gross Margin of Baotou Huazi Industrial, 2009-2013
Baotou Huazi Industrial’s Revenue from Top 5 Clients and % of Total Revenue, 2008-2013
Baotou Huazi Industrial’s Revenue from Top 5 Clients and % of Total Revenue, 2013
Revenue and Net Income of Xinjiang Guannong Fruit & Antler Group, 2008-2014
Operating Revenue Structure of Xinjiang Guannong Fruit & Antler Group by Region, 2008-2014
Revenue Breakdown of Xinjiang Guannong Fruit & Antler Group by Region, 2008-2014
Operating Revenue Structure of Xinjiang Guannong Fruit & Antler Group by Product, 2008-2014
Revenue Breakdown of Xinjiang Guannong Fruit & Antler Group by Product, 2008-2014
Gross Margin of Main Products of Xinjiang Guannong Fruit & Antler Group, 2008-2013
Xinjiang Guannong Fruit & Antler Group’s Revenue from Top 5 Clients and % of Total Revenue, 2008-2014
Name List and Revenue Contribution of Xinjiang Guannong Fruit & Antler Group’s Top 5 Clients, 2014H1
Sugar Revenue and Gross Margin of Xinjiang Guannong Fruit & Antler Group, 2008-2014
Revenue and Net Income of Xinjiang Guannong Fruit & Antler Group, 2012-2017E
Revenue of Guangxi Yangpu Nanhua Sugar Industry Group, 2010-2013
Guangxi Yangpu Nanhua Sugar Industry Group’s Major Subsidiaries and Their Sugar Production, 2011
Fundraising Projects of Guangxi Yangpu Nanhua Sugar Industry Group, 2012
Revenue and Profit of Yunnan Yinmore Sugar Group, 2010-2011
Sugarcane Squeezing Volume and Sugar Output of Yunnan Yinmore Sugar Group, 2009/10-2013/14
Major Sugar Refineries and Capacity of Yunnan Yinmore Sugar Group
如果这份报告不能满足您的要求,我们还可以为您定制报告,请 留言说明您的详细需求。
|