|
|
|
报告导航:研究报告—
制造业—化工
|
|
2014-2017年全球及中国化学试剂行业研究报告 |
 |
字数:2.6万 |
页数:95 |
图表数:136 |
|
中文电子版:7000元 |
中文纸版:3500元 |
中文(电子+纸)版:7500元 |
|
英文电子版:2150美元 |
英文纸版:2300美元 |
英文(电子+纸)版:2450美元 |
|
编号:HK049
|
发布日期:2014-09 |
附件:下载 |
 |
|
|
化学试剂由工业级化学品提纯得到,主要服务于科学实验、检测分析,也大量应用于电子信息、医药、食品、航天军工等领域的生产制造。
2013年,全球化学试剂市场规模约达到136亿美元,市场需求主要集中于美国、欧洲和日本地区。化学试剂品种繁多,目前全球有25万种以上。美国Sigma-Aldrich是生产化学试剂品种最多的企业,达23万种左右。
全球化学试剂行业集中度较高,美国Sigma-Aldrich和德国Merck Group是行业领导者,2013年二者在全球化学试剂市场的份额之和达30%左右。
中国化学试剂行业发展较快,2007-2013年市场规模年均复合增长率达到15.9%,2013年市场规模占全球市场的比例为19.2%。化学试剂可分为通用试剂和高纯试剂两大类,2013年中国高纯试剂的市场规模占比约为26%。
高纯化学试剂主要应用于半导体工业,是化学试剂中发展最快、技术含量及附加值最高的产品。未来几年,随着中国电子信息、生物科技、国防军工等行业的快速发展,高纯试剂需求仍将保持15%左右的增长速度。
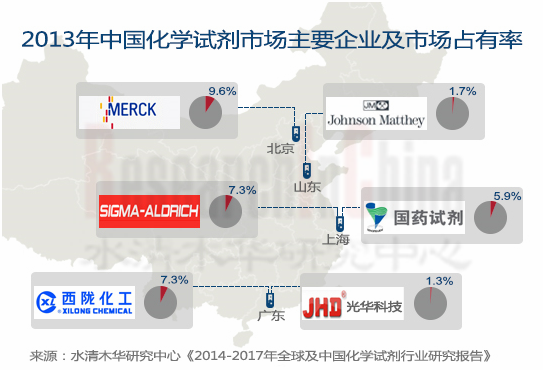
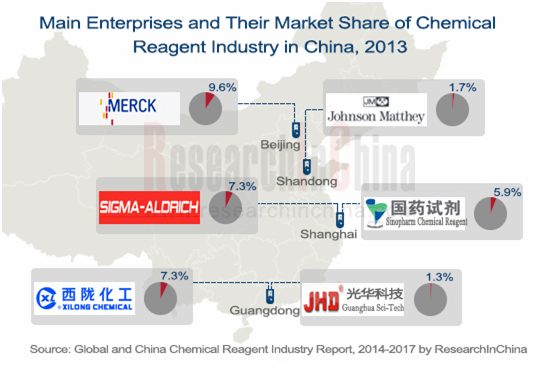
2013年,中国获得生产许可的化学试剂企业有400多家,大部分企业以中低端产品为主,导致中低端市场竞争激烈;而高端市场主要被国际企业占据,如德国Merck Group和美国Sigma-Aldrich2013年其在中国的市场占有率之和达16.9%。
近年来,中国化学试剂行业的集中度在逐步提高,大型化学试剂公司发展迅速。并且国产化学试剂也正逐步由低端向中高端扩展,部分产品已实现进口替代。典型企业如西陇化工、国药试剂等,2013年二者的市场占有率之和达13.2%。
水清木华研究中心《2014-2017年全球及中国化学试剂行业研究报告》主要包括以下几个内容:
 全球化学试剂市场规模、竞争格局等; 全球化学试剂市场规模、竞争格局等;
中国化学试剂市场规模、进出口、竞争格局、价格分析及2014-2017年行业发展预测等;
中国通用试剂、PCB用试剂(属于通用试剂中的高端品种,本报告单独列为一类)、高纯试剂等细分市场规模及2014-2017年各细分市场发展预测等;
全球及中国15家化学试剂生产企业的经营分析、化学试剂业务、发展及预测等。
Chemical reagent, purified from industrial chemicals, serves chiefly scientific experiment and detection analysis, and finds massive application in electronic information, medicine, food, aerospace and military industry manufacturing.
In 2013, global chemical reagent market was worth about USD 13.6 billion, with market demand concentrated in United States, Europe and Japan. There are a large variety of chemical reagents, totaling above 250,000 around the world. American Sigma-Aldrich is the company that produces the most varieties of chemical reagents, up to approximate 230,000.
Global chemical reagent industry characterizes a fairly high concentration, and American Sigma-Aldrich and German Merck Group, as industry leaders, took up a combined 30% or so market share globally in 2013.
China chemical reagent industry has developed quickly, achieving a CAGR of 15.9% as concerns market size during 2007-2013, and making up 19.2% of global market size. Chemical reagent can be divided into general reagent and high-purity reagent, with the latter accounting for about 26% of total market size in China in 2013.
High-purity chemical reagent is mainly used in semiconductor industry, and is the product that enjoys the fastest growth rate and has the highest technical content and added value. With the rapid development of China's electronic information, biotechnology, national defense, military industry and other industries, the demand for high purity reagent will keep a roughly 15% growth rate over the next couple years.
In 2013, there were more than 400 chemical reagent producers with production licenses in China, most of which focused on low-end products, resulting in fierce competition in the low-end market; by contrast, the high-end market is dominated by transnational companies, such as German Merck Group and American Sigma-Aldrich, which held a combined 16.9% market share in China in 2013.
In recent years, concentration of China chemical reagent industry has been improving gradually, mainly reflected by rapid development of large chemical reagent companies. Moreover, China-made chemical reagents are advancing from the low-end to the middle and high-end, with some imported products having been substituted with domestic ones. Typical domestic companies include Xilong Chemical Co., Ltd. and Sinopharm Chemical Reagent Co., Ltd., together occupying 13.2% of the Chinese market in 2013.
Global and China Chemical Reagent Industry Report, 2014-2017 by ResearchInChina focuses on the following:
Size and competitive landscape of global chemical reagent market;
Size, import & export, competitive landscape, price of and forecast for development during 2014-2017 of the Chinese chemical reagent market;
Size of market segments (general reagent, reagent for PCB (a high-end variety in general reagent, separately listed in the report), high purity reagent) in China, and forecast for development of market segments during 2014-2017;
Operation, chemical reagent business, development of and forecast for 15 global and Chinese chemical reagent producers.
第一章 化学试剂概述
1.1 定义
1.2 分类
1.3 应用
1.4 产业链
第二章 化学试剂市场分析
2.1 全球市场
2.2.1 概述
2.2.2 市场规模
2.2.3 竞争格局
2.2 中国市场
2.2.1 概述
2.2.2 行业运营
2.2.3 市场规模
2.2.4 产量分析
2.2.5 进出口分析
2.2.6 竞争格局
2.2.7 价格分析
第三章 中国化学试剂细分市场分析
3.1 通用化学试剂
3.2 PCB用化学试剂
3.3 高纯化学试剂
第四章 国外企业分析
4.1 Sigma-Aldrich
4.1.1 公司简介
4.1.2 经营情况
4.1.3 营收构成
4.1.4 各部门营收构成
4.1.5 研发
4.1.6 化学试剂业务
4.2 Merck Group
4.2.1 公司简介
4.2.2 经营情况
4.2.3 营收构成
4.2.4 Merck Millipore部门经营情况
4.2.5 研发
4.2.6 化学试剂业务
4.3 Johnson Matthey
4.3.1 公司简介
4.3.2 经营情况
4.3.3 精细化工部门经营情况
4.3.4 研发
4.3.5 化学试剂业务
4.4 Thermo Fisher
4.4.1 公司简介
4.4.2 经营情况
4.3.3 营收构成
4.3.4 利润构成
4.3.5 化学试剂业务
4.5 TCI
4.5.1 公司简介
4.5.2 化学试剂业务
4.5.3 在华业务
4.6 Wako
4.6.1 公司简介
4.6.2 经营情况
4.6.3 化学试剂业务
4.7 Danaher
4.7.1 公司简介
4.7.2 经营情况
4.7.3 营收构成
4.7.4 环境部门经营情况
4.7.5 Hach公司
第五章 中国企业分析
5.1 西陇化工
5.1.1 企业简介
5.1.2 经营情况
5.1.3 营收构成
5.1.4 毛利率
5.1.5 研发
5.1.6 化学试剂业务
5.1.7 预测与展望
5.2 光华科技
5.2.1 企业简介
5.2.2 经营情况
5.2.3 营收构成
5.2.4 毛利率
5.2.5 研发
5.2.6 客户及供应商
5.2.7 化学试剂业务
5.2.8 预测与展望
5.3 国药控股
5.3.1 企业简介
5.3.2 经营情况
5.3.3 营收构成
5.3.4 化学试剂业务
5.3.5 国药试剂
5.4 苏州晶瑞
5.4.1 企业简介
5.4.2 化学试剂业务
5.5 江阴试剂
5.5.1 企业简介
5.5.2 化学试剂业务
5.6 江化微电子
5.6.1 公司简介
5.6.2 化学试剂业务
5.7 苏州晶协
5.7.1 企业简介
5.7.2 化学试剂业务
5.8 安徽时联
5.8.1 企业简介
5.8.2 化学试剂业务
第六章 总结及预测
6.1 总结
6.2 市场规模预测
1. Overview of Chemical Reagent
1.1 Definition
1.2 Classification
1.3 Application
1.4 Industrial Chain
2. Chemical Reagent Market
2.1 Global
2.1.1 Overview
2.1.2 Market Size
2.1.3 Competitive Landscape
2.2 China
2.2.1 Overview
2.2.2 Industry Operation
2.2.3 Market Size
2.2.4 Output
2.2.5 Import and Export
2.2.6 Competitive Landscape
2.2.7 Price
3. Chinese Chemical Reagent Market
3.1 General Chemical Reagent
3.2 Chemical Reagent for PCB
3.3 High-purity Chemical Reagent
4. Foreign Companies
4.1 Sigma-Aldrich
4.1.1 Profile
4.1.2 Operation
4.1.3 Revenue Structure
4.1.4 Revenue Structure by Division
4.1.5 R&D
4.1.6 Chemical Reagent Business
4.2 Merck Group
4.2.1 Profile
4.2.2 Operation
4.2.3 Revenue Structure
4.2.4 Operation of Merck Millipore
4.2.5 R&D
4.2.6 Chemical Reagent Business
4.3 Johnson Matthey
4.3.1 Profile
4.3.2 Operation
4.3.3 Operation of Refined Chemicals Division
4.3.4 R&D
4.3.5 Chemical Reagent Business
4.4 Thermo Fisher
4.4.1 Profile
4.4.2 Operation
4.4.3 Revenue Structure
4.4.4 Profit Structure
4.4.5 Chemical Reagent Business
4.5 TCI
4.5.1 Profile
4.5.2 Chemical Reagent Business
4.5.3 Business in China
4.6 Wako
4.6.1 Profile
4.6.2 Operation
4.6.3 Chemical Reagent Business
4.7 Danaher
4.7.1 Profile
4.7.2 Operation
4.7.3 Revenue Structure
4.7.4 Operation of Environmental Division
4.7.5 Hach
5. Chinese Companies
5.1 Xilong Chemical Co., Ltd.
5.1.1 Profile
5.1.2 Operation
5.1.3 Revenue Structure
5.1.4 Gross Margin
5.1.5 R&D
5.1.6 Chemical Reagent Business
5.1.7 Forecast and Outlook
5.2 Guangdong Guanghua Sci-Tech Co., Ltd
5.2.1 Profile
5.2.2 Operation
5.2.3 Revenue Structure
5.2.4 Gross Margin
5.2.5 R&D
5.2.6 Customers and Suppliers
5.2.7 Chemical Reagent Business
5.2.8 Forecast and Outlook
5.3 Sinopharm Group Co., Ltd.
5.3.1 Profile
5.3.2 Operation
5.3.3 Revenue Structure
5.3.4 Chemical Reagent Business
5.3.5 Sinopharm Chemical Reagent Co., Ltd.
5.4 Suzhou Crystal Clear Chemical Co., Ltd
5.4.1 Profile
5.4.2 Chemical Reagent Business
5.5 Jiangyin Chemical Reagent Factory
5.5.1 Profile
5.5.2 Chemical Reagent Business
5.6 Jianghua Microelectronics Materials Co., Ltd.
5.6.1 Profile
5.6.2 Chemical Reagent Business
5.7 Suzhou JIMCEL Electronic New Material Co. Ltd.
5.7.1 Profile
5.7.2 Chemical Reagent Business
5.8 Anhui Fulltime Specialized Solvent & Reagent Co., Ltd
5.8.1 Profile
5.8.2 Chemical Reagent Business
6. Summary and Forecast
6.1 Summary
6.2 Market Size Forecast
表:化学试剂主要分类
表:化学试剂(按纯度)分类
表:双氧水产品应用情况
表:盐酸产品应用情况
图:化学试剂产业链
表:全球化学试剂行业发展规律
表:全球化学试剂行业主要生产企业
表:2013年全球化学试剂行业主要企业及市场占有率
表:中国化学试剂行业发展历程
图:2007-2014年中国化学试剂和助剂制造行业主营业务收入及增长率
图:2007-2014年中国化学试剂和助剂制造行业利润总额及增长率
图:2007-2013年中国化学试剂行业市场规模
图:2013年中国化学试剂产品结构
图:2009-2014年中国化学试剂产量及增长率
图:2013年中国化学试剂(分地区)产量占比
图:2009-2014年中国诊断及化学试剂进出口量
图:2009-2014年中国诊断及化学试剂进出口额
图:2009-2014年中国诊断及化学试剂进出口价格
图:2013年中国诊断及化学试剂进口来源(按进口额)
图:2013年中国诊断及化学试剂出口目的地(按出口额)
图:2013年中国诊断及化学试剂主要进口城市及其进口额占比
图:2013年中国诊断及化学试剂主要出口城市及其出口额占比
表:2013年中国化学试剂市场主要企业在华收入及市场占有率
表:中国化学试剂生产企业及其主要产品
图:2007-2014年中国氢氧化钠(试剂级)价格走势
图:2009-2013年中国通用化学试剂市场规模
图:2008-2013年中国PCB产值及增长率
图:2009-2013年中国PCB用化学试剂市场规模
图:2008-2013年中国半导体产业市场规模及增长率
图:2009-2013年中国高纯化学试剂市场规模
表:Sigma-Aldrich业务部门及主要业务
图:2009-2014年Sigma-Aldrich销售收入和净利润
表:2012-2014年Sigma-Aldrich(分部门)销售收入
图:2012-2014年Sigma-Aldrich(分部门)销售收入占比
表:2012-2014年Sigma-Aldrich(分地区)销售收入
表:2012-2014年Sigma-Aldrich(分地区)销售收入占比
图:2013年Sigma-Aldrich的Research部门(分业务)销售收入占比
图:2013年Sigma-Aldrich的Research部门(分地区)销售收入占比
图:2013年Sigma-Aldrich的Applied部门(分业务)销售收入占比
图:2013年Sigma-Aldrich的Applied部门(分地区)销售收入占比
图:2013年Sigma-Aldrich的SAFC Commercial部门(分业务)销售收入占比
图:2013年Sigma-Aldrich的SAFC Commercial部门(分地区)销售收入占比
图:2011-2013年Sigma-Aldrich研发支出及占销售收入的比例
表:Merck Group业务部门及主要业务
图:2009-2014年Merck Group销售收入和EBITDA
表:2012-2014年Merck Group(分部门)销售收入
图:2012-2014年Merck Group(分部门)销售收入占比
表:2012-2014年Merck Group(分地区)销售收入
图:2012-2014年Merck Group(分地区)销售收入占比
图:2012-2014年Merck Group的Merck Millipore部门销售收入及EBITDA
表:2012-2014年Merck Group的Merck Millipore部门(分业务)销售收入
图:2012-2014年Merck Group的Merck Millipore部门(分业务)销售收入占比
表:2012-2014年Merck Group的Merck Millipore部门(分地区)销售收入
图:2012-2014年Merck Group的Merck Millipore部门(分地区)销售收入占比
图:2011-2013年Merck Group研发支出及占销售收入的比例
图:2013年Merck Group(分部门)研发支出占比
表:Merck Group全球主要化学试剂生产基地
图:2009-2013财年Johoson Matthey销售收入和EBITDA
图:2013财年Johoson Matthey(分部门)销售收入占比
表:2013财年Johoson Matthey(分地区)销售收入占比
图:2011-2013财年Johoson Matthey精细化工部门销售收入及营业利润
表:2012-2013财年Johoson Matthey精细化工部门(分业务)销售收入
图:2012-2013财年Johoson Matthey精细化工部门(分业务)销售收入占比
表:2013财年Johoson Matthey精细化工部门(分地区)销售收入占比
图:2011-2013财年Johoson Matthey研发支出及占销售收入的比例
图:2013财年Johoson Matthey(分部门)研发支出占比
表:Fisher业务部门及主要业务
图:2009-2013年Thermo Fisher营业收入和净利润
表:2011-2013年Thermo Fisher(分部门)营业收入
表:2011-2013年Thermo Fisher(分部门)营业收入占比
表:2011-2013年Thermo Fisher(分地区)营业收入
图:2011-2013年Thermo Fisher(分地区)销售收入占比
表:2011-2013年Thermo Fisher(分部门)营业利润
图:2011-2013年Thermo Fisher(分部门)营业利润占比
图:2011-2013年Thermo Fisher(分部门)营业利润率
表:TCI主营产品
表:2013年TCI全球子公司
表:TCI中国发展情况
表:2013财年Wako销售收入及资产总额
表:Wako化学试剂产品分类
表:Wako全球生产基地
图:2009-2013年Danaher销售收入和净利润
表:2011-2013年Danaher(分部门)销售收入
表:2011-2013年Danaher(分部门)销售收入占比
表:2011-2013年Danaher(分地区)销售收入
图:2011-2013年Danaher(分地区)销售收入占比
图:2011-2013年Danaher环境部门销售收入及营业利润
图:2011-2013年Danaher环境部门营业利润率
表:Hach化学试剂分类及主要品种
表:Hach化学试剂应用领域
图:2009-2014年西陇化工营业收入和净利润
表:2012-2014年西陇化工(分产品)营业收入
图:2012-2014年西陇化工(分产品)营业收入占比
表:2012-2014年西陇化工(分地区)营业收入
表:2012-2014年西陇化工(分地区)营业收入占比
图:2012-2014年西陇化工主营产品毛利率
图:2011-2013年西陇化工研发支出及占营业收入的比例
表:2008-2010年西陇化工(分产品)产量
表:截止2014年6月30日西陇化工主要子公司情况
表:截止2014年6月30日西陇化工子公司营业收入和净利润
表:截止2014年6月30日西陇化工主要在建项目进展情况
表:2013-2017年西陇化工营业收入和净利润预测
图:2011-2013年光华科技营业收入和净利润
表:2011-2013年光华科技(分产品)营业收入
图:2011-2013年光华科技(分产品)营业收入占比
表:2011-2013年光华科技(分地区)营业收入
图:2011-2013年光华科技(分地区)营业收入占比
图:2011-2013年光华科技(分产品)毛利率
图:2011-2013年光华科技研发支出及占营业收入的比例
图:2011-2013年光华科技前五名客户贡献收入及占比
表:2013年光华科技前五名客户名称、收入贡献及占比
图:2011-2013年光华科技前五名供应商采购金额及占比
表:2013年光华科技前五名供应商名称、采购金额及占比
图:2011-2013年光华科技化学试剂产能、产量及开工率
图:2011-2013年光华科技化学试剂销量及产销率
图:2011-2013年光华科技化学试剂平均销售价格
表:2013-2017年光华科技营业收入和净利润预测
表:国药控股主要业务
表:2009-2014年上海赛科营业收入和净利润
表:2012-2014年国药控股(分产品)营业收入
图:2012-2014年国药控股(分产品)营业收入占比
图:2011-2014年国药控股其他业务部门营业收入和营业利润
图:2011-2014年国药控股其他业务部门营业利润率
表:国药试剂产品品牌概述
表:苏州晶瑞化学试剂产品分类及应用
表:江阴试剂化学试剂产品及分类
表:2013年江阴试剂化学试剂品种及其产能
表:江阴试剂化学试剂应用领域及主要客户
表:江化微电子化学试剂分类及主要品种
表:苏州晶协主营业务及产品
表:安徽时联化学试剂分类及用途
表:2013年安徽时联主要产品产能
表:2013年全球及中国主要化学试剂生产企业收入对比
表:2017年全球与中国化学试剂市场规模对比
图:2013-2017年中国化学试剂市场规模预测
图:2013-2017年中国化学试剂产品结构预测
Main Categories of Chemical Reagent
Classification of Chemical Reagent by Purity
Application of Hydrogen Peroxide Products
Application of Hydrochloric Acid Products
Chemical Reagent Industrial Chain
Law of Development of Global Chemical Reagent Industry
Major Global Chemical Reagent Producers
Major Global Chemical Reagent Producers and Their Market Shares, 2013
Development Course of China Chemical Reagent Industry
Operating Revenue and Growth Rate of China Chemical Reagent and Auxiliary Manufacturing, 2007-2014
Total Profit and Growth Rate of China Chemical Reagent and Auxiliary Manufacturing, 2007-2014
Market Size of China Chemical Reagent Industry, 2007-2013
Structure of Chemical Reagent Products in China, 2013
China’s Chemical Reagent Output and Growth Rate, 2009-2014
Chemical Reagent Output Structure in China (by Region), 2013
Import and Export Volume of Diagnostic and Chemical Reagents in China, 2009-2014
Import and Export Value of Diagnostic and Chemical Reagents in China, 2009-2014
Import and Export Prices of Diagnostic and Chemical Reagents in China, 2009-2014
Sources of Imported Diagnostic and Chemical Reagents by China (by Import Value), 2013
Destinations of Exported Diagnostic and Chemical Reagents from China (by Export Value), 2013
Major Importing Cities of Diagnostic and Chemical Reagents and Their Import Value Percentages in China, 2013
Major Exporting Cities of Diagnostic and Chemical Reagents and Their Import Value Percentages in China, 2013
Revenue from China and Market Shares of Major Companies in Chinese Chemical Reagent Market, 2013
Chemical Reagent Producers and Their Main Products in China
Price Trend of Sodium Hydroxide (Reagent Grade) in China, 2007-2014
Chinese General Chemical Reagent Market Size, 2009-2013
China’s PCB Output Value and Growth Rate, 2008-2013
Chinese Chemical Reagent for PCB Market Size, 2009-2013
Chinese Semiconductor Industry Market Size and Growth Rate, 2008-2013
Chinese High Purity Chemical Reagent Market Size, 2009-2013
Sigma-Aldrich’s Business Divisions and Their Main Businesses
Revenue and Net Income of Sigma-Aldrich, 2009-2014
Revenue Breakdown of Sigma-Aldrich (by Unit), 2012-2014
Revenue Structure of Sigma-Aldrich (by Unit), 2012-2014
Revenue Breakdown of Sigma-Aldrich (by Region), 2012-2014
Revenue Structure of Sigma-Aldrich (by Region), 2012-2014
Revenue Structure of Sigma-Aldrich’s Research Unit (by Business), 2013
Revenue Structure of Sigma-Aldrich’s Research Unit (by Region), 2013
Revenue Structure of Sigma-Aldrich’s Applied Unit (by Business), 2013
Revenue Structure of Sigma-Aldrich’s Applied Unit (by Region), 2013
Revenue Structure of Sigma-Aldrich’s SAFC Commercial Unit (by Business), 2013
Revenue Structure of Sigma-Aldrich’s SAFC Commercial Unit (by Region), 2013
R&D Costs and % of Revenue of Sigma-Aldrich, 2011-2013
Merck Group’s Business Segments and Main Business
Revenue and EBITDA of Merck Group, 2009-2014
Merck Group’s Revenue (by Segment), 2012-2014
Revenue Structure of Merck Group (by Segment), 2012-2014
Merck Group’s Revenue (by Region), 2012-2014
Revenue Structure of Merck Group (by Region), 2012-2014
Revenue and EBITDA of Merck Group’s Merck Millipore Division, 2012-2014
Revenue of Merck Group’s Merck Millipore Division (By Business), 2012-2014
Revenue Structure of Merck Group’s Merck Millipore Division (By Business), 2012-2014
Revenue of Merck Group’s Merck Millipore Division (by Region), 2012-2014
Revenue Structure of Merck Group’s Merck Millipore Division (by Region), 2012-2014
R&D Costs and % of Total Revenue of Merck Group, 2011-2013
R&D Cost Proportion of Merck Group (by Segment), 2013
Major Global Chemical Reagent Production Bases of Merck Group
Revenue and EBITDA of Johnson Matthey, FY 2009-2013
Revenue Structure of Johnson Matthey (by Segment), FY 2013
Revenue Structure of Johnson Matthey (by Region), FY 2013
Revenue and Operating Income of Johnson Matthey’s Fine Chemicals Division, FY 2011-2013
Revenue of Johnson Matthey Fine Chemicals Division (By Business), FY 2012-2013
Revenue Structure of Johnson Matthey Fine Chemicals Division (By Business), FY 2012-2013
Revenue Structure of Johnson Matthey Fine Chemicals Division (by Region), FY 2013
R&D Costs and % of Total Revenue of Johnson Matthey, FY 2011-2013
R&D Cost Proportion of Johnson Matthey (by Segment), FY 2013
Fisher’s Business Segments and Main Business
Revenue and Net Income of Thermo Fisher, 2009-2013
Revenue of Thermo Fisher (by Segment), 2011-2013
Revenue Structure of Thermo Fisher (by Segment), 2011-2013
Revenue of Thermo Fisher (by Region), 2011-2013
Revenue Structure of Thermo Fisher (by Region), 2011-2013
Operating Income of Thermo Fisher (by Segment), 2011-2013
Operating Income Proportion of Thermo Fisher (by Segment), 2011-2013
Operating Margin of Thermo Fisher (by Segment), 2011-2013
TCI’s Main Products
TCI’s Global Subsidiaries, 2013
TCI’s Developments in China
Revenue and Total Assets of Wako, 2013 FY
Classification of Chemical Reagent Products of Wako
Wako’s Global Production Bases
Revenue and Net Income of Danaher, 2009-2013
Danaher’s Revenue (by Segment), 2011-2013
Revenue Structure of Danaher (by Segment), 2011-2013
Danaher’s Revenue (by Region), 2011-2013
Revenue Structure of Danaher (by Region), 2011-2013
Revenue and Operating Income of Danaher’s Environment Division, 2011-2013
Operating Margin of Danaher’s Environment Division, 2011-2013
Classification and Major Varieties of Hach’s Chemical Reagent
Applications of Hach’s Chemical Reagent
Revenue and Net Income of Xilong Chemical, 2009-2014
Revenue of Xilong Chemical (by Product), 2012-2014
Revenue Structure of Xilong Chemical (by Product), 2012-2014
Revenue of Xilong Chemical (by Region), 2012-2014
Revenue Structure of Xilong Chemical (by Region), 2012-2014
Xilong Chemical’s Gross Margin of Main Products, 2012-2014
R&D Costs and % of Total Revenue of Xilong Chemical, 2011-2013
Output of Xilong Chemical (by Product), 2008-2010
Major Subsidiaries of Xilong Chemical, as of June 30, 2014
Revenue and Net Income of Xilong Chemical’s Subsidiaries, as of June 30, 2014
Progress of Xilong Chemical’s Major Ongoing Projects, as of June 30, 2014
Revenue and Net Income of Xilong Chemical, 2013-2017E
Revenue and Net Income of Guanghua Sci-Tech, 2011-2013
Revenue of Guanghua Sci-Tech (by Product), 2011-2013
Revenue Structure of Guanghua Sci-Tech (by Product), 2011-2013
Revenue of Guanghua Sci-Tech (by Region), 2011-2013
Revenue Structure of Guanghua Sci-Tech (by Region), 2011-2013
Gross Margin of Guanghua Sci-Tech (by Product), 2011-2013
R&D Costs and % of Total Revenue of Guanghua Sci-Tech, 2011-2013
Guanghua Sci-Tech’s Revenue from Top 5 Clients and % of Total Revenue, 2011-2013
Name list and Revenue Contribution of Guanghua Sci-Tech’s Top 5 Clients, 2013
Guanghua Sci-Tech’s Procurement from Top 5 Suppliers and % of Total Procurement, 2011-2013
Name list and Revenue Contribution of Guanghua Sci-Tech’s Top 5 Clients, 2013
Guanghua Sci-Tech’s Capacity, Output, and Operating Rate of Chemical Reagent, 2011-2013
Sales Volume and Sales-output Ratio of Chemical Reagent of Guanghua Sci-Tech, 2011-2013
Guanghua Sci-Tech’s ASP of Chemical Reagent, 2011-2013
Revenue and Net Income of Guanghua Sci-Tech, 2013-2017E
Main Business of Sinopharm Group
Revenue and Net Income of Shanghai SECCO Petrochemical, 2009-2014
Revenue of Sinopharm Group (by Product), 2012-2014
Revenue Structure of Sinopharm Group (by Product), 2012-2014
Revenue and Operating Income of Sinopharm Group’s Other Divisions, 2011-2014
Operating Margin of Sinopharm Group’s Other Divisions, 2011-2014
Overview of Product Brands of Sinopharm Chemical Reagent
Classification and Application of Chemical Reagent Products of Suzhou Crystal Clear Chemical
Classification and Application of Chemical Reagent Products of Jiangyin Chemical Reagent Factory
Varieties and Capacity of Chemical Reagent of Jiangyin Chemical Reagent Factory, 2013
Chemical Reagent Applications and Major Customers of Jiangyin Chemical Reagent Factory
Classification and Main Varieties of Chemical Reagent of Jianghua Microelectronics Materials
Main Business and Products of Suzhou JIMCEL Electronic New Material
Chemical Reagent Classification and Applications of Anhui Fulltime Specialized Solvent & Reagent
Main Product Capacity of Anhui Fulltime Specialized Solvent & Reagent, 2013
Comparison of Major Global and China Chemical Reagent Manufacturers by Revenue, 2013
Comparison of Major Global and China Chemical Reagent by Market Size, 2017
Market Size of Chemical Reagent in China, 2013-2017 E
Product Structure of Chemical Reagent in China, 2013-2017 E
如果这份报告不能满足您的要求,我们还可以为您定制报告,请 留言说明您的详细需求。
|