|
|
|
报告导航:研究报告—
生命科学—生物科技
|
|
2014-2017年全球及中国基因测序产业研究报告 |
 |
字数:2.3万 |
页数:85 |
图表数:85 |
|
中文电子版:7500元 |
中文纸版:3750元 |
中文(电子+纸)版:8000元 |
|
英文电子版:1900美元 |
英文纸版:2100美元 |
英文(电子+纸)版:2200美元 |
|
编号:PQ015
|
发布日期:2014-09 |
附件:下载 |
 |
|
|
基因测序(DNA sequencing)指分析特定DNA 片段的碱基序列,也就是测定腺嘌呤(A)、胸腺嘧啶(T)、胞嘧啶(C)与鸟嘌呤的(G)排列方式,可应用于医学、生物学、地质学、农业等领域。
随着基因测序技术的不断进步及测序成本的大幅降低,其在疾病诊断、个性化治疗等领域市场潜力不断释放。2013年,全球基因测序(包括仪器与耗材、服务和工作流等)市场规模大约达到46亿美元,较上年增长26%左右,预计到2017年全球基因测序市场规模将首次突破百亿美元规模,达到100.96亿美元。
1975年至今,基因测序技术已出现了四代(不过,纳米孔外切酶测序法即第四代,仍处于研发中)。由于技术和成本的原因,目前第二代高通量测序仪是全球主流的测序平台,其累计存量约占全球下一代基因测序仪比重95%以上。
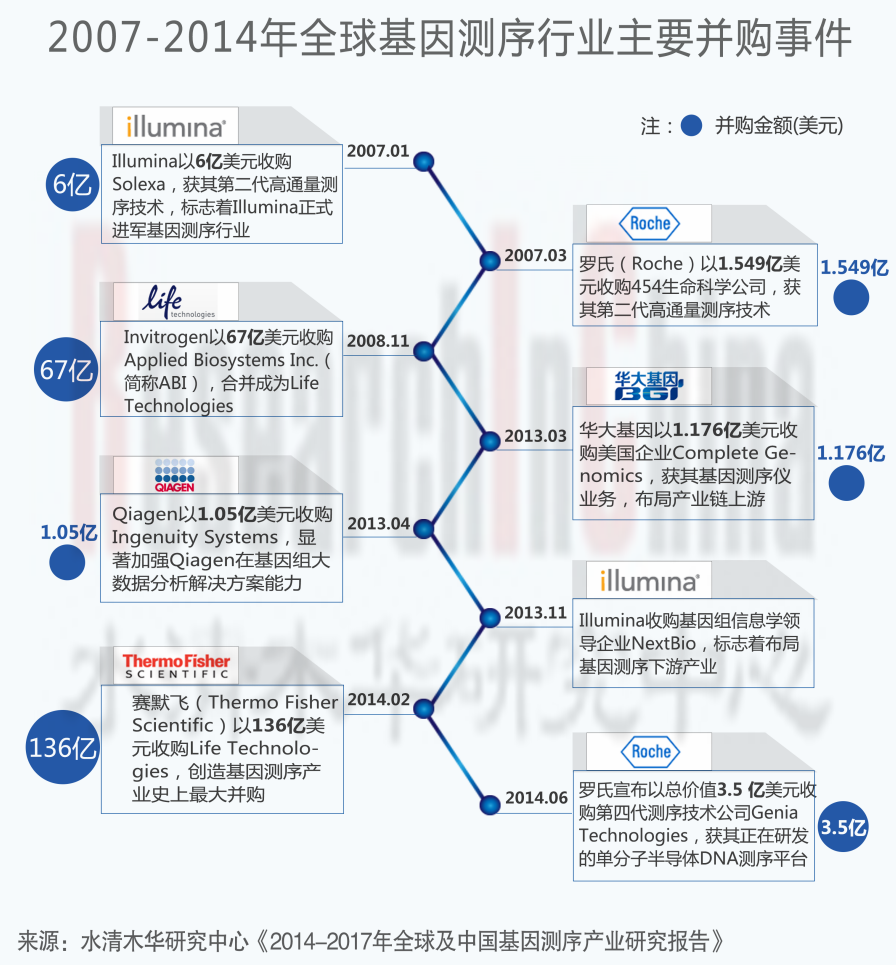
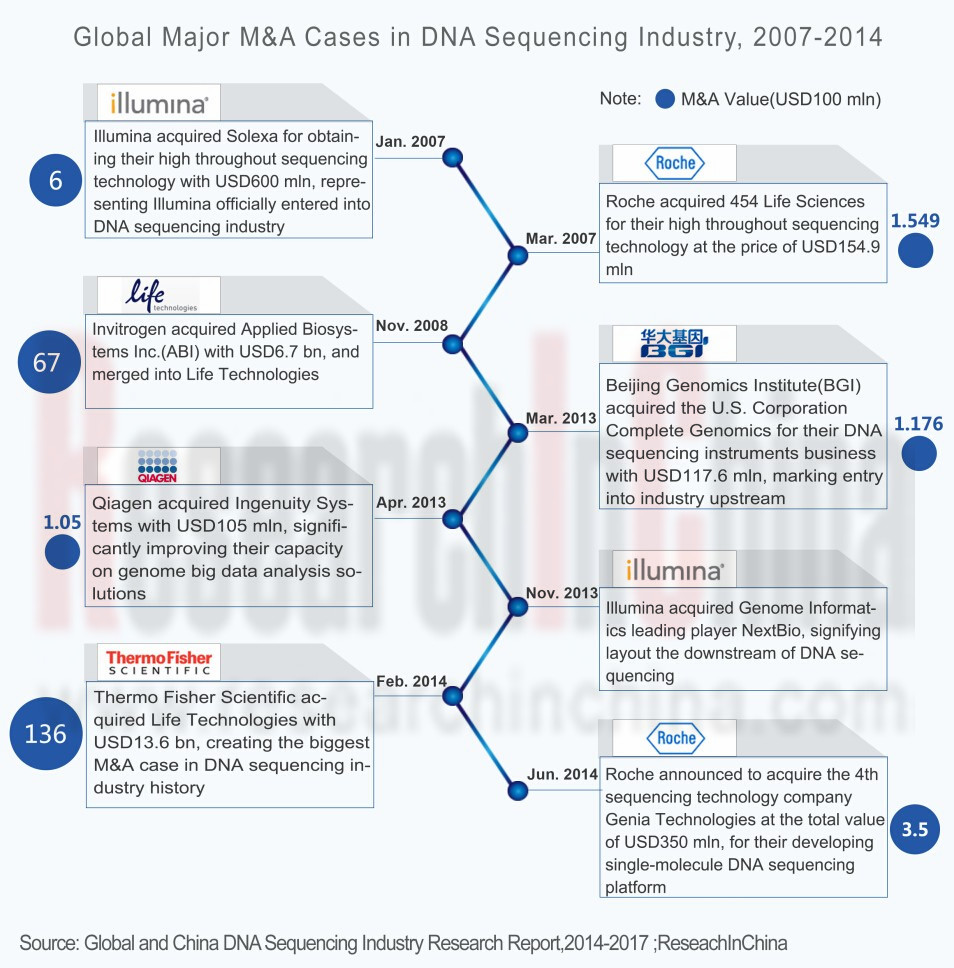
基因测序产业以上游行业发展最为强势,全球市场基本由第二代基因测序平台企业Illumina、赛默飞(Life Technologies)、罗氏以及第三代基因测序平台生产商Pacific Biosciences所垄断。追溯这些巨头的发展史,兼并收购是其形成强大市场竞争力的主要驱动力。其中,2014年2月赛默飞以总价136亿美元完成对Life Technologies的收购,一跃成为仅次于Illumina的行业巨头。
在中国,基因测序上游行业几乎亦是被外资巨头所垄断。华大基因是中国基因测序服务的领导企业,其拥有的第二代基因测序仪数量更是首冠全球。不过其两款测序仪HiSeq 2000和Ion Proton)完全来自Illumina与Life Technologies。2013年3月,华大基因完成对Complete Genomics收购,标志其正式进军基因测序上游产业。2014年6月,华大基因两款产品-- BGISEQ-1000以及BGISEQ-100成为在中国首个完成注册的第二代基因测序仪。
不过,预计在未来5年以内,中国企业在上游产业所处的弱势地位并不会改变,除非有史诗级并购出现。
《2014-2017年全球及中国基因测序产业研究报告》主要内容如下:
 基因测序技术特点、成本分析等; 基因测序技术特点、成本分析等;
全球基因测序产业重大并购、基因数据库、基因测序市场规模与市场结构等;
中国基因测序发展情况、产业政策、市场格局及前景等;
包括中国在内的全球12家企业的经营情况、基因测序业务等。
DNA sequencing is the process of reading nucleotide bases in a specific DNA molecule, that is to say determining the arrangement mode of adenine, thymine, cytosine, and guanine. It can be applied in a broad range of fields, including medicine, biology, geology, and agriculture.
With the advancement of DNA sequencing technology and dramatic decline in sequencing costs, DNA sequencing is increasingly showing its market potential in noninvasive detection, disease diagnosis, and personalized treatment. In 2013, the market size of global DNA sequencing (including equipment and consumables, service and workflow, etc.) approximated USD4.6 billion, up around 26% from the previous year. It is projected that by 2017 this figure will reach USD10.096 billion, exceeding USD10 billion for the first time.
Ever since 1975, DNA sequencing technology has been through four generations, but the fourth-generation technology—Nanopore sequencing is still under development. Due to technologies and costs, the second-generation high-throughput sequencers are the mainstream sequencing platform around the world, with its total number occupying over 95% of next-generation DNA sequencers worldwide.
The upstream sectors of DNA sequencing industry are extremely robust, with the global market dominated by the second-generation DNA sequencing enterprises including Illumina, Thermo Fisher Scientific (through Life Technologies), Roche and the third-generation sequencing enterprises such as Pacific Biosciences. A review of these giants’ development history shows that mergers and acquisitions are the main driving forces behind the great market power. In February 2014, Thermo Fisher Scientific acquired Life Technologies for USD13.6 billion, making it the industry giant second only to Illumina.
In China, the upstream sectors of DNA sequencing industry are virtually monopolized by foreign giants. BGI is the leader in China’s DNA sequencing service, and its second-generation DNA sequencers top the global chart in number. However, two of its sequencers—HiSeq 2000 and Ion Proton were entirely from Illumina and Life Technologies. In March 2013, BGI acquired Complete Genomics, a sign that BGI formally ventured into the upstream sectors of DNA sequencing industry. In June 2014, BGI’s two products—BGISEQ-1000 and BGISEQ-100 became the first second-generation DNA sequencers registered in China.
It is expected, however, that within the next five years the weak position of Chinese enterprises in upstream sectors will remain unchanged except for the epic M&A.
Global and China DNA Sequencing Industry Research Report, 2014-2017 mainly focuses on the followings:
Features, cost, etc. of DNA sequencing technology;
Major M&As, genetic database, market size and structure, etc. of global DNA sequencing industry;
Development, industry policies, market structure and prospects, etc. of DNA sequencing industry in China;
Operation, DNA sequencing business, etc. of 12 enterprises at home and abroad.
第一章 基因测序行业概况
1.1定义
1.2 产业链
1.3应用
1.4 发展历程及技术特点
1.5成本分析
第二章 全球基因测序产业
2.1 主要企业产业链布局
2.2 重大并购
2.3 基因数据库
2.4 测序仪
2.5市场规模及前景
第三章 中国基因测序产业
3.1 发展简介
3.2政策环境
3.3 市场格局
3.3.1 测序仪
3.3.2 服务
3.4 前景
第四章 主要企业
4.1 Illumina
4.1.1 公司简介
4.1.2 经营情况
4.1.3 营收构成
4.1.4 毛利率
4.1.5 研发与投资
4.1.6 基因测序
4.1.7 发展预测
4.2 赛默飞
4.2.1 公司简介
4.2.2 经营情况
4.2.3 营收构成
4.2.4 营业利润率
4.2.5 研发与投资
4.2.6 基因测序
4.2.7在华发展
4.2.8 发展预测
4.3 华大基因
4.3.1 公司简介
4.3.2 经营情况
4.3.3 基因测序
4.4 罗氏
4.4.1 公司简介
4.4.2 基因测序
4.5 Qiagen
4.5.1 公司简介
4.5.2 经营情况
4.5.3 营收构成
4.5.4 研发
4.5.5 基因测序
4.6 Pacific Biosciences
4.6.1 公司简介
4.6.2 经营情况
4.6.3 营收构成
4.6.4 研发
4.6.5 基因测序
4.7 Sequenom
4.7.1 公司简介
4.7.2 经营情况
4.7.3 营收构成
4.7.4 营业利润率
4.7.5 研发
4.7.6 基因测序
4.8 达安基因
4.8.1 公司简介
4.8.2 经营情况
4.8.3 营收构成
4.8.4 毛利率
4.8.5 研发
4.8.6 基因测序
4.8.7 发展预测
4.9 Agilent Technologies
4.9.1 公司简介
4.9.2 经营情况
4.9.3 营收构成
4.9.4 研发
4.9.5 基因测序
4.10贝瑞和康
4.10.1 公司简介
4.10.2 基因测序
4.11 千山药机
4.11.1 公司简介
4.11.2 基因测序
4.12 紫鑫药业
4.12.1 公司简介
4.12.2 经营情况
4.12.3 基因测序
1. Overview of DNA Sequencing Industry
1.1 Definition
1.2 Industry Chain
1.3 Application
1.4 Development History and Technical Features
1.5 Cost
2. Global DNA Sequencing Industry
2.1 Industry Chain Layout of Major Enterprises
2.2 Major M&As
2.3 Genetic Database
2.4 Sequencer
2.5 Market Size and Prospects
3. China DNA Sequencing Industry
3.1 Development
3.2 Policy Environment
3.3 Market Structure
3.3.1 Sequencer
3.3.2 Service
3.4 Prospects
4. Key Enterprises
4.1 Illumina
4.1.1 Profile
4.1.2 Operation
4.1.3 Revenue Structure
4.1.4 Gross Margin
4.1.5 R&D and Investment
4.1.6 DNA Sequencing
4.1.7 Development Prospects
4.2 Thermo Fisher Scientific
4.2.1 Profile
4.2.2 Operation
4.2.3 Revenue Structure
4.2.4 Operating Margin
4.2.5 R&D and Investment
4.2.6 DNA Sequencing
4.2.7 Development in China
4.2.8 Development Prospects
4.3 BGI
4.3.1 Profile
4.3.2 Operation
4.3.3 DNA Sequencing
4.4 Roche
4.4.1 Profile
4.4.2 DNA Sequencing
4.5 Qiagen
4.5.1 Profile
4.5.2 Operation
4.5.3 Revenue Structure
4.5.4 R&D
4.5.5 DNA Sequencing
4.6 Pacific Biosciences
4.6.1 Profile
4.6.2 Operation
4.6.3 Revenue Structure
4.6.4 R&D
4.6.5 DNA Sequencing
4.7 Sequenom
4.7.1 Profile
4.7.2 Operation
4.7.3 Revenue Structure
4.7.4 Operating Margin
4.7.5 R&D
4.7.6 DNA Sequencing
4.8 DAAN Gene
4.8.1 Profile
4.8.2 Operation
4.8.3 Revenue Structure
4.8.4 Gross Margin
4.8.5 R&D
4.8.6 DNA Sequencing
4.8.7 Development Prospects
4.9 Agilent Technologies
4.9.1 Profile
4.9.2 Operation
4.9.3 Revenue Structure
4.9.4 R&D
4.9.5 DNA Sequencing
4.10 Berry Genomics
4.10.1 Profile
4.10.2 DNA Sequencing
4.11 Hunan China Sun Pharmaceutical Machinery
4.11.1 Profile
4.11.2 DNA Sequencing
4.12 Jilin Zixin Pharmaceutical Industrial
4.12.1 Profile
4.12.2 Operation
4.12.3 DNA Sequencing
图:基因测序产业链
表:基因测序技术应用(分领域)
表:基因测序技术特点及其优缺点(按代)
图:2001-2014年每基因组测序成本走势
图:2001-2014年每碱基组测序成本走势
表:全球主要基因测序企业产业链分布
表:2007-2014年全球基因测序行业主要并购事件
图:2002-2014年DDBJ核苷酸测序数据库走势
图:2002-2014年DDBJ核苷酸测序数据库构成走势
表:截至2014年3月DDBJ排名前30名生物体(按核苷酸数量)
图:2008-2014年GenBank下一代基因测序数据量
表:截至2014年9月全球拥有下一代基因测序仪前30名国家或地区(按中心数量)
图:截至2014年9月全球下一代基因测序仪分布(按中心)
图:截至2014年9月全球下一代基因测序仪市场结构(分产品)
图:截至2014年9月全球下一代基因测序市场结构(分企业)
图:截至2014年9月全球下一代基因测序市场结构(按代数)
图:截至2014年9月全球下一代基因测序仪分布(分地区)
表:截至2014年9月全球下一代基因测序仪前30名国家或地区(按数量)
图:截至2014年9月全球基因组中心下一代基因测序仪市场结构(分产品)
图:截至2014年9月全球基因中心前10名(按拥有下一代基因测序仪数量)
图:2009-2017年全球基因测序市场规模及同比增长预测
图:2013年全球基因测序市场结构(分类型)
图:2017年全球基因测序市场结构预测
图:全球基因测序目标市场潜力
表:2012-2014年中国基因测序产业政策
图:截至2014年9月中国下一代基因测序仪占全球市场比重
图:2007-2014年 Illumina营业收入与净利润
图:2007-2013年Illumina(分业务)营业收入构成
图:2007-2013年Illumina(分地区)营业收入
图:2007-2014年Illumina毛利率走势
图:2007-2014年Illumina研发支出及其营收占比
表:2007-2014年Illumina并购历程
表:Illumina基因测序仪器、耗材(分类型)及其应用
图:2014-2017年Illumina营业收入和净利润预测
图:2009-2014年赛默飞营业收入和净利润
图:2009-2014年赛默飞(分业务)营业收入
图:2010-2013年赛默飞(分地区)营业收入
表:2009-2014年赛默飞(分业务)营业利润率
图:2009-2014年赛默飞研发支出及其营收占比
图:2009-2013年Life Technologies营业收入及同比增长
图:2009-2013年赛默飞在华营业收入及其同比增长
图:2014-2017年赛默飞营业收入和净利润预测
图:2007-2013年华大基因营业收入及同比增长
表:1999-2014年华大基因布局基因测序产业事件
图:2009-2014年罗氏分子诊断收入及其营收占比
表:2012和 2013年罗氏新上市基因测序产品
图:2009-2014年Qiagen营业收入和净利润
图:2009-2014年Qiagen(分业务)营业收入
图:2011-2014年Qiagen(按应用市场)营业收入构成
图:2009-2013年Qiagen(分地区)营业收入
图:2009-2014年Qiagen研发支出及其营收占比
图:2009-2014年Pacific Biosciences营业收入和净利润
图:2009-2013年Pacific Biosciences(分地区)营业收入
图:2009-2014年Pacific Biosciences研发支出及其营收占比
表:2011-2014年Pacific Biosciences基因测序收入(按产品)
图:2009-2014年Sequenom营业收入和净利润
图:2009-2014年Sequenom营业收入(分部门)
图:2009-2013年Sequenom(分地区)营业收入
图:2009-2014年Sequenom(分部门)营业利润率
图:2009-2014年Sequenom研发支出及其营收占比
图:2010-2013年Sequenom基因分析(分类)收入
图:2009-2014年达安基因营业收入和净利润
图:2009-2014年达安基因(分业务)营业收入
图:2009-2014年达安基因(分地区)营业收入
图:2009-2014年达安基因(分业务)毛利率
图:2009-2014年达安基因研发支出及其营收占比
图:2009-2014财年Agilent Technologies营业收入与净利润
图:2011-2014财年Agilent Technologies(分业务)营业收入
图:2011-2013财年Agilent Technologies(分地区)营业收入
图:2009-2014年Agilent Technologies研发支出及其营收占比
图:2014-2017年达安基因营业收入和净利润预测
表:2010-2014年贝瑞和康发展重大事件
表:贝瑞和康基因测序产品
表:2012-2014年宏灏基因营业收入与净利润
表:2012-2014年宏灏基因基于基因芯片注册成功的医疗器械
图:2009-2014年紫鑫药业营业收入和净利润
表:2010-2014年紫鑫药业基因测序发展历程
DNA Sequencing Industry Chain
DNA Sequencing Technology Application by Field
Features of DNA Sequencing Technology and its Advantage and Disadvantage by Generation
Trend in Sequencing Cost per Genome, 2001-2014
Trend in Sequencing Cost per Megabase, 2001-2014
Industry Chain Distribution of Major Global DNA Sequencing Enterprises
Major M&As in Global DNA Sequencing Industry, 2007-2014
Trend in The DDBJ Nucleotide Sequence Database, 2002-2014
Trend in The DDBJ Nucleotide Sequence Database Structure, 2002-2014
Top 30 DDBJ Organisms by Number of Nucleotides as of Mar. 2014
Next-generation DNA Sequencing Data of GenBank, 2008-2014
Worldwide Top 30 Countries or Regions with Next-generation DNA Sequencer by Number of Centers as of Sept. 2014
Global Next-Generation DNA Sequencer Distribution by Center as of Sept. 2014
Global Next-Generation DNA Sequencer Market Structure by Product as of Sept. 2014
Global Next-Generation DNA Sequencing Market Structure by Enterprise as of Sept. 2014
Global Next-Generation DNA Sequencing Market Structure by Number of Generation as of Sept. 2014
Global Next-Generation DNA Sequencer Distribution by Region as of Sept. 2014
Worldwide Top 30 Countries or Regions by Number of Next-Generation DNA Sequencers as of Sept. 2014
Next-Generation DNA Sequencer Market Structure of Global Genome Centers by Product as of Sept. 2014
Top 10 Global Genome Centers by Number of Next-Generation DNA Sequencers as of Sept. 2014
Global DNA Sequencing Market Size and YoY Growth, 2009-2017E
Global DNA Sequencing Market Structure by Type, 2013
Global DNA Sequencing Market Structure, 2017E
Global DNA Sequencing Target Market Potential
Policies on China DNA Sequencing industry, 2012-2014
China Next-generation DNA Sequencer Proportion in Global Market as of Sept. 2014
Revenue and Net Income of Illumina, 2007-2014
Revenue Structure of Illumina by Business, 2007-2013
Revenue Breakdown of Illumina by Region, 2007-2013
Gross Margin Trends of Illumina, 2007-2014
R&D Costs and % of Total Revenue of Illumina, 2007-2014
Illumina’s M&A History, 2007-2014
Illumina’s DNA Sequencers and Consumables (by Type) and Their Application
Revenue and Net Income of Illumina, 2014-2017E
Revenue and Net Income of Thermo Fisher Scientific, 2009-2014
Revenue Breakdown of Thermo Fisher Scientific by Business, 2009-2014
Revenue Breakdown of Thermo Fisher Scientific by Region, 2010-2013
Operating Margin of Thermo Fisher Scientific by Business, 2009-2014
R&D Costs and % of Total Revenue of Thermo Fisher Scientific, 2009-2014
Revenue and YoY Growth of Life Technologies, 2009-2013
Revenue and YoY Growth of Thermo Fisher Scientific in China, 2009-2013
Revenue and Net Income of Thermo Fisher Scientific, 2014-2017E
Revenue and YoY Growth of BGI, 2007-2013
Events of BGI’s DNA Sequencing Industry Layout, 1999-2014
Roche’s Revenue from Molecular Diagnosis and % of Total Revenue, 2009-2014
Roche’s Newly-released DNA Sequencing Products, 2012-2013
Revenue and Net Income of Qiagen, 2009-2014
Revenue Breakdown of Qiagen by Business, 2009-2014
Revenue Structure of Qiagen by Application, 2011-2014
Revenue Breakdown of Qiagen by Region, 2009-2013
R&D Costs and % of Total Revenue of Qiagen, 2009-2014
Revenue and Net Income of Pacific Biosciences, 2009-2014
Revenue Breakdown of Pacific Biosciences by Region, 2009-2013
R&D Costs and % of Total Revenue of Pacific Biosciences, 2009-2014
Pacific Biosciences’ Revenue from DNA Sequencing by Product, 2011-2014
Revenue and Net Income of Sequenom, 2009-2014
Revenue Breakdown of Sequenom by Segment, 2009-2014
Revenue Breakdown of Sequenom by Region, 2009-2013
Operating Margin of Sequenom by Segment, 2009-2014
R&D Costs and % of Total Revenue of Sequenom, 2009-2014
Sequenom’s Revenue from Gene Analysis by Segment, 2010-2013
Revenue and Net Income of DAAN Gene, 2009-2014
Revenue Breakdown of DAAN Gene by Business, 2009-2014
Revenue Breakdown of DAAN Gene by Region, 2009-2014
Gross Margin of DAAN Gene by Business, 2009-2014
R&D Costs and % of Total Revenue of DAAN Gene, 2009-2014
Revenue and Net Income of Agilent Technologies, FY2009-FY2014
Revenue Breakdown of Agilent Technologies by Business, FY2011-FY2014
Revenue Breakdown of Agilent Technologies by Region, FY2011-FY2013
R&D Costs and % of Total Revenue of Agilent Technologies, 2009-2014
Revenue and Net Income of DAAN Gene, 2014-2017E
Major Events of Berry Genomics, 2010-2014
DNA Sequencing Products of Berry Genomics
Revenue and Net Income of Hunan Honghao Gene, 2012-2014
Hunan Honghao Gene‘s Medical Devices Registered Based on Gene Chip, 2012-2014
Revenue and Net Income of Jilin Zixin Pharmaceutical Industrial, 2009-2014
Development History of DNA Sequencing of Jilin Zixin Pharmaceutical Industrial, 2010-2014
如果这份报告不能满足您的要求,我们还可以为您定制报告,请 留言说明您的详细需求。
|