|
|
|
报告导航:研究报告—
制造业—化工
|
|
2014-2017年全球及中国1,4丁二醇(BDO)行业研究报告 |
 |
字数:3.4万 |
页数:100 |
图表数:113 |
|
中文电子版:8000元 |
中文纸版:4000元 |
中文(电子+纸)版:8500元 |
|
英文电子版:2350美元 |
英文纸版:2500美元 |
英文(电子+纸)版:2650美元 |
|
编号:HK050
|
发布日期:2014-10 |
附件:下载 |
 |
|
|
1,4-丁二醇(BDO)是一种重要的有机和精细化工原料,广泛应用于医药、化工、纺织和日用化工等领域。
截至2014年9月底,全球BDO产能达到335万吨左右,其中中国大陆产能约占到48%。全球BDO生产企业主要有台湾大连化学、德国BASF、美国利安德巴塞尔等,三家BDO产能之和约占全球总产能的38.5%。
全球BDO生产工艺主要控制在德国Basf、美国ISP和Invista、英国Davy、日本三菱、台湾大连等企业手中。虽然Invista、三菱、Davy等企业BDO产能规模不大,但其拥有BDO核心生产技术和专利,通过技术转让等形式在全球BDO产业中占据着重要的地位。
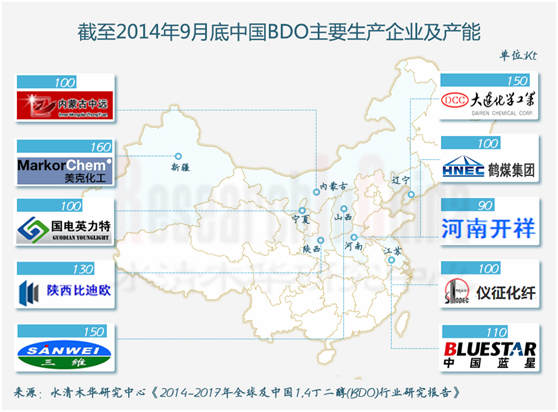
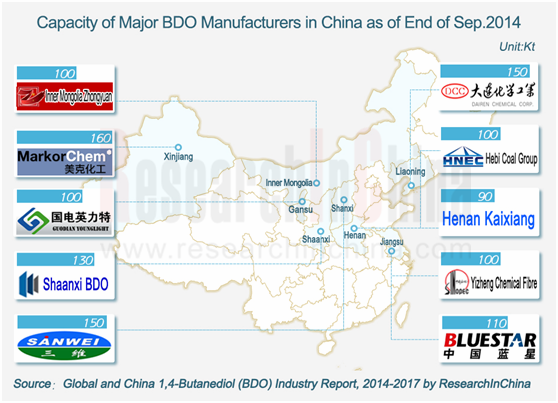
2009-2011年,中国BDO行业供应偏紧,BDO价格持续上升,促使大量企业实施BDO新增或扩产项目,导致BDO产能迅速膨胀。截至2014年9月底,中国BDO产能已经达到161.6万吨,产能严重过剩,装置开工率仅为30%左右。
目前,中国大陆BDO生产工艺主要为炔醛法和顺酐法,其中顺酐法BDO产能占比约为27.5%。2012年以来,由于中国顺酐法BDO原料顺酐价格持续高位运行,顺酐法BDO装置全面亏损,基本处于关闭状态。而炔醛法BDO装置运行则相对平稳,但利润空间也被大幅压缩。
未来几年,中国大陆规划新增BDO产能仍然较多,达140万吨左右。但是在产能过剩及市场需求低迷的背景下,部分项目可能被搁置或取消,BDO产能增长速度将明显放缓。同时中国BDO行业集中度有望逐步提高,主流厂商如美克化工、山西三维的BDO产能将继续扩大,部分小厂商的BDO装置在成本压力下将逐步淘汰。
截至2014年9月底,中国大陆前三名BDO生产企业分别为美克化工、山西三维和长连化学(盘锦),产能分别为16万吨、15万吨和15万吨。
水清木华研究中心《2014-2017年全球及中国1,4丁二醇(BDO)行业研究报告》主要包括以下几个内容:
 全球BDO行业供需分析、竞争格局、价格走势等; 全球BDO行业供需分析、竞争格局、价格走势等;
中国BDO行业供需分析、竞争格局、进出口、价格走势及2014-2017年发展预测等;
全球及中国PTMEG、PBT、GBL等BDO下游行业供需分析、竞争格局、进出口分析、价格走势等;
全球及中国13家BDO生产企业的经营情况、BDO业务分析以及16家中国企业BDO项目进展情况等。
As an important organic and fine chemical, 1,4-butanediol (BDO) is widely used in pharmaceutical, chemical, textile and household chemical fields.
By the end of September 2014, the BDO capacity worldwide topped around 3.35 million tons, of which about 48% came from Mainland China. Global BDO manufacturers mainly include Taiwan-based Dairen Chemical Corporation (DCC), Germany-based BASF and U.S.-based LyondellBasell, combining 38.5% of total worldwide capacity.
The BDO production process on a global scale is dominated by BASF, U.S.-based ISP and Invista, U.K.-based Davy, Japan’s Mitsubishi Chemical, and DCC. In spite of relatively small BDO capacity, Invista, Mitsubishi Chemical and Davy with core production technologies and patents are playing an important role in the global BDO industry by technology transfer or other means.
During 2009-2011, the BDO industry in China faced a tight supply, the rising BDO price drove a large number of enterprises to add or expand capacity projects, which gave rise to the BDO capacity swelling. By the end of September 2014, China’s BDO capacity has been around 1.616 million tons, while the severe overcapacity was accompanied by an operating rate (regarding to BDO facilities) of merely 30% or so.
At present, the BDO in Mainland China is mostly manufactured via reppe process and maleic anhydride process, of which maleic anhydride-process BDO makes up roughly 27.5% of capacity. From 2012 onward, due to the stubbornly high price of maleic anhydride, maleic anhydride-process BDO facilities were in the red, basically shut down. While reppe-process BDO facilities are in relatively steady operation, but the profit margin thereof has been sharply reduced.
In the next few years, more new BDO capacities were to be built in Mainland China as it is planned, totaling 1.4 million tons or so, however, against the excess capacity and the sluggish market demand, some projects will probably be put aside or cancelled, and the growth rate of BDO capacity will slacken. In the meantime, the concentration of China’s BDO industry is expected to increase step by step. Mainstream manufacturers such as Markor Chem and Shanxi Sanwei will continue to expand their BDO capacities and the BDO facilities of some small producers will be gradually eliminated under cost pressure.
Up to the end of September 2014, the top 3 BDO manufacturers in Mainland China were Markor Chem, Shanxi Sanwei and Chang Chun Dairen Chemical (PANJIN), respectively featuring capacity of 160,000 tons, 150,000 tons and 150,000 tons.
Global and China 1,4-Butanediol (BDO) Industry Report, 2014-2017 by ResearchInChina mainly highlights the followings:
Supply & demand, competitive landscape, price trend, etc. of global BDO industry;
Supply & demand, competitive landscape, import & export, price trend and development forecast (2014-2017) of the BDO industry in China;
Supply & demand, competitive landscape, import & export, price trend, etc. of BDO downstream industries such as PTMEG, PBT, GBL, etc. at home and abroad;
Operation and BDO business of 13 BDO manufacturers in the world and China and progress of BDO projects of 16 Chinese enterprises.
第一章 BDO概述
1.1 性质及用途
1.2 工艺简介
第二章全球BDO行业发展概况
2.1 发展现状
2.2 供给
2.3 需求
2.4 竞争格局
2.5 价格
第三章中国BDO行业发展概况
3.1 政策环境
3.2 供给
3.3 需求
3.4 竞争格局
3.5 进出口分析
3.6 价格分析
第四章 BDO下游行业发展情况
4.1 THF/PTMEG
4.1.1 全球市场
4.1.2 中国市场
4.2 PBT
4.2.1 全球市场
4.2.2 中国市场
4.3 GBL
4.3.1 全球市场
4.3.2 中国市场
4.4 其他
第五章海外BDO生产企业
5.1 巴斯夫(BASF)
5.1.1 公司简介
5.1.2 经营情况
5.1.3 化学品部门经营情况
5.1.4 化学品部门营收构成
5.1.5 BDO业务
5.1.6 在华业务
5.2 大连化学(DAIREN CHEMICAL)
5.2.1 公司介绍
5.2.2 BDO业务
5.2.3 公司优势及发展前景
5.3 利安德巴塞尔(LYONDELLBASELL)
5.3.1 公司简介
5.3.2 经营情况
5.3.3 BDO业务
5.3.4 在华业务
5.4 亚什兰(ASHLAND)
5.4.1 公司简介
5.4.2 经营情况
5.4.3 功能性材料部门经营情况
5.4.4 BDO业务
5.4.5 在华业务
5.5 南亚塑胶
5.5.1 公司介绍
5.5.2 经营状况
5.5.3 BDO业务
5.5.4 发展前景
第六章中国大陆BDO主要生产企业
6.1 山西三维
6.1.1 公司介绍
6.1.2 经营情况
6.1.3 营收构成
6.1.4 毛利率
6.1.5 客户与供应商
6.1.6 BDO业务
6.1.7 预测与展望
6.2 云维股份
6.2.1 公司简介
6.2.2 经营情况
6.2.3 营收构成
6.2.4 毛利率
6.2.5 BDO业务
6.2.7 预测与展望
6.3 仪征化纤
6.3.1 公司简介
6.3.2 BDO业务
6.4 美克化工
6.4.1 公司介绍
6.4.2 经营情况
6.4.3 客户及供应商
6.4.4 BDO业务
6.5 福建湄洲湾
6.5.1 公司简介
6.5.2 BDO业务
6.6 南京蓝星
6.6.1 公司简介
6.6.2 BDO业务
6.7 中国新材
6.7.1 公司介绍
6.7.2 BDO业务
6.8 鹤煤集团
6.8.1 公司简介
6.8.2 BDO业务
6.9 其他公司
6.9.1 陕西比迪欧
6.9.2 四川天华
6.9.3 建峰化工
6.9.4 国电英力特
6.9.5 河南开祥
6.9.6 内蒙古中远
6.9.7 四川维厂
6.9.8 华宸能源
6.9.9 江山化工
6.9.10 新疆天业
6.9.11 延长石油
6.9.12 恒源煤电
6.9.13 潍焦集团
6.9.14 陕西融和
6.9.15 蓝山屯河
6.9.16 新疆国泰
第七章总结及预测
7.1 总结
7.2 预测
7.2.1 发展趋势
7.2.2 供需预测
1 Profile of BDO
1.1 Properties and Purposes
1.2 Process
2 Overview of Global BDO Industry
2.1 Status Quo
2.2 Supply
2.3 Demand
2.4 Competitive Landscape
2.5 Price
3 Overview of China BDO Industry
3.1 Policy
3.2 Supply
3.3 Demand
3.4 Competitive Landscape
3.5 Import & Export
3.6 Price
4 Development of BDO Downstream Industry
4.1 THF/PTMEG
4.1.1 World
4.1.2 China
4.2 PBT
4.2.1 World
4.2.2 China
4.3 GBL
4.3.1 World
4.3.2 China
4.4 Others
5 Major Overseas BDO Manufacturers
5.1 BASF
5.1.1 Profile
5.1.2 Operation
5.1.3 Operation of Chemical Division
5.1.4 Revenue Structure of Chemical Division
5.1.5 BDO Business
5.1.6 Business in China
5.2 Dairen Chemical
5.2.1 Profile
5.2.2 BDO Business
5.2.3 Advantages and Outlook
5.3 LYONDELLBASELL
5.3.1 Profile
5.3.2 Operation
5.3.3 BDO Business
5.3.4 Business in China
5.4 Ashland
5.4.1 Profile
5.4.2 Operation
5.4.3 Operation of Functional Material Division
5.4.4 BDO Business
5.4.5 Business in China
5.5 Nan Ya Plastics
5.5.1 Profile
5.5.2 Operation
5.5.3 BDO Business
5.5.4 Outlook
6 Major BDO Manufacturers in Mainland China
6.1 Shanxi Sanwei
6.1.1 Profile
6.1.2 Operation
6.1.3 Revenue Structure
6.1.4 Gross Margin
6.1.5 Clients and Suppliers
6.1.6 BDO Business
6.1.7 Forecast and Outlook
6.2 Yunnan Yunwei
6.2.1 Profile
6.2.2 Operation
6.2.3 Revenue Structure
6.2.4 Gross Margin
6.2.5 BDO Business
6.2.7 Forecast and Outlook
6.3 Sinopec Yizheng Chemical Fibre
6.3.1 Profile
6.3.2 BDO Business
6.4 Markor Chem
6.4.1 Profile
6.4.2 Operation
6.4.3 Clients and Suppliers
6.4.4 BDO Business
6.5 Fujian Meizhouwan
6.5.1 Profile
6.5.2 BDO Business
6.6 Nanjing Bluestar
6.6.1 Profile
6.6.2 BDO Business
6.7 China New Materials
6.7.1 Profile
6.7.2 BDO Business
6.8 HNCC
6.8.1 Profile
6.8.2 BDO Business
6.9 Other Companies
6.9.1 Shaanxi BDO
6.9.2 Sichuan Tianhua
6.9.3 Jianfeng Chemical
6.9.4 Guodian Younglight
6.9.5 Henan Kaixiang
6.9.6 Inner Mongolia Zhongyuan
6.9.7 Sinopec Sichuan Vinylon Works
6.9.8 Zhongjia Huachen Energy
6.9.9 Jiangshan Chemical
6.9.10 Xinjiang Tianye
6.9.11 Yanchang Petroleum
6.9.12 Hengyuan Coal Industry and Electricity Power
6.9.13 Shandong Weijiao
6.9.14 Shaanxi Ronghe Chemical
6.9.15 Xinjiang Blue Ridge Tunhe Chemical Industry Joint Stock
6.9.16 Xinjiang Guotai Xinhua Mining
7 Summary and Forecast
7.1 Summary
7.2 Forecast
7.2.1 Development Trend
7.2.2 Supply & Demand
图:BDO产业链示意图
表:BDO生产工艺优缺点比较
表:全球BDO生产技术应用情况
图:2007-2014年全球BDO产能及其增长率
表:截止2014年9月全球主要BDO生产商及产能
图:2007-2014年全球BDO需求量及增长率
图:截止2014年9月全球主要BDO厂商产能占比
图:2005-2014年全球BDO价格走势
表:中国BDO反倾销事件简述
表:中国对沙特和台湾地区BDO公司所征收的保证金税率和反倾销税率
表:截止2014年9月中国BDO生产企业及产能
图:截止2014年9月中国BDO产能占比(按生产工艺)
表:2014年中国BDO拟/在建BDO项目情况
图:2006-2014年中国BDO产能及增长率
图:2006-2014年中国BDO产量及开工率
图:2006-2014年中国BDO表观消费量及增长率
图:2013年中国BDO下游消费结构
表:2013年BDO主要下游用户情况
图:截止2014年9月中国BDO主要生产商产能及占比
图:2009-2014年中国其他二元醇进出口量
图:2009-2014年中国其他二元醇进出口平均价格
图:2013年中国其他二元醇进口来源(按进口量)
图:2013年中国其他二元醇出口目的地(按出口量)
图:2013年中国进口其他二元醇主要地区及其进口量占比
图:2013年中国出口其他二元醇的主要地区及其出口量占比
图:2009-2014年山西三维BDO出厂价格
图:2014年9月17日中国(分地区)BDO价格
图:2014年9月17日中国(分企业)BDO价格
图:2013年全球PTMEG产能地区分布
图:2013年全球PTMEG主要生产商产能占比
图:2007-2013年全球PTMEG产能
图:2006-2013年中国PTMEG产能
图:2006-2013中国PTMEG产量及开工率
表:2013年中国大陆PTMEG生产企业及其产能
表:2014年中国拟/在建PTMEG项目情况
图:2008-2013年中国PTMEG表观消费量及自给率
图:2013年中国PTMEG消费结构
图:2008-2014年中国PTMEG进出口数量
图:2008-2014年中国PTMEG进出口平均价格
图:2013年中国PTMEG进口来源分布(按进口量)
图:2013年中国PTMEG出口目的地分布(按出口量)
图:2013-2014年中国华东市场PTMEG(1000 or2000分子量)均价
图:2013年全球PBT消费结构
图:2013年全球PBT(分地区)消费量占比
表:2013年中国PBT生产商及其产能
图:2013年中国PBT消费结构
图:2008-2014年中国PBT进出口量
图:2008-2014年中国PBT进出口平均价格
图:2013年中国PBT进口来源分布(按进口量)
图:2013年中国PBT出口目的地分布(按出口量)
图:2009-2014年江苏三房巷PBT(G10)市场价格
表:2014年9月中国主要PBT厂商报价
表:2013年中国GBL主要生产企业及产能
图:2009-2014年BASF销售收入和净利润
图:2013年BASF(分部门)销售收入占比
图:2012-2014年BASF化学品部门销售收入和EBITDA
表:2012-2014年BASF化学品部门(分产品)销售收入
表:2012-2014年BASF化学品部门(分产品)销售收入占比
图:2011-2013年BASF中间体产品(分地区)销售收入占比
表:2013年BASF BDO装置地址、产能及工艺
表:2013年大连化学工业公司主要产品及产能
表:2013年大连化学BDO厂址及其产能
图:大连化学BDO产业链示意图
图:2011-2014年利安德巴塞尔营业收入和净利润
图:2013年利安德巴塞尔(分部门)营业收入占比
图:2011-2014年利安德巴赛尔中间体及衍生物部门营业收入及营业利润
表:2013年利安德巴塞尔中间产品及衍生物部门主要产品及产能
图:2010-2014财年亚什兰销售收入和净利润
图:2011-2013财年亚什兰(分部门)销售收入占比
图:2013年亚什兰功能性材料部门(分市场)销售收入占比
图:2013年亚什兰功能性材料部门(分产品)销售收入占比
图:2013年亚什兰功能性材料部门(分地区)销售收入占比
表:2013年美国ISP公司BDO装置地址、产能及工艺
表:南亚塑胶主要产品
图:2009-2013年南亚塑胶营业收入和净利润
图:2013年南亚塑胶主营产品销售收入及其营业收入占比
图:2009-2013年南亚塑胶BDO业务收入及其营收占比
图:2008-2013年南亚塑胶BDO产能及产量
图:2009-2013年南亚塑胶BDO销量和产销率
图:2011-2013年南亚塑胶BDO自用量和外销量占总销量的比例
图:2009-2014年山西三维营业收入和净利润
表:2012-2014年山西三维(分产品)营业收入
图:2012-2014年山西三维(分产品)营业收入占比
表:2012-2014年山西三维(分地区)营业收入
图:2012-2014年山西三维(分地区)营业收入占比
图:2010-2014年山西三维主营产品毛利率
图:2011-2013年山西三维前五名客户贡献收入及占比
表:2013年山西三维前五名客户名称、收入贡献及占比
图:2011-2013年山西三维前五名供应商采购额及占比
表:2013年山西三维前五名供应商名称、采购金额及占比
表:山西三维BDO业务发展历程
图:2013年山西三维BDO及下游产品产能
图:2013-2017年山西三维营业收入及净利润预测
表:2013年云维股份主营产品及其产能
图:2009-2014年云维股份营业收入和净利润
表:2012-2014年云维股份(分产品)营业收入
表:2012-2014年云维股份(分产品)营业收入占比
表:2012-2014年云维股份(分地区)营业收入
图:2012-2014年云维股份(分地区)营业收入占比
表:2012-2014年云维股份(分产品)毛利率
图:2011-2014年云维化工BDO产能及产量
图:2010-2014年云维化工营业收入和净利润
图:2013-2017年云维股份营业收入及净利润预测
表:2012-2013年美克化工财务指标
表:2012年美克化工主要客户及BDO供应量
表:2013上半年美克化工主要供应商采购金额及产品
图:美克化工BDO工艺流程
表:2010-2013年美克化工BDO产能、产量、销量及销售价格
表:2013年福建湄洲湾主营产品产能
表:东营胜利BDO相关业务发展历程
表:2013-2014年全球及中国部分企业BDO业务收入对比
图:2013-2017年中国BDO产能及增长率预测
图:2013-2017年中国BDO产量、表观消费量预测
BDO Industry Chain
Advantages and Disadvantages of BDO Production Process
Application of Global BDO Production Technology
Global BDO Capacity and Growth Rate, 2007-2014
Major BDO Manufacturers Worldwide and Their Capacity, as of Sep. 2014
Global BDO Demand and Growth Rate, 2007-2014
Capacity Share of Major BDO Manufacturers in the World, as of Sep. 2014
BDO Price Trend Worldwide, 2005-2014
BDO Anti-dumping Cases in China
Deposit and Anti-dumping Tax Rates Levied by China on Saudi Arabian and Taiwanese BDO Companies
BDO Manufacturers and Their Capacity in China, as of Sep. 2014
BDO Capacity Structure (by Production Process) in China, as of Sep. 2014
Proposed/Ongoing BDO Projects in China, 2014
BDO Capacity and Growth Rate in China, 2006-2014
BDO Output and Operating Rate in China, 2006-2014
BDO Apparent Consumption and Growth Rate in China, 2006-2014
BDO Downstream Consumption Structure in China, 2013
Major BDO Downstream Users, 2013
Capacity Share of Major BDO Manufacturers in China, as of Sep. 2014
Import/Export Volume of Other Diols in China, 2009-2014
Average Import/Export Price of Other Diols in China, 2009-2014
Import Sources of Other Diols (by Import Volume) in China, 2013
Export Destinations of Others Diols (by Export Volume) in China, 2013
Main Other Diols Importing Regions and Import Structure in China, 2013
Main Other Diols Exporting Regions and Export Structure in China, 2013
BDO Ex-factory Price of Shanxi Sanwei, 2009-2014
BDO Price (by Region) in China, Sep. 17, 2014
BDO Price (by Business) in China, Sep. 17, 2014
Geographical Distribution of Global PTMEG Capacity, 2013
Capacity Share of Major PTMEG Manufacturers in the World, 2013
Global PTMEG Capacity, 2007-2013
PEMEG Capacity in China, 2006-2013
PTMEG Output and Operating Rate in China, 2006-2013
PTMEG Manufacturers and Their Capacity in Mainland China, 2013
Proposed/Ongoing PTMEG Projects in China, 2014
PTMEG Apparent Consumption and Self-sufficiency Rate in China, 2008-2013
PTMEG Consumption Structure in China, 2013
PTMEG Import/Export Volume in China, 2008-2014
Average PTMEG Import/Export Price in China, 2008-2014
Distribution of PTMEG Import Sources (by Import Volume) in China, 2013
Distribution of PTMEG Export Destinations (by Export Volume) in China, 2013
Average PTMEG (MW: 1000 or 2000) Price in East China, 2013-2014
Global PBT Consumption Structure, 2013
Global PBT Consumption Structure (by Region), 2013
PBT Manufacturers and Their Capacity in China, 2013
PBT Consumption Structure in China, 2013
PBT Import/Export Volume in China, 2008-2014
Average PBT Import/Export Price in China, 2008-2014
Distribution of PBT Import Sources (by Import Volume) in China, 2013
Distribution of PBT Export Destinations (by Export Volume) in China, 2013
PBT (G10) Market Price of Jiangsu Sanfangxiang Group, 2009-2014
Quotations of Major PBT Manufacturers in China, Sep. 2014
Major GBL Manufacturers and Their Capacity in China, 2013
Sales and Net Income of BASF, 2009-2014
Sales Structure of BASF (by Division), 2013
Sales and EBITDA of BASF’s Chemical Division, 2012-2014
Sales Breakdown of BASF’s Chemical Division (by Product), 2012-2014
Sales Structure of BASF’s Chemical Division (by Product), 2012-2014
Intermediates Sales Structure of BASF (by Region), 2011-2013
Address, Capacity and Process of BDO Facilities of BASF, 2013
Main Products and Capacity of Dairen Chemical, 2013
Address and Capacity of BDO Plants of Dairen Chemical, 2013
BDO Industry Chain of Dairen Chemical
Revenue and Net Income of LYONDELLBASELL, 2011-2014
Revenue Structure of LYONDELLBASELL (by Division), 2013
Revenue and Operating Income of Intermediate and Derivative Division of LYONDELLBASELL, 2011-2014
Main Products and Capacity of Intermediate and Derivative Division of LYONDELLBASELL, 2013
Revenue and Net Income of Ashland, FY2010-FY2014
Revenue Structure of Ashland (by Division), FY2011-FY2013
Revenue Structure of Ashland’s Functional Material Division (by Market), 2013
Revenue Structure of Ashland’s Functional Material Division (by Product), 2013
Revenue Structure of Ashland’s Functional Material Division (by Region), 2013
Address, Capacity and Process of BDO Facilities of ISP, 2013
Main Products of Nan Ya Plastics
Revenue and Net Income of Nan Ya Plastics, 2009-2013
Nan Ya Plastics’ Revenue from Main Products and % of Total Revenue, 2013
Nan Ya Plastics’ Revenue from BDO and % of Total Revenue, 2009-2013
BDO Capacity and Output of Nan Ya Plastics, 2008-2013
BDO Sales Volume and Sales/Output Ratio of Nan Ya Plastics, 2009-2013
Proportion of BDO Self-used Volume and External Sales Volume in Total Sales Volume of Nan Ya Plastics, 2011-2013
Revenue and Net Income of Shanxi Sanwei, 2009-2014
Revenue Breakdown of Shanxi Sanwei (by Product), 2012-2014
Revenue Structure of Shanxi Sanwei (by Product), 2012-2014
Revenue Breakdown of Shanxi Sanwei (by Region), 2012-2014
Revenue Structure of Shanxi Sanwei (by Region), 2012-2014
Gross Margin of Main Products of Shanxi Sanwei, 2010-2014
Shanxi Sanwei’s Revenue from Top 5 Clients and % of Total Revenue, 2011-2013
Name List and Revenue Contribution of Shanxi Sanwei’s Top 5 Clients, 2013
Shanxi Sanwei’s Procurement from Top 5 Suppliers and % of Total Procurement, 2011-2013
Name List and Procurement Contribution of Shanxi Sanwei’s Top 5 Suppliers, 2013
Development Course of BDO Business of Shanxi Sanwei
Capacity of BDO and Downstream Products of Shanxi Sanwei, 2013
Revenue and Net Income of Shanxi Sanwei, 2013-2017E
Capacity of Main Products of Yunnan Yunwei, 2013
Revenue and Net Income of Yunnan Yunwei, 2009-2014
Revenue Breakdown of Yunnan Yunwei (by Product), 2012-2014
Revenue Structure of Yunnan Yunwei (by Product), 2012-2014
Revenue Breakdown of Yunnan Yunwei (by Region), 2012-2014
Revenue Structure of Yunnan Yunwei (by Region), 2012-2014
Gross Margin of Yunnan Yunwei (by Product), 2012-2014
BDO Capacity and Output of Yunnan Yunwei, 2011-2014
Revenue and Net Income of Yunnan Yunwei, 2010-2014
Revenue and Net Income of Yunnan Yunwei, 2013-2017E
Financial Indicators of Markor Chem, 2012-2013
Major Clients and BDO Supply of Markor Chem, 2012
Markor Chem’s Procurement and Products Procured from Major Suppliers, H1 2013
BDP Process of Markor Chem
BDO Capacity, Output, Sales Volume and Sales Price of Markor Chem, 2010-2013
Capacity of Main Products of Fujian Meizhouwan, 2013
Development Course of BDO-related Business of Dongying Shengli
Comparison of Some Global and Chinese Enterprises by BDO Revenue, 2013-2014
BDO Capacity and Growth Rate in China, 2013-2017E
BDO Output and Apparent Consumption in China, 2013-2017E
如果这份报告不能满足您的要求,我们还可以为您定制报告,请 留言说明您的详细需求。
|