|
|
|
报告导航:研究报告—
生命科学—生物科技
|
|
2014-2017年中国肝素行业研究报告 |
 |
字数:3.5万 |
页数:88 |
图表数:104 |
|
中文电子版:7500元 |
中文纸版:3750元 |
中文(电子+纸)版:8000元 |
|
英文电子版:2150美元 |
英文纸版:2300美元 |
英文(电子+纸)版:2450美元 |
|
编号:QJC016
|
发布日期:2014-10 |
附件:下载 |
 |
|
|
中国是全球主要肝素原料药生产国与出口国,丰富的原料资源为中国肝素类产品生产提供了有力支撑。2013年,中国生猪养殖规模可满足27.9万亿单位肝素粗品生产;2014年上半年,中国生猪养殖规模可满足14.09万亿单位肝素粗品的生产,同比增长5.6%。
2011-2013年,全球肝素制剂市场受欧美经济影响继续低迷,主要肝素制剂品牌销售均出现下滑,进而导致中国肝素产品出口量下降。2013年,中国共出口肝素及盐约13.68万亿单位,同比下降5.9%;2014年1-8月,中国共出口肝素及盐约9.32万亿单位,同比下降0.6%。
海普瑞、南京健友、东诚药业、千红制药及常山药业等是全球肝素原料药主要供应商,连续多年位居中国肝素出口前四位,合占中国肝素出口总额60%以上份额。为应对国际市场影响,各企业正积极探索应对措施。其中,海普瑞通过海外并购,强化在肝素粗品领域的市场份额;千红制药、东诚药业、常山药业等企业加快低分子肝素制剂的研发与生产,并积极开拓国内市场;南京健友则积极寻求通过IPO扩大产能。
虽然前几年领先肝素企业已有扩大产能及完善肝素产业链的计划,但是受需求市场走低或技术标准提升等原因,多个原计划2014年投产的肝素原料药项目相继延迟,如东诚药业“年处理32吨粗品肝素钠项目”、千红药业“肝素原料药及制剂扩产项目”等。
不过,从拟/在建项目看,预计2015年,中国肝素原料药新增产能将达到20万亿单位以上,届时中国总产能将超过30万亿单位,占到全球需求量80%左右。
鉴于美国经济出现复苏迹象,欧洲经济未现继续恶化的趋势,预计2014-2017年全球肝素原料药及制剂市场规模将逐步恢复至增长通道。届时,中国肝素行业特别是原料药市场景气度将有所提高,进而带动新增产能释放。
《2014-2017年中国肝素产业研究报告》主要包括以下几方面内容:
 全球肝素市场供需、竞争格局及预测等; 全球肝素市场供需、竞争格局及预测等;
中国肝素原料药行业发展现状、进入壁垒、市场供需、竞争格局、进出口以及发展预测等;
中国肝素制剂行业发展现状、市场供需、竞争格局以及发展预测等;
海普瑞、南京健友、千红制药、东诚生化、常山生化等7家肝素企业运营状况、肝素业务及发展前景等。
As the world's major heparin API producer and exporter, China boasts enormous raw materials, which provides a strong support for the production of China’s heparin products. In 2013, the live pigs raised in China could manufacture 27.9 trillion units of heparin crude products. And in H1 2014, the live hogs in China may produce 14.09 trillion units of heparin crude products, up 5.6% on a year-on-year basis.
In 2011-2013, affected by the economic downturn in Europe and America, the global heparin preparations market continued to drop, with the sales volume of main heparin preparations brands virtually presenting decline, thus dragging down the exports of China’s heparin products. In 2013, China exported approximately 13.68 trillion units of heparin and its salts, falling 5.9% year on year, and the figure edged down 0.6% from a year earlier to around 9.32 trillion units in Jan.-Aug. 2014.
The major global heparin API suppliers, including Hepalink, Nanjing King-friend, Dongcheng Biochemicals, Qianhong Bio-pharma, and Changshan Biochemical Pharmaceutical, have been among the top 4 heparin exporters in China for many years, together accounting for over 60% of China’s total heparin exports. In response to the impact from international markets, enterprises are stepping up efforts to figure out the solutions, with Hepalink expanding its market share of heparin crude products via M&As overseas. By contrast, the enterprises like Qianhong Bio-pharma, Dongcheng Biochemicals, and Changshan Biochemical Pharmaceutical have accelerated the R&D into and production of low molecular weight heparin preparations. And Nanjing King-friend is aggressively seeking to expand capacity through IPO.
Although the leading heparin enterprises planned to increase capacity and improve the heparin industry chain a few years ago, yet quite a few heparin API projects that had been scheduled to go into operation in 2014 were delayed successively due to depressed market demand or improved technical standards, these projects including Dongcheng Biochemicals’ 32t/a Crude Heparin Sodium Project and Qianhong Bio-pharma’s Heparin API and Preparations Expansion Project.
In terms of the proposed/ongoing projects, however, it is projected that the heparin API in China will achieve an additional capacity of more than 20 trillion units by 2015, when China’s total capacity will exceed 30 trillion units, accounting for roughly 80% of the global demand.
Given that America's economy showed signs of recovery and the European economy did not continue to deteriorate, we foresee that the market size of the global heparin API and preparation market will bounce back in 2014-2017, when China’s heparin industry, heparin API in particular, will see an improved degree of prosperity, thus further releasing new capacity.
China Heparin Industry Report, 2014-2017 mainly deals with the followings:
Global heparin supply & demand, competitive landscape and forecast, etc.;
Development, access barriers, supply & demand, competitive landscape, import & export, and development forecast, etc. of China heparin API industry;
Development, supply & demand, competitive landscape and development forecast, etc. of China heparin preparations industry;
Operation, Heparin Business, development prospect, etc. of 7 heparin enterprises, including Hepalink, Nanjing King-friend, Qianhong Bio-pharma, Dongcheng Biochemicals, as well as Changshan Biochemical Pharmaceutical.
第一章 肝素行业概述
1.1 定义和分类
1.2 产业链
第二章 中国肝素行业运行环境分析
2.1 进入壁垒
2.1.1 相关政策
2.1.2 技术要求
2.1.3 资金壁垒
2.2 全球市场供需
2.3 全球市场竞争
2.4 全球市场预测
第三章 中国肝素原料药行业发展概况
3.1 市场现状
3.2 市场供给
3.3 竞争格局
3.4 进出口
3.4.1 出口
3.4.2 进口
3.5 发展前景及预测
第四章 中国肝素制剂行业发展概况
4.1 市场规模
4.2 低分子肝素制剂
4.2.1 低分子肝素钙制剂
4.2.2 低分子肝素钠制剂
4.3普通肝素制剂
4.4 发展前景及预测
第五章 中国主要肝素企业分析
5.1 海普瑞
5.1.1 公司简介
5.1.2 经营状况
5.1.3 营收构成
5.1.4 毛利率
5.1.5 研发及投资
5.1.6 主要客户
5.1.7 肝素业务
5.1.8 发展前景及预测
5.2 千红制药
5.2.1 公司简介
5.2.2 经营状况
5.2.3 营收构成
5.2.4 毛利率
5.2.5 研发及投资
5.2.6 主要客户
5.2.7 肝素业务
5.2.8 发展前景及预测
5.3 东诚药业
5.3.1 公司简介
5.3.2 经营状况
5.3.3 营收构成
5.3.4 毛利率
5.3.5 研发及投资
5.3.6 主要客户
5.3.7 肝素业务
5.3.8 发展前景及预测
5.4 常山药业
5.4.1 公司简介
5.4.2 经营状况
5.4.3 营收构成
5.4.4 毛利率
5.4.5 研发及投资
5.4.6 主要客户
5.4.6 肝素业务
5.4.7 发展前景及预测
5.5 红日药业
5.5.1 公司简介
5.5.2 经营状况
5.5.3 营收构成
5.5.4 毛利率
5.5.5 研发及投资
5.5.6 主要客户
5.5.7 肝素业务
5.5.8 发展前景及预测
5.6 南京健友
5.6.1 公司简介
5.6.2 经营状况及发展前景
5.7 江苏万邦
5.7.1 公司简介
5.7.2 发展情况
5.7.3 经营状况
5.7.4 肝素业务
1. Overview of Heparin Industry
1.1 Definition and Classification
1.2 Industry Chain
2. Operating Environment of Heparin Industry in China
2.1 Access Barriers
2.1.1 Related Policies
2.1.2 Technical Requirements
2.1.3 Capital Barrier
2.2 Global Market Supply & Demand
2.3 Global Market Competition
2.4 Global Market Forecast
3. Development of Heparin API Industry in China
3.1 Status quo
3.2 Supply & Demand
3.3 Competitive Landscape
3.4 Import & Export
3.4.1 Export
3.4.2 Import
3.5 Prospect and Forecast
4. Development of Heparin Preparation Industry in China
4.1 Market Size
4.2 Low Molecular Heparin Preparation
4.2.1 Low Molecular Weight Heparin Calcium Preparation
4.2.2 Low Molecular Weight Heparin Sodium Preparation
4.3 Unfractionated Heparin Preparation
4.4 Prospect and Forecast
5. Key Heparin Enterprises in China
5.1 Hepalink
5.1.1 Profile
5.1.2 Operation
5.1.3 Revenue Structure
5.1.4 Gross Margin
5.1.5 R&D and Investment
5.1.6 Major Clients
5.1.7 Heparin Business
5.1.8 Prospect and Forecast
5.2 Qianhong Bio-pharma
5.2.1 Profile
5.2.2 Operation
5.2.3 Revenue Structure
5.2.4 Gross Margin
5.2.5 R&D and Investment
5.2.6 Major Clients
5.2.7 Heparin Business
5.2.8 Prospect and Forecast
5.3 Dongcheng Biochemicals
5.3.1 Profile
5.3.2 Operation
5.3.3 Revenue Structure
5.3.4 Gross Margin
5.3.5 R&D and Investment
5.3.6 Major Clients
5.3.7 Heparin Business
5.3.8 Prospect and Forecast
5.4 Changshan Biochemical Pharmaceutical
5.4.1 Profile
5.4.2 Operation
5.4.3 Revenue Structure
5.4.4 Gross Margin
5.4.5 R&D and Investment
5.4.6 Major Clients
5.4.7 Heparin Business
5.4.8 Prospect and Forecast
5.5 Tianjin Chase Sun Pharmaceutical
5.5.1 Profile
5.5.2 Operation
5.5.3 Revenue Structure
5.5.4 Gross Margin
5.5.5 R&D and Investment
5.5.6 Major Clients
5.5.7 Heparin Business
5.5.8 Prospect and Forecast
5.6 Nanjing King-friend
5.6.1 Profile
5.6.2 Operation and Prospect
5.7 Wanbang Biopharmaceuticals
5.7.1 Profile
5.7.2 Development
5.7.3 Operation
5.7.4 Heparin Business
表:肝素制剂的用途
表:低分子量肝素制剂和普通肝素制剂的性能比较
图:肝素行业产业链
表:中国肝素钠原料药与肝素规范要求
图:2006-2013年全球肝素制剂市场规模及同比增速
图:2010-2013年全球肝素制剂(分产品)市场规模
图:2013年肝素类药物全球消费分布
图:2007-2013年全球肝素原料药市场需求及同比增速
表:全球肝素主要厂商
表:2010-2014年全球主要肝素制剂品牌及销售额
图:2014-2017年全球肝素原料市场需求预测
图:2014-2017年全球肝素制剂市场规模预测
表:2008-2014年中国肝素原料药主要厂商毛利率
图:2006-2014年中国生猪出栏量及同比增速
表:2008-2014年中国肝素粗品理论产能
图:2008-2014年中国肝素钠原料药理论产能
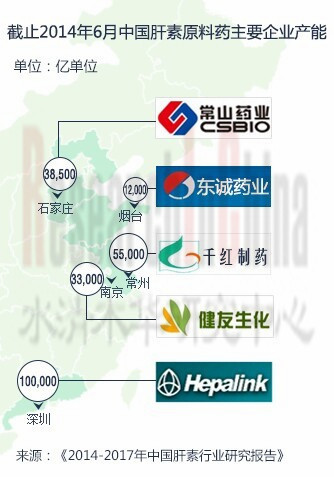
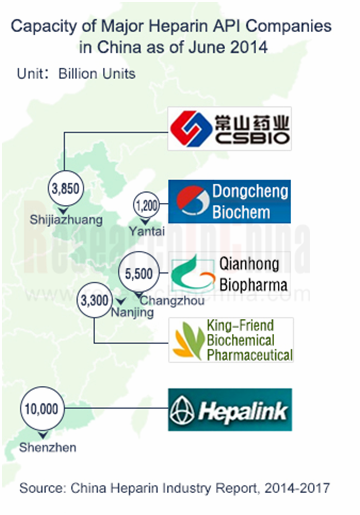
表:截止2014年6月中国肝素原料药主要企业产能(亿单位)
图:2008-2014年中国肝素及盐出口量和出口金额
图:2008-2014年中国肝素及盐出口均价及同比增长
图:2014年1-8月中国肝素及其盐出口(按地区)结构
表:2012-2014年中国肝素及其盐出口前10国家和地区(按金额)
表:2013年中国肝素及盐出口主要企业(按出口金额)
图:2008-2014年中国肝素及其盐进口量、进口金额及单价
表:截止2014年6月中国拟/在建肝素钠原料药项目
图:2007-2013年中国肝素制剂市场规模及同比增长
图:2013年中国肝素制剂类产品市场份额
图:2007-2013年中国低分子肝素制剂市场规模及同比增长
图:2013年中国低分子肝素钙制剂市场份额
表:2013年中国主要低分子肝素钙制剂企业中标价
图:2013年中国低分子肝素钠制剂市场份额
图:2013年中国伊诺肝素钠制剂市场份额
表:2013年中国主要低分子肝素钠制剂企业中标价
表:2009-2014年中国主要肝素钠制剂企业及售价
图:2014-2017年中国肝素制剂市场规模及同比增长
图:2008-2014年海普瑞营业收与利润
图:2008-2014年海普瑞(分地区)主营收入占比
图:2008-2014年海普瑞(分地区)营业收入
表:2008-2014年海普瑞(分产品)主营收入占比
表:2008-2014年海普瑞(分产品)营业收入
图:2008-2014年海普瑞综合毛利率
图:2009-2014年海普瑞研发投入及占营业收入的比重
图:2008-2014年海普瑞前五客户收入贡献及占比
表:2014上半年海普瑞主要子公司资产、收入及利润
图:2011-2013年海普瑞肝素钠原料产销量及库存
图:2008-2014年海普瑞主要肝素产品毛利率
图:2014-2017年海普瑞营业收入和净利润预测
图:2008-2014年千红制药营业收入和利润
图:2008-2014年千红制药(分地区)主营收入占比
图:2008-2014年千红制药(分地区)营业收入
图:2008-2013年千红制药(分产品)主营收入占比
图:2014H1千红制药(分产品)主营收入占比
图:2008-2013年千红制药(分产品)营业收入
图:2008-2014年千红制药综合毛利率
图:2009-2014年千红制药研发投入及占营业收入的比重
表:截止2014年6月千红制药拟/在建项目进展
图:2009-2014年千红制药前五名客户收入贡献及占比
表:2014上半年千红制药子公司资产、营业收入及净利润
图:2008-2013年千红制药肝素类产品毛利率
图:2014-2017年千红制药营业收入和净利润预测
表:2013年东城药业子公司资产、营收及净利润
图:2008-2014年东城药业营业收入和利润
图:2008-2014年东城药业(分地区)主营收入占比
图:2008-2014年东城药业(分地区)营业收入
表:2008-2014年东城药业(分产品)主营收入占比
表:2008-2014年东城药业(分产品)营业收入
图:2008-2014年东城药业综合毛利率
表:2008-2014年东城药业(分产品)毛利率
图:2008-2014年东城药业(分地区)毛利率
图:2010-2014年东城药业研发投入及占公司营业收入的比重
表:截止2013年底东城药业在研项目进度
图:2009-2014年东城药业前五名客户收入贡献及占比
表:2011-2013年东城药业肝素钠产销量及库存
图:2014-2017年东城药业营业收入和净利润预测
图:2008-2014年常山药业营业收入和利润
图:2008-2014年常山药业(分地区)主营收入占比
图:2008-2014年常山药业(分地区)营业收入
表:2008-2014年常山药业(分产品)主营收入占比
表:2008-2014年常山药业(分产品)营业收入
图:2008-2014年常山药业综合毛利率
图:2008-2014年常山药业(分地区)毛利率
表:2008-2014年常山药业(分产品)毛利率
图:2009-2014年常山药业研发投入及占营业收入的比重
表:截止2014年6月常山药业在研产品进度
图:2009-2014年常山药业前五名客户收入贡献及占比
表:2011-2014年常山药业肝素钠原料药及其制剂产销量和库存
图:2014-2017年常山药业营业收入和净利润预测
图:2008-2014年红日药业营业收入和利润
表:2011-2013年红日药业成品药产销量及库存量
表:2008-2014年红日药业(分地区)主营收入占比
表:2008-2013年红日药业(分地区)营业收入
表:2008-2014年红日药业(分产品)主营收入占比
表:2008-2013年红日药业(分产品)营业收入
表:2008-2014年红日药业综合毛利率
表:2008-2014年红日药业(分地区)毛利率
表:2008-2014年红日药业(分产品)毛利率
表:2008-2014年红日药业研发投入及占营业收入的比重
表:2009-2014年红日药业前五名客户收入贡献及占比
图:2008-2014年红日药业肝素业务营业收入及毛利率
图:2014-2017年红日药业营业收入和净利润预测
表:南京健友现有、募投肝素原料药和制剂产能
图:2008-2014年江苏万邦注册资本
图:2008-2014年江苏万邦总资产、净资产及资产负债率
图:2012-2014年江苏万邦营业收入、营业利润及毛利率
图:2008-2014年江苏万邦净利润
Application of Heparin
Performance Comparison between Low Molecular Weight Heparin Preparation and Unfractionated Heparin Preparation
Heparin Industry Chain
Standard Requirements of Heparin Sodium API and Heparin in China
Global Heparin Preparation Market Size and YoY Growth, 2006-2013
Global Heparin Preparations Market Size by Product, 2010-2013
Regional Distribution of Global Heparin Preparations Consumed, 2013
Global Heparin API Demand and YoY Growth, 2007-2013
Major Global Heparin Producers
Revenue of Major Global Heparin Preparation Brands, 2010-2014
Global Demand for Heparin API, 2014-2017E
Global Heparin Preparations Market Size, 2014-2017E
Gross Margin of Major Heparin API Producers in China, 2008-2014
Pig Slaughter Capacity and YoY Growth in China, 2006-2014
China’s Theoretical Capacity of Heparin Crude Products, 2008-2014
China’s Theoretical Capacity of Heparin Sodium API, 2008-2014
Capacity of Major Heparin API Manufacturers in China, as of Jun, 2014
Export Volume and Export Value of Heparin and Its Salts in China, 2008-2014
Average Export Prices of China’s Heparin and Its Salts and YoY Growth, 2008-2014
Export Structure of China’s Heparin and Its Salts by Region, Jan.-Aug. 2014
Top 10 Export Destinations of China’s Heparin and Its Salts by Export Value, 2012-2014
China’s Major Heparin and Its Salts Exporters by Export Value, 2013
Import Volume, Import Value and Unit Price of Heparin and Its Salts in China, 2008-2014
Heparin Sodium API Projects Proposed/Under Construction in China as of Jun. 2014
Chinese Heparin Preparations Market Size and YoY Growth, 2007-2013
Market Share of Heparin Preparations in China by Product, 2013
Chinese Low Molecular Weight Heparin Preparation Market Size and YoY Growth, 2007-2013
Market Share of Low Molecular Weight Heparin Calcium in China, 2013
Bid-winning Price of Major Low Molecular Weight Heparin Calcium Enterprises in China, 2013
Market Share of Low Molecular Weight Heparin Sodium Preparations in China, 2013
Market Share of Enoxaparin Sodium Preparation in China, 2013
Bid-winning Price of Major Low Molecular Weight Heparin Sodium Enterprises in China, 2013
Major Heparin Sodium Preparation Enterprises in China and Their Selling Prices, 2009-2014
Chinese Heparin Preparation Market Size and YoY Growth, 2014-2017E
Revenue and Profit of Hepalink, 2008-2014
Operating Revenue Structure of Hepalink by Region, 2008-2014
Revenue Breakdown of Hepalink by Region, 2008-2014
Operating Revenue Structure of Hepalink by Product, 2008-2014
Revenue Breakdown of Hepalink by Product, 2008-2014
Consolidated Gross Margin of Hepalink, 2008-2014
R&D Costs and % of Total Revenue of Hepalink, 2009-2014
Hepalink’s Revenue from Top 5 Clients and % of Total Revenue, 2008-2014
Assets, Revenue and Profit of Hepalink’s Major Subsidiaries, 2014H1
Output, Sales Volume and Inventory of Hepalink’s Heparin Sodium API, 2011-2013
Gross Margin of Hepalink’s Main Heparin Products, 2008-2014
Revenue and Net Income of Hepalink, 2014-2017E
Revenue and Profit of Qianhong Bio-pharma, 2008-2014
Operating Revenue Structure of Qianhong Bio-pharma by Region, 2008-2014
Revenue Breakdown of Qianhong Bio-pharma by Region, 2008-2014
Operating Revenue Structure of Qianhong Bio-pharma by Product, 2008-2013
Operating Revenue Structure of Qianhong Bio-pharma by Product, 2014H1
Revenue Breakdown of Qianhong Bio-pharma by Product, 2008-2013
Consolidated Gross Margin of Qianhong Bio-pharma, 2008-2014
R&D Costs and % of Total Revenue of Qianhong Bio-pharma, 2009-2014
Progress of Qianhong Bio-pharma’s Projects Proposed/Under Construction as of Jun. 2014
Qianhong Bio-pharma’s Revenue from Top 5 Clients and % of Total Revenue, 2009-2014
Assets, Revenue and Net Income of Qianhong Bio-pharma’s Subsidiaries, 2014H1
Gross Margin of Qianhong Bio-pharma’s Heparin Products, 2008-2013
Revenue and Net Income of Qianhong Bio-pharma, 2014-2017E
Assets, Revenue and Net Income of Dongcheng Biochemicals’ Subsidiaries, 2013
Revenue and Profit of Dongcheng Biochemicals, 2008-2014
Operating Revenue Structure of Dongcheng Biochemicals by Region, 2008-2014
Revenue Breakdown of Dongcheng Biochemicals by Region, 2008-2014
Operating Revenue Structure of Dongcheng Biochemicals by Product, 2008-2014
Revenue Breakdown of Dongcheng Biochemicals by Product, 2008-2014
Consolidated Gross Margin of Dongcheng Biochemicals, 2008-2014
Gross Margin of Dongcheng Biochemicals by Product, 2008-2014
Gross Margin of Dongcheng Biochemicals by Region, 2008-2014
R&D Costs and % of Total Revenue of Dongcheng Biochemicals, 2010-2014
Progress of Dongcheng Biochemicals’ Projects under Research by the End of 2013
Dongcheng Biochemicals’ Revenue from Top 5 Clients and % of Total Revenue, 2009-2014
Output, Sales Volume and Inventory of Dongcheng Biochemicals’ Heparin Sodium, 2011-2013
Revenue and Net Income of Dongcheng Biochemicals, 2014-2017E
Revenue and Profit of Changshan Biochemical, 2008-2014
Operating Revenue Structure of Changshan Biochemical Pharmaceutical by Region, 2008-2014
Revenue Breakdown of Changshan Biochemical Pharmaceutical by Region, 2008-2014
Operating Revenue Structure of Changshan Biochemical Pharmaceutical by Product, 2008-2014
Revenue Breakdown of Changshan Biochemical Pharmaceutical by Product, 2008-2014
Consolidated Gross Margin of Changshan Biochemical Pharmaceutical, 2008-2014
Gross Margin of Changshan Biochemical Pharmaceutical by Region, 2008-2014
Gross Margin of Changshan Biochemical Pharmaceutical by Product, 2008-2014
R&D Costs and % of Total Revenue of Changshan Biochemical Pharmaceutical, 2009-2014
Progress of Changshan Biochemical Pharmaceutical’s Products under Research as of Jun. 2014
Changshan Biochemical Pharmaceutical’s Revenue from Top 5 Clients and % of Total Revenue, 2009-2014
Output, Sales Volume and Inventory of Changshan Biochemical Pharmaceutical’s Heparin Sodium API and Its Preparations, 2011-2014
Revenue and Net Income of Changshan Biochemical Pharmaceutical, 2014-2017E
Revenue and Profit of Tianjin Chase Sun Pharmaceutical, 2008-2014
Output, Sales Volume and Inventory of Tianjin Chase Sun Pharmaceutical’s Finished Drug Products, 2011-2013
Operating Revenue Structure of Tianjin Chase Sun Pharmaceutical by Region, 2008-2014
Revenue Breakdown of Tianjin Chase Sun Pharmaceutical by Region, 2008-2013
Operating Revenue Structure of Tianjin Chase Sun Pharmaceutical by Product, 2008-2014
Revenue Breakdown of Tianjin Chase Sun Pharmaceutical by Product, 2008-2013
Consolidated Gross Margin of Tianjin Chase Sun Pharmaceutical, 2008-2014
Gross Margin of Tianjin Chase Sun Pharmaceutical by Region, 2008-2014
Gross Margin of Tianjin Chase Sun Pharmaceutical by Product, 2008-2014
R&D Costs and % of Total Revenue of Tianjin Chase Sun Pharmaceutical, 2008-2014
Tianjin Chase Sun Pharmaceutical’s Revenue from Top 5 Clients and % of Total Revenue, 2009-2014
Tianjin Chase Sun Pharmaceutical’s Revenue and Gross Margin from Heparin Business, 2008-2014
Revenue and Net Income of Tianjin Chase Sun Pharmaceutical, 2014-2017E
Existing and Fund-raised Heparin API and Preparation Capacities of Nanjing King-friend
Registered Capital of Wanbang Biopharmaceuticals, 2008-2014
Total Assets, Net Assets and Asset-liability Ratio of Wanbang Biopharmaceuticals, 2008-2014
Revenue, Operating Income and Gross Margin of Wanbang Biopharmaceuticals, 2012-2014
Net Income of Wanbang Biopharmaceuticals, 2008-2014
如果这份报告不能满足您的要求,我们还可以为您定制报告,请 留言说明您的详细需求。
|