|
|
|
报告导航:研究报告—
制造业—化工
|
|
2014-2017年全球及中国钛白粉行业研究报告 |
 |
字数:3.6万 |
页数:125 |
图表数:134 |
|
中文电子版:8000元 |
中文纸版:4000元 |
中文(电子+纸)版:8500元 |
|
英文电子版:2300美元 |
英文纸版:2500美元 |
英文(电子+纸)版:2600美元 |
|
编号:LMX057
|
发布日期:2014-10 |
附件:下载 |
 |
|
|
2013年以来,全球及中国钛白粉行业主要呈现以下几个发展特点:
 全球钛白粉产能增长停滞,新增产能主要集中在中国。2013年,全球钛白粉产能656万吨,2012年为655万吨。钛白粉产能增长主要集中在中国,2013年中国钛白粉产能达到293.5万吨,同比增长5.4%,占全球的比例从2010年30%左右增至45%左右,产能排名全球第一。 全球钛白粉产能增长停滞,新增产能主要集中在中国。2013年,全球钛白粉产能656万吨,2012年为655万吨。钛白粉产能增长主要集中在中国,2013年中国钛白粉产能达到293.5万吨,同比增长5.4%,占全球的比例从2010年30%左右增至45%左右,产能排名全球第一。
受欧美经济复苏影响,2014年中国钛白粉行业景气度回升,主要表现如下:
※出口量大幅增长。2012-2013年,中国钛白粉出口量基本保持在40万吨左右,出口遭遇瓶颈。2014年1-8月,中国钛白粉出口37.6万吨,同比大幅增长48.62%。
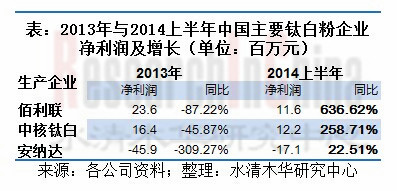
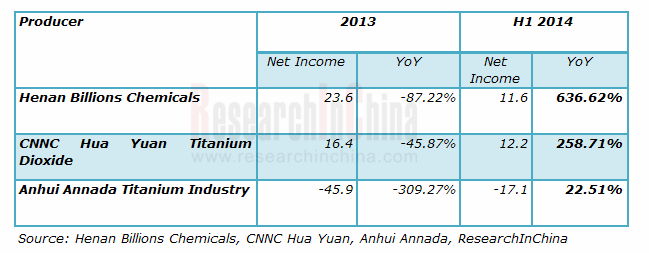
※主要企业净利润增长明显。2013年,中国仅有不到20%的钛白粉企业处于微薄盈利水平。2014年以来,随着钛白粉价格的回升以及国外需求的回暖,钛白粉生产企业业绩明显改善,佰利联的净利润同比增速达到636.62%。
※钛白粉价格上涨。2014年以来,在国内国外大厂不断提高报价之后,国内钛白粉市场价格有走高的趋势。2014年9月,中国钛白粉市场均价14350元/吨,8月份的均价为13640元/吨,环比微增5.21%;较2014年1月份增长12.11%。
环保政策趋严,未来中国钛白粉行业将会朝着大型化和氯化法方向发展。中国钛白粉产能98%以上都采用硫酸法生产工艺。2014年内将颁布的《钛白粉行业准入条件》(修订版)以及《钛白粉工业污染防治技术政策》,将促进产业结构升级和行业集聚,长期利于行业发展。
《2014-2017年全球及中国钛白粉行业研究报告》主要包括以下内容:
l 全球钛白粉行业产能、产品结构、区域产能结构、生产企业产能及竞争格局分析;
l 中国钛白粉产业政策、产能、产量、消费量、进出口、价格走势及行业毛利率等;
l 中国钛白粉行业市场结构、市场格局及主要企业盈利分析;
l 钛白粉上游原材料产业分析,分别对钛矿和硫酸市场进行研究,进而分析钛白粉生产成本;
l 钛白粉下游应用领域分析,包括下游需求结构、涂料、塑料、造纸及脱硝催化剂行业对钛白粉的需求研究;
l 11家中国重点钛白粉生产企业及5家全球主要钛白粉生产企业分析,包含企业经营状况、钛白粉产销量、营收构成、毛利率、主要投资项目等;
l 中国钛白粉行业发展前景,包括产能、产量、进出口量及总需求量数据预测。
Since 2013, global and China titanium dioxide industry has been characteristic of the following:
- Global titanium dioxide capacity growth suffered stagnation while new capacity was mainly concentrated in China: the titanium dioxide capacity worldwide in 2013 was 6.56 million tons, against the figure 6.55 million tons in 2012, while the new titanium dioxide capacity, which was mainly contributed by China, stood at 2.935 million tons in 2013, up 5.4% year on year, and accounting for approximately 45% of the world’s total as opposed to 30% in 2010.
- Thanks to economic recovery in Europe and America, the prosperity of titanium dioxide industry in China saw a pickup in 2014, which can be elaborated below:
- Great surge in export volume: during 2012-2013, the export volume of titanium dioxide in China remained around 400 kt; while during Jan.-Aug. 2014, China exported 376 kt of titanium dioxide, soaring by 48.62% yr-on-yr.
- Substantial growth in net income of major companies: in 2013, there were merely less than 20% titanium dioxide companies in the black, seeing meager profit; while from 2014, with the rally in titanium dioxide price and the recovery of overseas demand, titanium dioxide producers enjoyed distinct improvement in performance, in which Henan Billions Chemicals reported a year-on-year growth rate of as high as 636.62% .
-
Rise in titanium dioxide price: since 2014, large titanium dioxide manufacturers at home and abroad continuously have raised their quotations, and the titanium dioxide price in the Chinese market tends upwards. In Sept. 2014, Chinese titanium dioxide was averagely priced at RMB14,350/ton, slightly increasing by 5.21% in contrast with RMB13,640/ton in Aug.2014 and jumping by 12.11% compared with the figure in Jan. 2014.
Net Income and YoY Growth Rate of Major TiO2 Producers in China, 2013 and H1 2014 (Unit: RMB mln)
- Driven by the increasingly stricter environmental protection policies, the titanium dioxide industry in China will develop toward large scale and chlorination process. Over 98% of the titanium dioxide in China was produced via sulphate process. Access Conditions for Titanium Dioxide Industry (Revised) and Policy on Titanium Dioxide-oriented Industrial Pollution Prevention & Control Technology will be released in 2014 to promote industrial structure upgrading and industrial agglomeration, which would be conducive to the industrial development for a long time.
Global and China Titanium Dioxide Industry Report, 2014-2017, highlights the followings:
Capacity, product structure, regional capacity structure, producers’ capacity and competitive landscape of global titanium dioxide industry;
Policy, capacity, output, consumption, import & export, price trend, industrial gross margin, etc. of titanium dioxide industry in China;
Market structure, market pattern and profitability of major producers in China titanium dioxide industry;
Upstream titanium dioxide raw material industry analysis from the perspective of titanium ore and sulfuric acid market, and cost analysis of titanium dioxide;
Downstream application of titanium dioxide, involving demand structure and the demand from sectors such as paint, plastic, papermaking and denitration catalyst;
Operation, output and sales volume of TiO2, revenue structure, gross margin, major investment projects, etc. of 11 key Chinese titanium dioxide producer and 5 major titanium dioxide players in the world;
Development prospect of China’s titanium dioxide industry, covering forecast for capacity, output, import volume & export volume and total demand.
前言
第一章 钛白粉行业概述
1.1 定义
1.2 分类
1.3 生产工艺
1.4 产业链
1.5 行业相关政策
1.5.1 产业政策
1.5.2 进出口相关政策
第二章 全球钛白粉行业发展状况
2.1 产品生产结构
2.2 产能
2.3 企业竞争格局
第三章 中国钛白粉行业发展状况
3.1 产能
3.1.1 整体分析
3.1.2 产能数据
3.1.3 新增产能
3.2 产量
3.2.1 产量数据
3.2.2 产量结构
3.3 消费量
3.4 进出口
3.4.1 进口
3.4.2 出口
3.5 价格走势
3.6 行业毛利率
第四章 中国钛白粉行业市场格局分析
4.1 市场结构
4.2 市场格局
4.3 企业盈利分析
第五章 产业链分析——上游原材料
5.1 钛简介
5.2 钛矿
5.2.1 全球钛矿储量分布
5.2.2 全球钛矿产量分布
5.2.3 中国钛资源情况
5.2.4 中国钛矿进口情况
5.2.5 钛精矿价格走势
5.3 硫酸
5.3.1 产量情况
5.3.2 价格走势
5.4 钛白粉成本分析
第六章 产业链分析——下游应用行业
6.1 下游需求结构
6.2 涂料行业
6.2.1 市场分析
6.2.2 对钛白粉的需求
6.3 塑料行业
6.4 造纸行业
6.5 脱硝催化剂
6.5.1 市场分析
6.5.2 对钛白粉的需求
第七章 国内重点钛白粉企业分析
7.1 山东东佳
7.1.1 公司简介
7.1.2 钛白粉产销量
7.1.3 经营状况
7.1.4 放弃IPO
7.2 佰利联
7.2.1 公司简介
7.2.2 钛白粉产销量
7.2.3 经营状况
7.2.4 营收构成
7.2.5 毛利率分析
7.2.6 研发及投资
7.2.7 原料采购与主要客户
7.2.8 业绩预测
7.3 中核钛白
7.3.1 公司简介
7.3.2 资产重组
7.3.3 钛白粉产销量
7.3.4 经营状况
7.3.5 营收构成
7.3.6 毛利率分析
7.3.7 研发与投资
7.3.8 公司收购
7.3.9 竞争优势
7.3.10 业绩预测
7.4 金浦钛业
7.4.1 公司简介
7.4.2 南京钛白成功借壳*ST吉药
7.4.3 钛白粉产销量
7.4.4 经营状况
7.4.5 营收构成
7.4.6 毛利率分析
7.4.7 研发与投资
7.4.8 竞争优势
7.4.9 业绩预测
7.5 安纳达
7.5.1 公司简介
7.5.2 钛白粉产销量
7.5.3 经营状况
7.5.4 营收构成
7.5.5 毛利率分析
7.5.6 研发与投资
7.5.7 竞争优势
7.5.8 业绩预测
7.6 四川龙蟒
7.6.1 公司简介
7.6.2 钛白粉产销量
7.7 攀钢钒钛
7.7.1 公司简介
7.7.2 钛白粉产销量
7.7.3 经营状况
7.7.4 营收构成
7.7.5 毛利率分析
7.7.6 研发与投资
7.7.7 竞争优势
7.7.8 业绩预测
7.8 云南大互通工贸有限公司
7.8.1 公司简介
7.8.2 发展历程
7.8.3 销售网络
7.9 宁波新福钛白粉有限公司
7.10 江苏太白集团
7.11 蓝星化工广西分公司
第八章 国外重点钛白粉企业分析
8.1 杜邦(DuPont)
8.1.1 公司简介
8.1.2 钛白粉业务收入
8.2 科斯特(Cristal)
8.2.1 公司简介
8.2.2 钛白粉业务
8.2.4 公司动态
8.3 享兹曼(Huntsman)
8.3.1 公司简介
8.3.2 钛白粉产销情况
8.3.3 经营状况
8.3.4 公司动态
8.3.5 发展战略
8.3.6 在华发展
8.4 康诺斯(Kronos)
8.4.1 公司简介
8.4.2 钛白粉产销量
8.4.3 经营状况
8.5 特诺(Tronox)
8.5.1 公司简介
8.5.2 钛白粉产销量
8.5.3 经营状况
8.5.4 在华发展
8.5.5 公司动态
第九章 市场总结与发展预测
9.1 市场总结
9.1.1 国内供应
9.1.2 国内需求
9.1.3 进出口
9.1.4 市场格局
9.2 发展预测
9.2.1 需求预测
9.2.2 供给预测
Preface
1 Overview of Titanium Dioxide
1.1 Definition
1.2 Classification
1.3 Production Process
1.4 Industry Chain
1.5 Policies
1.5.1 Industrial Policies
1.5.2 Policies on Import and Export
2 Global Titanium Dioxide Industry
2.1 Production Structure
2.2 Capacity
2.3 Competition among Enterprises
3 China Titanium Dioxide Industry
3.1 Capacity
3.1.1 Holistic Analysis
3.1.2 Capacity Figures
3.1.3 New Capacity
3.2 Output
3.2.1 Output Figures
3.2.2 Output Structure
3.3 Consumption
3.4 Import and Export
3.4.1 Import
3.4.2 Export
3.5 Price Trend
3.6 Gross Margin
4 China Titanium Dioxide Market Situation
4.1 Market Structure
4.2 Market Pattern
4.3 Enterprises’ Profitability
5 Industry Chain -- Upstream
5.1 Introduction to Titanium
5.2 Titanium Ore
5.2.1 Global Reserves
5.2.2 Global Output
5.2.3 Titanium Resources in China
5.2.4 China’s Import of Titanium Ore
5.2.5 Price Trend of Titanium Concentrates
5.3 Sulfuric Acid
5.3.1 Output
5.3.2 Price Trend
5.4 Cost Analysis of Titanium Dioxide
6 Industry Chain -- Downstream
6.1 Demand Structure
6.2 Paint Industry
6.2.1 Market Analysis
6.2.2 Demand for Titanium Dioxide
6.3 Plastic Industry
6.4 Papermaking Industry
6.5 Denitration Catalyst
6.5.1 Market Analysis
6.5.2 Demand for Titanium Dioxide
7 Key Titanium Dioxide Enterprises in China
7.1 Shandong Dongjia Group Co., Ltd.
7.1.1 Profile
7.1.2 Output and Sales Volume of TiO2
7.1.3 Operation
7.1.4 Scrapped IPO
7.2 Henan Billions Chemicals Co., Ltd.
7.2.1 Profile
7.2.2 Output and Sales Volume of TiO2
7.2.3 Operation
7.2.4 Revenue Structure
7.2.5 Gross Margin
7.2.6 R & D and Investment
7.2.7 Procurement and Clients
7.2.8 Performance Forecast
7.3 CNNC Hua Yuan Titanium Dioxide Co., Ltd.
7.3.1 Profile
7.3.2 Asset Reorganization
7.3.3 Output and Sales Volume of TiO2
7.3.4 Operation
7.3.5 Revenue Structure
7.3.6 Gross Margin
7.3.7 R & D and Investment
7.3.8 Acquisitions
7.3.9 Competitive Advantage
7.3.10 Performance Forecast
7.4 Jilin Gpro Titanium Industry Co., Ltd.
7.4.1 Profile
7.4.2 Back-door Listing
7.4.3 Output and Sales Volume of Titanium Dioxide
7.4.4 Operation
7.4.5 Revenue Structure
7.4.6 Gross Margin
7.4.7 R & D and Investment
7.4.8 Competitive Advantage
7.4.9 Performance Forecast
7.5 Anhui Annada Titanium Industry Co., Ltd.
7.5.1 Profile
7.5.2 Output and Sales Volume of TiO2
7.5.3 Operation
7.5.4 Revenue Structure
7.5.5 Gross Margin
7.5.6 R & D and Investment
7.5.7 Competitive Advantage
7.5.8 Performance Forecast
7.6 Sichuan Lomon Titanium Industry Co., Ltd.
7.6.1 Profile
7.6.2 Output and Sales Volume of Titanium Dioxide
7.7 Pangang Group Vanadium Titanium & Resources Co., Ltd.
7.7.1 Profile
7.7.2 Output and Sales Volume of Titanium Dioxide
7.7.3 Operation
7.7.4 Revenue Structure
7.7.5 Gross Margin
7.7.6 R & D and Investment
7.7.7 Competitive Advantage
7.7.8 Performance Forecast
7.8 Yunnan Dahutong Industry & Trading Co., Ltd.
7.8.1 Profile
7.8.2 Development Course
7.8.3 Sales Network
7.9 Ningbo Xinfu Titanium Dioxide Co., Ltd
7.10 Jiangsu Taibai Group Co., Ltd.
7.11 Blue Star New Chemical Materials Co., Ltd. Guangxi Branch
8 Key Foreign Titanium Dioxide Companies
8.1 DuPont
8.1.1 Profile
8.1.2 Revenue from Titanium Dioxide Business
8.2 Cristal
8.2.1 Profile
8.2.2 Titanium Dioxide Business
8.2.4 Dynamics
8.3 Huntsman
8.3.1 Profile
8.3.2 Output and Sales Volume of Titanium Dioxide
8.3.3 Operation
8.3.4 Dynamics
8.3.5 Strategy
8.3.6 Development in China
8.4 Kronos
8.4.1 Profile
8.4.2 Output and Sales Volume of Titanium Dioxide
8.4.3 Operation
8.5 Tronox
8.5.1 Profile
8.5.2 Output and Sales Volume of Titanium Dioxide
8.5.3 Operation
8.5.4 Development in China
8.5.5 Dynamics
9 Market Overview and Development Forecast
9.1 Market Overview
9.1.1 Domestic Supply
9.1.2 Domestic Demand
9.1.3 Import and Export
9.1.4 Market Pattern
9.2 Development Forecast
9.2.1 Demand Forecast
9.2.2 Supply Forecast
图:钛白粉分类
图:硫酸法钛白粉生产工艺
图:氯化法钛白粉生产工艺
图:钛白粉行业产业链
表:2005-2014年中国钛白粉行业相关政策及标准
表:中国钛白粉进口涉及的政策和关税情况
图:全球钛白粉产能构成(按生产工艺)
图:2004-2013年全球钛白粉产能
图:2013年全球钛白粉产能结构(按国家)
图:2013年全球钛白粉市场份额(按企业产能)
图:2013年全球主要钛白粉生产企业产能
表:中国钛白粉企业产能规模演变
图:1999-2013年中国钛白粉产能
表:2013-2015年中国主要钛白粉新增产能
图:1999-2013年中国钛白粉产量
图:2000-2013年中国金红石型钛白粉产量及占总产量的比重
图:2013年中国钛白粉产量结构
图:1999-2013年中国钛白粉消费量
图:1999-2014年中国钛白粉进口量
图:1999-2014年中国钛白粉出口量
图:2006-2014年中国钛白粉市场价格
图:2009-2014年佰利联和安纳达钛白粉产品毛利率
图:2013年中国钛白粉产能结构(按工艺)
表:中国氯化法钛白粉新增产能统计
表:2013-2014年中国钛白粉生产企业产能及产量对比
表:2011年、2013年、2014上半年中国主要钛白粉企业净利润
图:中国和国外原料钛加工结构对比
图:全球钛铁矿储量分布(分国家)
图:全球钛白粉生产原料分布(按原料类型)
图:2010年全球钛铁矿产量分布(分国家)
图:2000-2015年全球钛矿供需情况
表:中国钛矿资源分布
图:2006-2014年中国钛矿砂及精矿进口量
图:2012-2014年中国钛精矿价格(不含税)
图:2005-2014年中国硫酸产量
图:2006-2014年中国硫酸(98%)市场价格
图:2013年金浦钛业钛白粉业务生产成本构成
图:2013年全球钛白粉消费结构
图:2013年中国钛白粉消费结构
图:2001-2014年中国涂料产量
图:2007-2013年中国钛白粉涂料需求量
表:涂料各细分领域对国产钛白粉和进口钛白粉的需求对比
图:2005-2014年中国塑料制品产量
图:2005-2014年中国机制纸及纸板产量
表:2013年中国主要脱硝催化剂生产厂家产能(产能超过10000立方米/年)
图:2011-2015中国纳米钛白粉需求量
表:山东东佳集团参股、控股企业情况
表:2007-2013年山东东佳钛白粉产能、产量及销量
图:2007-2013年山东东佳销售收入
表:山东东佳上市历程
表:2010-2014年佰利联钛白粉产量、销量及库存量
图:2009-2014年佰利联营业收入与净利润
表:2008-2011年佰利联营业收入(分产品)构成
表:2012-2014年佰利联营业收入(分产品)
图:2008-2014年佰利联营业收入(分区域)构成
表:2009-2011年佰利联毛利率及主要产品毛利率
表:2012-2014年佰利联毛利率(分产品)
表:2009-2014年佰利联研发收入及占比
表:佰利联主要在建项目
表:2014-2017年佰利联营业收入与净利润预测
图:2007-2014年中核钛白公司钛白粉产量
表:2012-2013年中核钛白公司钛白粉产品产量、销量及库存量
图:2009-2014年中核钛白营业收入与净利润
表:2012-2014年中核钛白营业收入(分产品)构成
图:2012-2014年中核钛白营业收入(分区域)构成
表:2012-2014年中核钛白毛利率
表:2012-2014年中核钛白研发费用及占营业收入的比例
表:2014-2017年中核钛白营业收入与净利润预测
表:2012-2013年金浦钛业钛白粉产量、销量及库存量
图:2011-2014年金浦钛业营业收入与净利润
表:2012-2014年金浦钛业营业收入(分产品)构成
图:2012-2014年金浦钛业营业收入(分区域)构成
表:2012-2014年金浦钛业主要产品毛利率
表:2012-2014年金浦太白研发费用及占公司营业收入的比重
表:金浦钛业主要项目介绍
表:2014-2017年金浦钛业营业收入与净利润预测
表:2011-2014年安纳达钛白粉产销量及库存量
图:2009-2014年安纳达营业收入与净利润
图:2009-2013年安纳达营业收入(分产品)构成
表:2014上半年安纳达营业收入(分产品)构成
图:2009-2014年安纳达营业收入(分区域)构成
图:2009-2013年安纳达毛利率
表:2014上半年安纳达毛利率
表:2009-2014年安纳达研发投入及占比
表:2014-2017年安纳达营业收入与净利润预测
图:四川龙蟒集团产业分布
图:2007-2013年四川龙蟒钛白粉产能及产量
表:2011-2014年攀钢钒钛钛白粉产量、销量及库存量
图:2011-2014年攀钢钒钛钛白粉营业收入及同比增长
图:2009-2014年攀钢钒钛营业收入与净利润
图:2012-2014年攀钢钒钛营业收入(分产品)构成
图:2010-2014年攀钢钒钛营业收入(分区域)构成
表:2011-2014年攀钢钒钛主要产品毛利率
表:2012-2014年攀钢钒钛研发投入及占比
表:攀钢钒钛钛白粉项目
表:2014-2017年攀钢钒钛营业收入与净利润预测
表:云南大互通工贸有限公司发展历程
图:云南大互通工贸有限公司中国销售网络
图:云南大互通工贸有限公司国外销售网络
表:杜邦全球钛白粉工厂情况
图:杜邦主要钛白粉产品应用领域
图:2011-2013年DuPont公司Performance Chemicals业务主要营业指标
图:2014年上半年DuPont公司营业收入与营业利润构成(分业务)
图:2013年DuPont公司Performance Chemicals业务收入结构
图:2013年DuPont公司Performance Chemicals业务收入(分区域)
图:科斯特股权结构
图:科斯特业务全球布局
图:享兹曼钛白粉产能全球分布
图:2009-2014年享兹曼钛白粉营业收入
图:2013年钛白粉营业收入构成
图:2010-2014年享兹曼营业收入与净利润
图:2013-2014年享兹曼营业收入与EBITDA构成
图:2013年享兹曼营业收入(分应用领域)构成
图:享兹曼主要项目
图:享兹曼在华钛白粉业务布局
表:2009-2013年Kronos在欧洲和北美钛白粉市场份额
图:康诺斯生产基地全球分布
表:康诺斯全球钛白粉工厂及产能
表:2007-2014年Kronos钛白粉产销量
图:2013年康诺斯钛白粉销售结构(按销量)
图:2014年公司钛白粉产能结构预测
图:2007-2014年康诺斯营业收入与净利润
图:2011-2013年康诺斯收入结构
图:特诺全球业务分布
表:Tronox全球钛白粉工厂及产能
图:2009-2014年特诺营业收入与净利润
图:2011-2013年特诺营业收入与净利润构成(分业务)
图:2011-2013年特诺营业收入(分区域)构成
表:中国钛白粉主要消费领域对比
图:2013年全球主要钛白粉企业产能
图:2014-2017年中国钛白粉出口量预测
图:2014-2017年中国钛白粉消费量预测
图:2014-2017年中国钛白粉产能及产量预测
图:2014-2017年中国钛白粉进口量预测
Classification of Titanium Dioxide
Titanium Dioxide Sulphate Process
Titanium Dioxide Chloride Process
Titanium Dioxide Industry Chain
Policies and Standards on Chinese Titanium Dioxide Industry, 2005-2014
Policies and Duties Regarding Titanium Dioxide Import in China
Global Titanium Dioxide Capacity Structure (by Production Process)
Global Titanium Dioxide Capacity, 2004-2013
Global Titanium Dioxide Capacity Structure (by Country), 2013
Global Titanium Dioxide Market Share (by Enterprise Capacity), 2013
Capacities of Major Global Titanium Dioxide Producers, 2013
Capacity Development of Chinese Titanium Dioxide Producers
Titanium Dioxide Capacity in China, 1999-2013
New Capacity of Titanium Dioxide in China, 2013-2015E
Titanium Dioxide Output in China, 1999-2013
Output of Rutile Titanium Dioxide and % of Total Output in China, 2000-2013
Output Structure of Titanium Dioxide in China, 2013
Titanium Dioxide Consumption in China, 1999-2013
China’s Import Volume of Titanium Dioxide, 1999-2014
China’s Export Volume of Titanium Dioxide, 1999-2014
Titanium Dioxide Price in the Chinese Market, 2006-2014
Gross Margins of Titanium Dioxide Products of Henan Billions Chemicals and Anhui Annada Titanium Industry, 2009-2014
Capacity Structure of Titanium Dioxide in China (by Process), 2013
New Capacity of Chloride Process Titanium Dioxide in China
Capacity and Output of Chinese Titanium Dioxide Producers, 2013-2014
Net Income of Major Titanium Dioxide Producers in China, 2011, 2013, and H1 2014
China vs. the World: Titanium Processing Structure
Ilmenite Reserves in the World (by Country)
Distribution of Titanium Dioxide Raw Materials in the World (by Material Type)
Ilmenite Output in the World (By Country), 2010
Global Titanium Ore Supply and Demand, 2010-2015E
Titanium Ore Resources in China
China’s Import Volume of Titanium Ores and Concentrates, 2006-2014
Titanium Concentrate Price (excl. tax) in China, 2012-2014
Sulfuric Acid Output in China, 2005-2014
Sulfuric Acid (98%) Price in Chinese Market, 2006-2014
Production Cost Structure of Titanium Dioxide Business of Jilin Gpro Titanium Industry, 2013
Global Titanium Dioxide Demand Structure, 2013
China’s Titanium Dioxide Demand Structure, 2013
Paint Output in China, 2001-2014
China’s Demand for Titanium Dioxide Paint, 2007-2013
Application Contrast of Home-made and Imported Titanium Dioxide in Paint Segments
Output of Plastic Products in China, 2005-2014
Output of Machine-made Paper and Paperboard in China, 2005-2014
Capacity of Major Denitration Catalyst Producers in China, 2013 (>10,000 cubic meter per annum)
China’s Demand for Nanometer Titanium Dioxide, 2011-2015E
Companies Held and Controlled by Shandong Dongjia Group
Titanium Dioxide Capacity, Output and Sales Volume of Shandong Dongjia Group, 2007-2013
Sales of Shandong Dongjia Group, 2007-2013
IPO of Shandong Dongjia Group
Titanium Dioxide Output, Sales Volume and Inventory of Henan Billions Chemicals, 2010-2014
Revenue and Net Income of Henan Billions Chemicals, 2009-2014
Revenue Structure of Henan Billions Chemicals (by Product), 2008-2011
Revenue Breakdown of Henan Billions Chemicals (by Product), 2012-2014
Revenue Structure of Henan Billions Chemicals (by Region), 2008-2014
Gross Margin of Henan Billions Chemicals, 2009-2011
Gross Margin of Henan Billions Chemicals, 2012-2014
R&D Costs and % of Total Revenue of Henan Billions Chemicals, 2009-2014
Key Projects under Construction of Henan Billions Chemicals
Revenue and Net Income of Henan Billions Chemicals, 2014E-2017E
Titanium Dioxide Output of CNNC Hua Yuan Titanium Dioxide, 2007-2014
Titanium Dioxide Output, Sales Volume and Inventory of CNNC Hua Yuan Titanium Dioxide, 2012-2013
Revenue and Net Income of CNNC Hua Yuan Titanium Dioxide, 2009-2014
Revenue Structure of CNNC Hua Yuan Titanium Dioxide (by Product), 2012-2014
Revenue Structure of CNNC Hua Yuan Titanium Dioxide (by Region), 2012-2014
Gross Margin of CNNC Hua Yuan Titanium Dioxide, 2012-2014
R&D Costs and % of Total Revenue of CNNC Hua Yuan Titanium Dioxide, 2012-2014
Revenue and Net Income of CNNC Hua Yuan Titanium Dioxide, 2014E-2017E
Titanium Dioxide Output, Sales Volume and Inventory of Jilin Gpro Titanium Industry, 2012-2013
Revenue and Net Income of Jilin Gpro Titanium Industry, 2011-2014
Revenue Structure of Jilin Gpro Titanium Industry (by Product), 2012-2014
Revenue Structure of Jilin Gpro Titanium Industry (by Region), 2012-2014
Gross Margin of Main Products of Jilin Gpro Titanium Industry, 2012-2014
R&D Costs and % of Total Revenue of Jilin Gpro Titanium Industry, 2012-2014
Key Project of Jilin Gpro Titanium Industry
Revenue and Net Income of Jilin Gpro Titanium Industry, 2014E-2017E
Titanium Dioxide Output, Sales Volume and Inventory of Anhui Annada Titanium Industry, 2011-2014
Revenue and Net Income of Anhui Annada Titanium Industry, 2009-2014
Revenue Structure of Anhui Annada Titanium Industry (by Product), 2009-2013
Revenue Structure of Anhui Annada Titanium Industry (by Product), H1 2014
Revenue Structure of Anhui Annada Titanium Industry (by Region), 2009-2014
Gross Margin of Anhui Annada Titanium Industry, 2009-2013
Gross Margin of Anhui Annada Titanium Industry, H1 2014
R&D Costs and % of Total Revenue of Anhui Annada Titanium Industry, 2009-2014
Revenue and Net Income of Anhui Annada Titanium Industry, 2014E-2017E
Industrial Distribution of Sichuan Lomon Corporation
Titanium Dioxide Capacity and Output of Sichuan Lomon Corporation, 2007-2013
Titanium Dioxide Output, Sales Volume and Inventory of Pangang Group Vanadium Titanium & Resources, 2011-2014
Titanium Dioxide Revenue and YoY Growth of Pangang Group Vanadium Titanium & Resources, 2011-2014
Revenue and Net Income of Pangang Group Vanadium Titanium & Resources, 2009-2014
Revenue Structure of Pangang Group Vanadium Titanium & Resources (by Product), 2012-2014
Revenue Structure of Pangang Group Vanadium Titanium & Resources (by Region), 2010-2014
Gross Margin of Main Products of Pangang Group Vanadium Titanium & Resources, 2011-2014
R&D Costs and % of Total Revenue of Pangang Group Vanadium Titanium & Resources, 2012-2014
Titanium Dioxide Projects of Pangang Group Vanadium Titanium & Resources
Revenue and Net Income of Pangang Group Vanadium Titanium & Resources, 2014E-2017E
Development Course of Yunnan Dahutong Industry & Trading
Sales Network of Yunnan Dahutong Industry & Trading in China
Sales Network of Yunnan Dahutong Industry & Trading Worldwide
Titanium Dioxide Plants of DuPont Worldwide
Application of DuPont’s Titanium Dioxide Products
Main Operating Indicators for Performance Chemicals Business of DuPont, 2011-2013
Revenue and Operating Income Structure of DuPont (by Business), H1 2014
Revenue Structure of Performance Chemicals Business of DuPont, 2013
Revenue Breakdown of Performance Chemicals Business of DuPont (by Region), 2013
Ownership Structure of Cristal
Global Business Layout of Cristal
Titanium Dioxide Capacity Distribution of Huntsman Worldwide
Titanium Dioxide Revenue of Huntsman, 2009-2014
Titanium Dioxide Revenue Structure, 2013
Revenue and Net Income of Huntsman, 2010-2014
Revenue and EBITDA Breakdown of Huntsman, 2013-2014
Revenue Structure of Huntsman (by Applications), 2013
Key Projects of Huntsman
Titanium Dioxide Business Layout of Huntsman in China
Share of Kronos in European and North American Titanium Dioxide Markets, 2009-2013
Production Bases of Kronos Worldwide
Titanium Dioxide Plants and Their Capacity of Kronos Worldwide
Titanium Dioxide Output and Sales Volume of Kronos, 2007-2014
Titanium Dioxide Sales Structure of Kronos (by Sales Volume), 2013
Titanium Dioxide Capacity Structure of Kronos, 2014E
Revenue and Net Income of Kronos, 2007-2014
Revenue Structure of Kronos, 2011-2013
Business Layout of Tronox Worldwide
Titanium Dioxide Plants and Their Capacity of Tronox Worldwide
Revenue and Net Income of Tronox, 2009-2014
Revenue and Net Income Structure of Tronox (by Business), 2011-2013
Revenue Structure of Tronox (by Region), 2011-2013
Consumption Contrast of Titanium Dioxide in China
Capacities of Major Global Titanium Dioxide Producers, 2013
China’s Export Volume of Titanium Dioxide, 2014E-2017E
Consumption of Titanium Dioxide Consumption in China, 2014E-2017E
Capacity and Output of Titanium Dioxide in China, 2014E-2017E
China’s Import Volume of Titanium Dioxide, 2014E-2017E
如果这份报告不能满足您的要求,我们还可以为您定制报告,请 留言说明您的详细需求。
|