|
|
|
报告导航:研究报告—
制造业—化工
|
|
2014-2020年中国环氧乙烷产业研究报告 |
 |
字数:3.7万 |
页数:138 |
图表数:173 |
|
中文电子版:8500元 |
中文纸版:4250元 |
中文(电子+纸)版:9000元 |
|
英文电子版:2500美元 |
英文纸版:2700美元 |
英文(电子+纸)版:2800美元 |
|
编号:HK051
|
发布日期:2014-10 |
附件:下载 |
 |
|
|
环氧乙烷(EO)是乙烯工业衍生物中仅次于聚乙烯和聚氯乙烯的重要有机化工原料。2013年,全球环氧乙烷产能主要分布于亚太、中东和北美地区,其中亚太地区产能占比达38%左右。
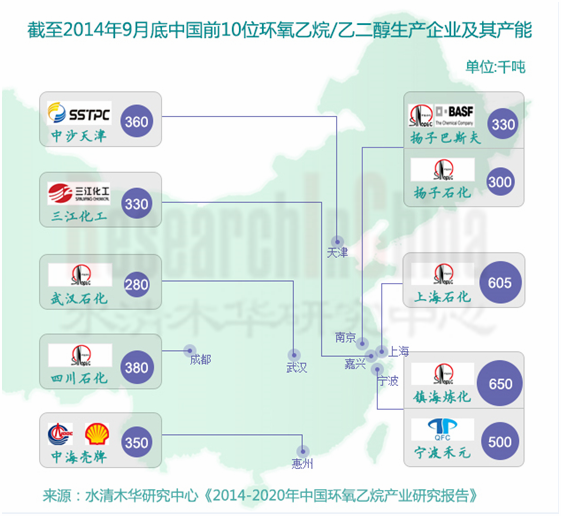
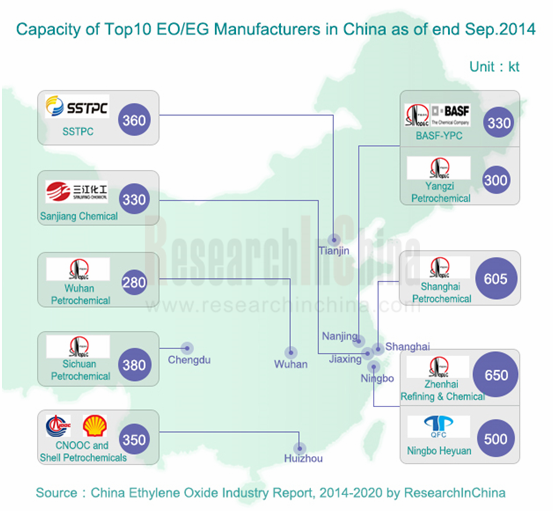
中国是全球环氧乙烷主要产区之一,截至2014年9月底环氧乙烷总产能达542.8万吨,占全球总产能的18%左右。
由于环氧乙烷产能的快速增长,2013-2014年中国环氧乙烷行业出现产能过剩的局面,行业开工率降至80%以下,生产企业利润空间大幅下降。2014-2020年,中国环氧乙烷拟/在建产能仍达200万吨以上,供过于求的局面仍将延续。
截至2014年9月底,中国环氧乙烷生产企业主要为中石化和中石油下属子公司及合资企业,其环氧乙烷产能占比高达67.9%。此外,民营企业如宁波禾元和三江化工也占据了一定市场份额。
中国环氧乙烷主要用于联产乙二醇,2013年该领域占环氧乙烷消费量的68.1%。而商品环氧乙烷主要用于生产非离子表面活性剂、聚羧酸减水剂、乙醇胺、晶硅切割液、牛磺酸等领域。其中聚羧酸减水剂市场增长最快,2013年其对环氧乙烷的需求量占比为8.4%。
1、 乙二醇
截至2014年9月底,中国乙二醇总产能达598.5万吨,其中煤制乙二醇产能占比达29.2%。目前,中国煤制乙二醇成本优势明显,随着生产工艺的日益成熟必将逐步占据石油法乙二醇的市场,进而降低乙二醇对环氧乙烷的需求。
2014年,中国拟/在建乙二醇产能达600万吨左右,其中煤制乙二醇产能约占80%。其中将于2015年投产的煤制乙二醇项目包括亿利资源30万吨产能、黔希化工30万吨产能、开滦集团40万吨产能等。
2、 聚羧酸减水剂
聚羧酸减水剂是环氧乙烷的间接下游,主要用于铁路、轨道交通、核电站、商品混凝土等领域,未来几年有望保持15%左右的增长速度。2013年,中国聚羧酸减水剂产量达360万吨,市场占有率排名前三的企业分别为江苏博特、建研集团和天津飞龙。
聚醚单体是合成聚羧酸减水剂的主要原料,主要企业包括奥克股份、科隆精化等。其中奥克股份是中国最大的聚醚单体生产商,2013年其聚醚单体销量为17.81万吨,市场占有率达40%左右。
水清木华研究中心《2014-2020年中国环氧乙烷产业研究报告》主要包括以下几个内容:
u 全球环氧乙烷行业供需分析、竞争格局等;
u 中国环氧乙烷供需分析、进出口、竞争格局、价格走势、2014-2020年发展预测等;
u 中国环氧乙烷上游乙烯和乙醇行业的供需分析、竞争格局、进出口、价格走势等;
u 中国环氧乙烷下游乙二醇、表面活性剂、乙醇胺、聚羧酸减水剂、晶硅切割液及牛磺酸行业的供需分析、进出口、竞争格局、价格走势、2014-2020年发展预测等;
u 中国15家环氧乙烷及下游产品生产企业的经营情况、环氧乙烷相关业务分析、预测与展望等。
Among ethylene derivatives, EO is an important organic chemical raw material, only second to polyethylene and polyvinyl chloride. In 2013, the global EO capacity was mainly distributed in Asia-Pacific, the Middle East and North America, wherein Asia-Pacific contributed 38% to the total capacity.
As one of main EO producing areas, China’s total EO capacity had reached 5.428 million tons by the end of September 2014, accounting for about 18% of the global total.
Due to the rapid growth of EO capacity, China EO industry is confronted with overcapacity in 2013-2014; meanwhile, the operating rate of the industry falls to below 80%, and the profit dives. In 2014-2020, China’s proposed and ongoing EO capacity will hit over 2 million tons, continuing the oversupply.
As of the end of September 2014, Chinese EO producers had mainly included Sinopec and PetroChina and their subsidiaries and joint ventures, occupying up to 67.9% of the EO capacity. In addition, private companies such as Ningbo Heyuan and Sanjiang Fine Chemicals also seize a certain market share.
In China, EO is mainly used for the production of glycol, which consumed 68.1% of EO in 2013. Commodity EO is often applied to the production of nonionic surfactant, polycarboxylate water reducer, ethanolamine, crystalline silicon cutting fluid, taurine and others. Particularly, the polycarboxylate water reducer market witnesses the fastest growth, sharing 8.4% of the EO demand in 2013.
1, Glycol
As of the end of September 2014, China’s total glycol capacity had amounted to 5.985 million tons, of which the coal-based glycol capacity accounted for 29.2%. Currently, China has apparent cost advantages in coal-based glycol; with the maturity of the production process, coal-based glycol will gradually replace oil-based glycol, thereby the demand of glycol for EO will shrink.
In 2014, China’s proposed and ongoing glycolcapacity hits about 6 million tons, of which the coal-based glycol capacity occupies 80% or so. The coal-based glycol projects to be put into operation in 2015 embrace Elion’s 300,000-ton project, Qianxi Coal Chemical’s 300,000-ton project, Kailuan Group’s 400,000-ton project and so on.
2, Polycarboxylate Water Reducer
As the indirect downstream of EO, polycarboxylate water reducer is mainly used in the fields of railway, rail transit, nuclear power plants, ready-mixed concrete, etc., with the expected growth rate of around 15% in the coming years. In 2013, China’s polycarboxylate water reducer output attained 3.6 million tons; by market share, Jiangsu Sobute, Xiamen Academy of Building Research Group and Tianjin Feilong ranked among the top three companies.
Polyether monomer is a main raw material of polycarboxylate water reducer. Major polyether monomer companies include Liaoning Oxiranchem and Kelong Fine Chemical. China's largest polyether monomer manufacturer -- Liaoning Oxiranchem sold 178,100 tons of polyether monomer and enjoyed around 40% market share in 2013.
The report covers the following:
 Supply& demand and competitive landscape of the global EO industry; Supply& demand and competitive landscape of the global EO industry;
China’s EO supply& demand, import& export, competition pattern, price, and development forecast for 2014-2020;
Supply& demand , competition pattern, import& export, price and the like of China’s EO upstream industry (ethylene and ethanol);
Supply& demand, competition pattern, import& export, development in 2014-2020, etc of China’s EO downstream industry (glycol , surfactant , ethanolamine, polycarboxylate water reducer, crystalline silicon cutting fluid and taurine);
Operation, EO-related business, anticipation and outlook of 15 Chinese EO and downstream enterprises.
第一章环氧乙烷概述
1.1定义
1.2生产技术
1.3产业链
第二章中国环氧乙烷行业发展概述
2.1 全球市场概况
2.1.1 供给分析
2.1.2 需求分析
2.2 中国市场供需
2.2.1 供给分析
2.2.2 需求分析
2.3 进出口
2.4 中国企业竞争格局
2.5 价格分析
第三章环氧乙烷上游产业分析
3.1 乙烯
3.1.1 供给
3.1.2 需求
3.1.3 进出口
3.1.4 价格分析
3.2 乙醇
3.2.1 供需分析
3.2.3 进出口
3.2.4 价格分析
第四章环氧乙烷下游深加工分析
4.1 乙二醇
4.1.1 供给分析
4.1.2 需求分析
4.1.3 进出口
4.1.4 竞争格局
4.1.5 价格分析
4.2 非离子表面活性剂
4.2.1 供给分析
4.2.2 需求分析
4.2.3 进出口
4.3 聚醚单体及聚羧酸减水剂
4.3.1 供给分析
4.3.2 需求分析
4.3.3 竞争格局
4.3.4 价格分析
4.3.5 发展前景
4.4 多晶硅切割液
4.4.1 供需分析
4.4.2 竞争格局
4.5 乙醇胺
4.5.1 供给分析
4.5.2 需求分析
4.6 牛磺酸
4.6.1 供需分析
4.6.2 竞争格局
第五章环氧乙烷生产企业分析
5.1 镇海炼化
5.1.1 公司简介
5.1.2 经营情况
5.1.3 乙烯配套环氧乙烷项目
5.2 上海石化
5.2.1 公司简介
5.2.2 经营情况
5.2.3 营收构成
5.2.4 毛利率
5.2.5 客户和供应商
5.2.6 环氧乙烷业务
5.2.7 预测与展望
5.3 扬子石化
5.3.1 公司简介
5.3.2 环氧乙烷业务
5.4 中海壳牌
5.4.1 公司简介
5.4.2 环氧乙烷业务
5.5 吉林石化
5.5.1 公司简介
5.5.2 环氧乙烷业务
5.6 扬子巴斯夫
5.6.1 公司简介
5.6.2 经营情况
5.6.3 环氧乙烷业务
5.7 北化集团
5.7.1 公司简介
5.7.2 环氧乙烷业务
5.8三江化工
5.8.1 公司简介
5.8.2 经营情况
5.8.3 营收构成
5.8.4 毛利率
5.8.5 环氧乙烷业务
5.8.6 预测与展望
第六章环氧乙烷深加工企业分析
6.1 辽宁华兴
6.1.1 公司简介
6.1.2 表面活性剂业务
6.2 沙索中国
6.2.1 公司简介
6.2.2 表面活性剂业务
6.3 奥克股份
6.3.1 公司简介
6.3.2 经营情况
6.3.3 营收构成
6.3.4 毛利率
6.3.5 研发
6.3.6 客户
6.3.7 环氧乙烷衍生物业务
6.3.8 预测与展望
6.4 科隆精化
6.4.1 公司简介
6.4.2 经营情况
6.4.3 营收构成
6.4.4 毛利率
6.4.5 研发
6.4.6 客户和供应商
6.4.7 环氧乙烷衍生物业务
6.5 江苏苏博特
6.5.1 公司简介
6.5.2 减水剂业务
6.6建研集团
6.6.1 公司简介
6.6.2 经营情况
6.6.3 营收构成
6.6.4 毛利率
6.6.5 研发
6.6.6 减水剂业务
6.6.7 预测与展望
6.7永安药业
6.7.1 公司简介
6.7.2 经营情况
6.7.3 营收构成
6.7.4 毛利率
6.7.5 研发
6.7.6 牛磺酸业务
6.7.7 预测与展望
第七章总结及预测
7.1 总结
7.2 预测
7.2.1 乙二醇
7.2.2 表面活性剂
7.2.3 聚羧酸减水剂
7.2.4 晶硅切割液
7.2.5 乙醇胺
7.2.6 牛磺酸
1 Overview of EO
1.1 Definition
1.2 Production Technology
1.3 Industry Chain
2 Development of China EO Industry
2.1 Overview of Global Market
2.1.1 Supply
2.1.2 Demand
2.2 China's Market Supply and Demand
2.2.1 Supply
2.2.2 Demand
2.3 Import and Export
2.4 Competition Pattern of Chinese Enterprises
2.5 Price
3 EO Upstream Industry
3.1 Ethylene
3.1.1 Supply
3.1.2 Demand
3.1.3 Import and Export
3.1.4 Price
3.2 Ethanol
3.2.1 Supply and Demand
3.2.3 Import and Export
3.2.4 Price
4 EO Downstream Deep-processing
4.1 Glycol
4.1.1 Supply
4.1.2 Demand
4.1.3 Import and Export
4.1.4 Competition Pattern
4.1.5 Price
4.2 Nonionic Surfactant
4.2.1 Supply
4.2.2 Demand
4.2.3 Import and Export
4.3 Polyether Monomer and Polycarboxylate Water Reducer
4.3.1 Supply
4.3.2 Demand
4.3.3 Competition Pattern
4.3.4 Price
4.3.5 Development Prospect
4.4 Polysilicon Cutting Fluid
4.4.1 Supply and Demand
4.4.2 Competition Pattern
4.5 Ethanolamine
4.5.1 Supply
4.5.2 Demand
4.6 Taurine
4.6.1 Supply and Demand
4.6.2 Competition Pattern
5 EO Manufacturers
5.1 Sinopec Zhenhai Refining & Chemical
5.1.1 Profile
5.1.2 Operation
5.1.3 Ethylene Supporting EO Projects
5.2 Sinopec Shanghai Petrochemical
5.2.1 Profile
5.2.2 Operation
5.2.3 Revenue Structure
5.2.4 Gross Margin
5.2.5 Clients and Suppliers
5.2.6 EO Business
5.2.7 Anticipation and Outlook
5.3 Sinopec Yangzi Petrochemical
5.3.1 Profile
5.3.2 EO Business
5.4 CNOOC and Shell Petrochemical (CSPC)
5.4.1 Profile
5.4.2 EO Business
5.5 Jilin Petrochemical
5.5.1 Profile
5.5.2 EO Business
5.6 BASF-YPC
5.6.1 Profile
5.6.2 Operation
5.6.3 EO Business
5.7 China North Chemical Industries Group
5.7.1 Profile
5.7.2 EO Business
5.8 China Sanjiang Fine Chemicals
5.8.1 Profile
5.8.2 Operation
5.8.3 Revenue Structure
5.8.4 Gross Margin
5.8.5 EO Business
5.8.6 Anticipation and Outlook
6 EO Deep-processing Enterprises
6.1 Liaoning Huaxing
6.1.1 Profile
6.1.2 Surfactant Business
6.2 Sasol (China)
6.2.1 Profile
6.2.2 Surfactant Business
6.3 Liaoning Oxiranchem
6.3.1 Profile
6.3.2 Operation
6.3.3 Revenue Structure
6.3.4 Gross Margin
6.3.5 R & D
6.3.6 Clients
6.3.7 EO Derivative Business
6.3.8 Anticipation and Outlook
6.4 Kelong Fine Chemical
6.4.1 Profile
6.4.2 Operation
6.4.3 Revenue Structure
6.4.4 Gross Margin
6.4.5 R & D
6.4.6 Clients and Suppliers
6.4.7 EO Derivative Business
6.5 Jiangsu Sobute
6.5.1 Profile
6.5.2 Water Reducer Business
6.6XiamenAcademy Of Building Research Group
6.6.1 Profile
6.6.2 Operation
6.6.3 Revenue Structure
6.6.4 Gross Margin
6.6.5 R & D
6.6.6 Water Reducer Business
6.6.7 Anticipation and Outlook
6.7Yongan Pharmaceutical
6.7.1 Profile
6.7.2 Operation
6.7.3 Revenue Structure
6.7.4 Gross Margin
6.7.5 R & D
6.7.6 Taurine Business
6.7.7 Anticipation and Outlook
7 Summary and Forecast
7.1 Summary
7.2 Forecast
7.2.1 Glycol
7.2.2 Surfactant
7.2.3 Polycarboxylate Water Reducer
7.2.4 Crystalline Silicon Cutting Fluid
7.2.5 Ethanolamine
7.2.6 Taurine
图:环氧乙烷产业链
图:2006-2014年全球环氧乙烷产能
图:2013年全球环氧乙烷(分地区)产能占比
图:2006-2014年全球环氧乙烷消费量
表:截至2014年9月底中国环氧乙烷和商品环氧乙烷(分企业/分地区)产能
表:2014年中国环氧乙烷拟/在建项目情况
图:2006-2014年中国环氧乙烷表观消费量
图:2013年中国环氧乙烷(分产品)消费结构
图:2009-2014年中国环氧乙烷进出口量
图:2009-2014年中国环氧乙烷进出口额
图:2013年中国环氧乙烷出口目的地分布(按出口量)
表:2008-2013年中国环氧乙烷下游产品净进口量
图:截至2014年9月底中国环氧乙烷(分企业)产能占比
图:截至2014年9月底中国环氧乙烷(分地区)产能占比
表:截至2014年9月底中国环氧乙烷及商品环氧乙烷前10名企业产能及占比
图:2007-2014年中国环氧乙烷(工业一级)市场平均价格
图:2013年中国乙烯(分企业)产能占比
表:2013年中国乙烯生产企业及其产能
图:2006-2013年中国乙烯产量及增长率
图:2013年中国乙烯(分地区)产量占比
图:2006-2013年中国乙烯表观消费量及增长率
表:2009-2014年中国乙烯进出口量
表:2009-2014年中国乙烯进口平均价格
表:2013年中国乙烯进口来源分布(按进口量)
表:2013年中国乙烯出口目的地分布(按出口量)
图:2009-2014年东北亚乙烯价格走势
表:2013年中国乙醇生产企业地区分布
图:2013年中国乙醇(分产品)需求占比
图:2009-2014年中国乙醇进出口量
图:2009-2014年中国乙醇进出口平均价格
图:2013年中国乙醇进口来源分布(按进口量)
图:2013年中国乙醇出口目的地分布(按出口量)
图:2006-2014年中国乙醇(工业级)市场平均价格
表:截至2014年9月底中国乙二醇生产企业及其产能
表:2014年中国乙二醇拟/在建项目情况
图:2006-2014年中国乙二醇产能及增长率
图:2006-2014年中国乙二醇产量及开工率
图:2006-2014年中国乙二醇表观消费量及增长率
图:2013年中国乙二醇(分用途)消费量占比
图:2009-2014年中国乙二醇进出口量
图:2009-2014年中国乙二醇进出口平均价格
图:2013年中国乙二醇进口来源分布(按进口量)
图:2013年中国乙二醇出口目的地分布(按出口量)
图:截至2014年9月底中国乙二醇行业竞争格局
图:截至2014年9月底中国乙二醇主要生产企业及其产能占比
图:2006-2014年中国乙二醇(涤纶级)市场平均价格
图:2006-2014年中国表面活性剂产量及同比增长
图:2006-2014年中国非离子表面活性剂产量及增长率
图:2006-2014年中国非离子表面活性剂表观消费量及同比增长
图:2009-2014年中国非离子表面活性剂进出口量
图:2009-2014年中国非离子表面活性剂进出口单价
图:2013年中国非离子表面活性剂进口来源分布(按进口量)
图:2013年中国非离子表面活性剂出口目的地分布(按出口量)
图:2006-2014年中国聚羧酸减水剂产量及增长率
图:2013年中国减水剂用聚醚单体(分产品)市场份额
图:2007-2014年中国聚羧酸减水剂消费量
表:2011-2013年中国聚醚单体主要生产企业及其产量
表:2013年中国前10名聚羧酸减水剂生产企业产能、销量和市场占有率
图:2009-2014年中国聚醚单体(分产品)市场价格
图:晶硅切割液在光伏产业链中的位置
图:2006-2013年中国太阳能光伏装机容量
图:2006-2013年中国晶硅切割液理论需求量
表:2013年中国乙醇胺主要企业及其产能
表:2006-2013年中国乙醇胺产量、进出口量和自给率
图:2006-2013年中国乙醇胺表观消费量及增长率
表:2007-2013年全球及中国牛磺酸产量
图:2013年牛磺酸下游应用领域及其消费量占比
图:2013年全球牛磺酸主要生产国产量占比
表:2013年中国主要牛磺酸生产企业及及其产能
表:截至2014年9月底镇海炼化(分产品)产能
表:镇海炼化100万吨/年乙烯工程配套装置及产能
表:截至2014年9月底上海石化主要产品产能
图:2009-2014年上海石化营业收入和净利润
表:2013年上海石化主营产品产量及增长率
表:2012-2014年上海石化(分产品)营业收入
图:2012-2014年上海石化(分产品)营业收入占比
表:2012-2014年上海石化(分地区)营业收入
表:2012-2014年上海石化(分地区)营业收入占比
表:2012-2014年上海石化主营产品毛利率
图:2012-2014年上海石化前五名客户贡献收入及占比
表:2014上半年上海石化前五名客户名称、收入贡献及占比
图:2010-2013年上海石化中间石化产品部门销售净额和营业利润
图:2009-2014年上海石化中间石化产品部门销量
图:2013-2017年上海石化营业收入及净利润预测
表:截至2014年9月底杨子石化(分产品)产能
表:截至2014年9月底中海壳牌公司主要产品产能
图:2007-2011年扬巴公司销售收入
图:2009-2014年三江化工营业收入和净利润
表:2012-2014年三江化工(分产品)营业收入
图:2012-2014年三江化工(分产品)营业收入占比
图:2012-2014年三江化工主营产品毛利率
表:三江化工环氧乙烷业务发展历程
图:2010-2014年三江化工主营产品销量
图:2010-2014年三江化工主营产品销售价格
表:2008-2015年三江化工环氧乙烷产能及预测
图:2013-2017年三江化工营业收入及净利润预测
表:截至2014年9月底辽宁华兴主要产品产能
表:截至2014年9月底沙索(中国)(分产品)产能
图:2009-2014年奥克股份营业收入和净利润
表:2012-2014年奥克股份(分产品)营业收入
图:2012-2014年奥克股份(分产品)营业收入占比
表:2012-2014年奥克股份(分地区)营业收入
表:2012-2014年奥克股份(分地区)营业收入占比
图:2012-2014年奥克股份主营产品毛利率
表:2011-2013年奥克股份研发支出及其占营业收入的比例
图:2012-2014年奥克股份前五名客户贡献收入及占比
表:2013年奥克股份前五名客户名称、收入贡献及占比
图:奥克股份业务定位图
图:2011-2013年奥克股份晶硅切割液产销量
图:2011-2013年奥克股份聚醚单体产销量
表:截至2014年6月底奥克股份环氧乙烷深加工业务相关子公司介绍
表:2013年奥克股份环氧乙烷深加工业务相关子公司营业收入及净利润
表:截至2014年9月底奥克股份重大建设项目进展情况
表:截至2014年9月底奥克股份环氧乙烷衍生物产品产能
图:2013-2017年奥克股份营业收入及净利润预测
图:2009-2014年科隆精化营业收入和净利润
表:2012-2014年科隆精化(分产品)营业收入
图:2012-2014年科隆精化(分产品)营业收入占比
表:2012-2014年科隆精化(分地区)营业收入
图:2012-2014年科隆精化(分地区)营业收入占比
表:2012-2014年科隆精化主营产品毛利率
表:2012-2014年科隆精化研发支出及其占营业收入的比例
图:2012-2014上半年科隆精化前五名客户贡献收入及占比
表:2014上半年科隆精化前五名客户名称、收入贡献及占比
图:2012-2014年科隆精化前五名供应商采购额及占比
表:2014上半年科隆精化前五名供应商名称、采购金额及占比
表:2011-2014年科隆精化环氧乙烷衍生物产品产量、产能和产能利用率
图:2011-2014年科隆精化聚醚单体产销量
图:2011-2014年科隆精化晶硅切割液产销量
表:2011-2014年科隆精化聚羧酸减水剂产品产量、产能和产能利用率
图:2011-2014年科隆精化聚羧酸减水剂浓缩液产销量
图:2011-2014年科隆精化聚羧酸减水剂泵送剂产销量
表:2011-2014年科隆精化主营产品平均销售价格
表:2014年科隆精化募投项目
表:截至2014年9月底江苏苏博特(分产品)产能
表:江苏苏博特产品应用范例
图:2009-2014年建研集团营业收入和净利润
表:2012-2014年建研集团(分产品)营业收入
图:2012-2014年建研集团(分产品)营业收入占比
表:2012-2014年建研集团(分地区)营业收入
表:2012-2014年建研集团(分地区)营业收入占比
图:2012-2014年建研集团(分产品)毛利率
表:2011-2013年建研集团研发支出及其占营业收入的比例
图:2011-2013年建研集团外加剂业务收入及净利润
图:2009-2013年建研集团外加剂销量
表:2013年建研集团外加剂产品子公司及其营业收入、净利润
图:2013-2017年建研集团营业收入及净利润预测
图:2009-2014年永安药业营业收入和净利润
表:2012-2014年永安药业(分产品)营业收入
图:2012-2014年永安药业(分产品)营业收入占比
表:2012-2014年永安药业(分地区)营业收入
图:2012-2014年永安药业(分地区)营业收入占比
图:2012-2014年永安药业主营产品毛利率
图:2011-2013年永安药业研发支出及其占营业收入的比例
图:2009-2013年永安药业牛磺酸产销量
表:2009-2013年永安药业牛磺酸产品产能
图:2013-2017年永安药业营业收入及净利润预测
表:2013-2014年中国环氧乙烷及其衍生物行业生产企业及收入对比
图:2013-2020年中国环氧乙烷产能及开工率预测
图:2013-2020年中国环氧乙烷产量需求量预测
图:2013-2020年中国环氧乙烷消费结构预测
表:2013-2020年中国乙二醇供需预测
图:2013-2020年中国乙二醇对EO需求量预测
表:2013-2020年中国非离子表面活性剂供需预测
图:2013-2020年中国非离子表面活性剂对EO需求量预测
表:2013-2020年中国聚羧酸减水剂供需预测
图:2013-2020年中国聚羧酸减水剂对EO需求量预测
表:2013-2020年中国晶硅切割液供需预测
图:2013-2020年中国晶硅切割液对EO需求量预测
表:2013-2020年中国乙醇胺供需预测
图:2013-2020年中国乙醇胺对EO的需求量预测
表:2013-2020年中国牛磺酸供需预测
图:2013-2020年中国牛磺酸对EO需求量预测
EO Industry Chain
Global EO Capacity, 2006-2014
Global EO Capacity Structure by Region, 2013
Global EO Consumption, 2006-2014
Capacity of EO and Commodity EO by Enterprise/Region in China, as of End-Sep 2014
Proposed/Ongoing EO Projects in China, 2014
Apparent Consumption of EO in China, 2006-2014
EO Consumption Structure by Product in China, 2013
Import/Export Volume of Chinese EO, 2009-2014
Import/Export Value of Chinese EO, 2009-2014
Export Destinations of Chinese EO by Export Volume, 2013
Net Import Volume of Chinese EO Downstream Products, 2008-2013
EO Capacity Structure by Enterprise in China, as of End-Sep 2014
EO Capacity Structure by Region in China, as of End-Sep 2014
EO and Commodity EO Capacity (Structure) by Top 10 Enterprises in China, as of End-Sep 2014
Average Market Price of EO (Industrial First-Class) in China, 2007-2014
Ethylene Capacity Structure by Enterprise in China, 2013
Capacity of Ethylene Manufacturers in China, 2013
Output and Growth Rate of Ethylene in China, 2006-2013
Ethylene Output Structure by Region in China, 2013
Apparent Consumption and Growth Rate of Ethylene in China, 2006-2013
Import/ Export Volume of Chinese Ethylene, 2009-2014
Average Import Price of Chinese Ethylene, 2009-2014
Import Origins of Chinese Ethylene by Import Volume, 2013
Export Destinations of Chinese Ethylene by Export Volume, 2013
Ethylene Price Trend in North Asia, 2009-2014
Regional Distribution of Ethanol Manufacturers in China, 2013
Ethanol Demand Structure by Product in China, 2013
Import/Export Volume of Chinese Ethanol, 2009-2014
Average Import/Export Price of Chinese Ethanol, 2009-2014
Import Origins of Chinese Ethanol by Import Volume, 2013
Export Destinations of Chinese Ethanol by Export Volume, 2013
Average Market Price of Ethanol (Industrial Grade) in China, 2006-2014
Capacity of Glycol Manufacturers in China, as of End-Sep 2014
Proposed/Ongoing Glycol Projects in China, 2014
Capacity and Growth Rate of Glycol in China, 2006-2014
Output and Operating Rate of Glycol in China, 2006-2014
Apparent Consumption and Growth Rate of Glycol in China, 2006-2014
Glycol Consumption Structure by Application in China, 2013
Import/Export Volume of Chinese Glycol, 2009-2014
Average Import/Export Price of Chinese Glycol, 2009-2014
Import Origins of Chinese Glycol by Import Volume, 2013
Export Destinations of Chinese Glycol by Export Volume, 2013
Competition Pattern of Glycol Industry in China, as of End-Sep 2014
Glycol Capacity Structure by Major Enterprises in China, as of End-Sep 2014
Average Market Price of Glycol (Polyester Grade) in China, 2006-2014
Output and YoY Growth of Surfactant in China, 2006-2014
Output and Growth Rate of Nonionic Surfactant in China, 2006-2014
Apparent Consumption and YoY Growth of Nonionic Surfactant in China, 2006-2014
Import/Export Volume of Chinese Nonionic Surfactant, 2009-2014
Import/Export Unit Price of Chinese Nonionic Surfactant, 2009-2014
Import Origins of Chinese Nonionic Surfactant by Import Volume, 2013
Export Destinations of Chinese Nonionic Surfactant by Export Volume, 2013
Output and Growth Rate of Polycarboxylate Water Reducer in China, 2006-2014
Market Share of Water Reducer Polyether Monomer by Product in China, 2013
Consumption of Polycarboxylate Water Reducer in China, 2007-2014
Output of Major Polyether Monomer Manufacturers in China, 2011-2013
Capacity, Sales Volume and Market Share of Top 10 Polycarboxylate Water Reducer Manufacturers in China, 2013
Market Price of Polyether Monomer by Product in China, 2009-2014
Position of Crystalline Silicon Cutting Fluid in PV Industry Chain
Installed Capacity of Solar PV in China, 2006-2013
Theoretical Demand for Crystalline Silicon Cutting Fluid in China, 2006-2013
Capacity of Major Ethanolamine Manufacturers in China, 2013
Output, Import/Export Volume and Self-sufficiency Rate of Ethanolamine in China, 2006-2013
Apparent Consumption and Growth Rate of Ethanolamine in China, 2006-2013
Global and China’s Taurine Output, 2007-2013
Taurine Consumption Structure by Application, 2013
Global Taurine Output Structure by Major Producers, 2013
Capacity of Major Taurine Manufacturers in China, 2013
Capacity of Sinopec Zhenhai Refining & Chemical Company by Product, as of End-Sep 2014
1 Mt/a Ethylene Project Supporting Device and Capacity of Sinopec Zhenhai Refining & Chemical Company
Capacity of Main Products of Sinopec Shanghai Petrochemical, as of End-Sep 2014
Revenue and Net Income of Sinopec Shanghai Petrochemical, 2009-2014
Output and Growth Rate of Main Products of Sinopec Shanghai Petrochemical, 2013
Revenue Breakdown of Sinopec Shanghai Petrochemical by Product, 2012-2014
Revenue Structure of Sinopec Shanghai Petrochemical by Product, 2012-2014
Revenue Breakdown of Sinopec Shanghai Petrochemical by Region, 2012-2014
Revenue Structure of Sinopec Shanghai Petrochemical by Region, 2012-2014
Gross Margin of Main Products of Sinopec Shanghai Petrochemical, 2012-2014
Sinopec Shanghai Petrochemical’s Revenue from Top 5 Clients and % of Total Revenue, 2012-2014
Name List and Revenue Contribution of Sinopec Shanghai Petrochemical’s Top 5 Clients, H1 2014
Net Sales and Operating Income of Intermediate Petrochemical Division of Sinopec Shanghai Petrochemical, 2010-2013
Sales Volume of Intermediate Petrochemical Division of Sinopec Shanghai Petrochemical, 2009-2014
Revenue and Net Income of Sinopec Shanghai Petrochemical, 2013-2017E
Capacity of Sinopec Yangzi Petrochemical by Product, as of End-Sep 2014
Capacity of Main Products of CNOOC and Shell Petrochemicals, as of End-Sep 2014
Sales of BASF-YPC, 2007-2011
Revenue and Net Income of China Sanjiang Fine Chemicals, 2009-2014
Revenue of China Sanjiang Fine Chemicals (by Product), 2012-2014
Revenue Structure of China Sanjiang Fine Chemicals (by Product), 2012-2014
Gross Margin of Main Products of China Sanjiang Fine Chemicals, 2012-2014
EO Business Development Course of China Sanjiang Fine Chemicals
Sales Volume of Main Products of China Sanjiang Fine Chemicals, 2010-2014
Selling Price of Main Products of China Sanjiang Fine Chemicals, 2010-2014
EO Capacity of China Sanjiang Fine Chemicals, 2008-2015E
Revenue and Net Income of China Sanjiang Fine Chemicals, 2013-2017E
Capacity of Main Products of Liaoning Huaxing, by the end of September 2014
Capacity of Sasol (China) (by Product), by the end of September 2014
Revenue and Net Income of Liaoning Oxiranchem, 2009-2014
Revenue of Liaoning Oxiranchem (by Product), 2012-2014
Revenue Structure of Liaoning Oxiranchem (by Product), 2012-2014
Revenue of Liaoning Oxiranchem (by Region), 2012-2014
Revenue Structure of Liaoning Oxiranchem (by Region), 2012-2014
Gross Margin of Main Products of Liaoning Oxiranchem, 2012-2014
R & D Costs and % of Total Revenue of Liaoning Oxiranchem, 2011-2013
Revenue of Liaoning Oxiranchem from Top 5 Clients and % of Total Revenue, 2012-2014
Name List and Revenue Contribution of Top 5 Clients of Liaoning Oxiranchem, 2013
Business Positioning of Liaoning Oxiranchem
Output and Sales Volume of Liaoning Oxiranchem’s Crystalline Silicon Cutting Fluid, 2011-2013
Polyether Monomer Output and Sales Volume of Liaoning Oxiranchem, 2011-2013
EO Deep Processing Subsidiaries of Liaoning Oxiranchem, by the end of June 2014
Revenue and Net Income of EO Deep Processing Subsidiaries of Liaoning Oxiranchem, 2013
Progress of Major Construction Projects of Liaoning Oxiranchem, by the end of September 2014
EO Derivative Capacity of Liaoning Oxiranchem, by the end of September 2014
Revenue and Net Income of Liaoning Oxiranchem, 2013-2017E
Revenue and Net Income of Kelong Fine Chemical, 2009-2014
Revenue Breakdown of Kelong Fine Chemical (by Product), 2012-2014
Revenue Structure of Kelong Fine Chemical (by Product), 2012-2014
RevenueBreakdown of Kelong Fine Chemical (by Region), 2012-2014
Revenue Structure of Kelong Fine Chemical (by Region), 2012-2014
Gross Margin of Main Products of Kelong Fine Chemical, 2012-2014
R & D Costs and % of Total Revenue of Kelong Fine Chemical, 2012-2014
Revenue of Kelong Fine Chemical from Top 5 Clients and % of Total Revenue, 2012-H1 2014
Name List and Revenue Contribution of Top 5 Clients of Kelong Fine Chemical, H1 2014
Procurement of Kelong Fine Chemical from Top 5 Suppliers and% of Total Procurement, 2012-2014
Name List and Procurement of Top 5 Suppliers of Kelong Fine Chemical, H1 2014
EO Derivative Output, Capacity and Capacity Utilization of Kelong Fine Chemical, 2011-2014
Polyether Monomer Output and Sales Volume of Kelong Fine Chemical, 2011-2014
Output and Sales Volume of Crystalline Silicon Cutting Fluid of Kelong Fine Chemical, 2011-2014
Output, Capacity and Capacity Utilization of Polycarboxylate Water Reducer of Kelong Fine Chemical, 2011-2014
Output and Sales Volume of Polycarboxylate Water Reducer Concentrated Liquid of Kelong Fine Chemical, 2011-2014
Output and Sales Volume of Polycarboxylate Water Reducer Pumping Agent of Kelong Fine Chemical, 2011-2014
Average Selling Price of Main Products of Kelong Fine Chemical, 2011-2014
Fundraising Projects of Kelong Fine Chemical, by the end of September 2014
Capacity of Jiangsu Sobute (by Product), by the end of September 2014
Product Applications of Jiangsu Sobute
Revenue and Net Income of XiamenAcademy of Building Research Group, 2009-2014
Revenue of XiamenAcademy of Building Research Group (by Product), 2012-2014
Revenue Structure of XiamenAcademy of Building Research Group (by Product), 2012-2014
Revenue Breakdown of XiamenAcademy of Building Research Group (by Region), 2012-2014
Revenue Structure of XiamenAcademy of Building Research Group (by Region), 2012-2014
Gross Margin of XiamenAcademy of Building Research Group (by Product), 2012-2014
R & D Costs and % of Total Revenue of XiamenAcademy of Building Research Group, 2011-2013
Additive Revenue and Net Income of XiamenAcademy of Building Research Group, 2011-2013
Additive Sales Volume of XiamenAcademy of Building Research Group, 2009-2013
Additive Subsidiaries of XiamenAcademy of Building Research Group and Their Revenue and Net Income, 2013
Revenue and Net Income of XiamenAcademy of Building Research Group, 2013-2017E
Revenue and Net Income of Yongan Pharmaceutical, 2009-2014
Revenue Breakdown of Yongan Pharmaceutical (by Product), 2012-2014
Revenue Structure of Yongan Pharmaceutical (by Product), 2012-2014
Revenue Breakdown of Yongan Pharmaceutical (by Region), 2012-2014
Revenue Structure of Yongan Pharmaceutical (by Region), 2012-2014
Gross Margin of Main Products of Yongan Pharmaceutical, 2012-2014
R & D Costs and % of Total Revenue of Yongan Pharmaceutical, 2011-2013
Output and Sales Volume of Yongan Pharmaceutical Taurine, 2009-2013
Capacity of Taurine Products of Yongan Pharmaceutical, 2009-2013
Revenue and Net Income of Yongan Pharmaceutical, 2013-2017E
Chinese EO and Derivative Manufacturers and Their Revenue Comparison, 2013-2014
China’s EO Capacity and Operating Rate, 2013-2020E
China’s EO Output and Demand, 2013-2020E
China’s EO Consumption Structure, 2013-2020E
China’s Glycol Supply and Demand, 2013-2020E
Demand of Glycol for EO in China, 2013-2020E
China’s Nonionic Surfactant Supply and Demand, 2013-2020E
Demand of Nonionic Surfactant for EO in China, 2013-2020E
China’s Polycarboxylate Water Reducer Supply and Demand, 2013-2020E
Demand of Polycarboxylate Water Reducer for EO in China, 2013-2020E
China’s Supply and Demand of Crystalline Silicon Cutting Fluid, 2013-2020E
Demand of Crystalline Silicon Cutting Fluid for EO in China, 2013-2020E
China’s Ethanolamine Supply and Demand, 2013-2020E
Demand of Ethanolamine for EO in China, 2013-2020E
China’s Taurine Supply and Demand, 2013-2020E
Demand of Taurine for EO in China, 2013-2020E
如果这份报告不能满足您的要求,我们还可以为您定制报告,请 留言说明您的详细需求。
|