|
|
|
报告导航:研究报告—
制造业—能源矿产
|
|
2014-2016年全球及中国风电运维行业研究报告 |
 |
字数:2.3万 |
页数:87 |
图表数:97 |
|
中文电子版:7000元 |
中文纸版:3500元 |
中文(电子+纸)版:7500元 |
|
英文电子版:2100美元 |
英文纸版:2200美元 |
英文(电子+纸)版:2400美元 |
|
编号:LT026
|
发布日期:2014-11 |
附件:下载 |
 |
|
|
2008-2013年,全球风电运维服务市场规模逐年递增,2013年达到73.5亿美元。全球风电运维服务市场规模将在2016年达到98.4亿美元,其中中国将达到17.7亿美元,约占全球市场的18% 。
欧洲是全球最大,同时也是开展风电运维业务最早的市场,约占全球风电运维市场规模的50%以上。2013年,德国风电运维市场规模达12亿欧元,占欧洲整体市场的44%,其次为西班牙(28%)和英国(13%)。未来西欧风电运维市场的增长将主要由德国、英国及意大利的海上风电场支撑;东欧的新兴风电运维市场中,波兰将有较为显著地增长。
中国2009年开始大规模风电建设,风机设备大约从2012年开始大规模脱离质保期。2013年,中国出质保期外风机数量为6769台,预计2014全年将达到12182台。出质保期外风机数量的快速攀升极大地推动了中国风电运维市场的发展。2008-2013年,中国风电运维市场规模年均增速达到142%,预计2014年其市场规模可达14亿美元左右。
目前中国风电运维市场竞争者主要分为三种类型:风机制造商、风电开发运营商及第三方运维公司。
金风科技是中国风机制造领域龙头企业,2005年公司成立专业从事风电服务的子公司天源科创,2014年上半年公司风电运维业务实现营业收入2.4亿元。风电开发运营商方面,大型开发商通常成立专门的风机检修公司如中国风电子公司——协合运维。由于制造商的技术壁垒,中国市场中第三方运维公司规模较小,一般只在初期负责某个特定领域的维护如吉地安(其主要从事接地网工程施工)。
水清木华研究中心《2014-2016年全球及中国风电运维行业研究报告》着重研究了以下内容:
 全球风电运维行业市场规模、竞争格局、成本及发展前景分析等; 全球风电运维行业市场规模、竞争格局、成本及发展前景分析等;
中国风电运维行业发展概况、市场规模、竞争格局、成本及发展前景分析等;
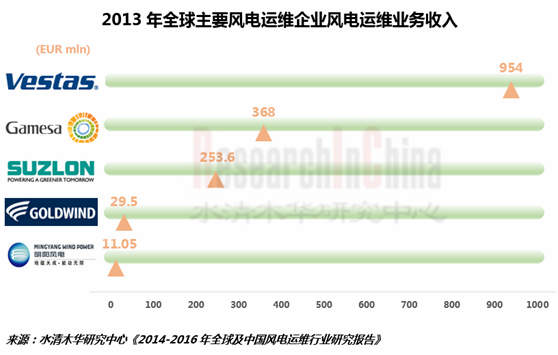
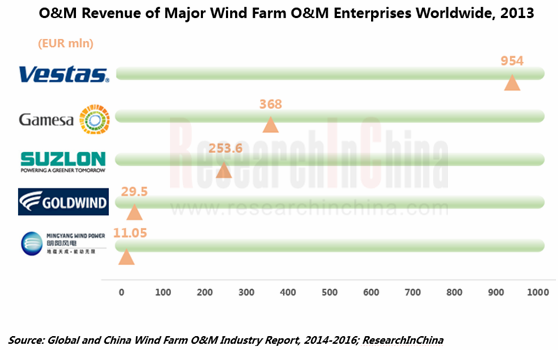
全球5家主要风电运维企业(包括维斯塔斯、歌美飒、苏司兰、GE及西门子)生产经营状况及风电运维业务分析等;
中国10家主要风电运维企业(包括金风科技、明阳风电、中国风电、龙源电力等)经营状况及风电运维业务分析等。
Global wind farm operations and maintenance (O&M) market size had increased progressively year after year during 2008-2013, attaining to USD 7.35 billion in 2013, and is predicted to reach USD 9.84 billion in 2016, with China contributing USD 1.77 billion, or 18% of global market.
Europe, as the world’s largest wind farm O&M market and the first to develop such business, takes up more than 50% of global wind farm O&M market. In 2013, German wind farm O&M market equalled to EUR 1.2 billion, or 44% of entire European market, followed by Spain (28%) and Britain (13%). The expansion of Western European wind farm O&M market will be propped up mainly by offshore wind farms in Germany, Britain and Italy; Poland will stand out from the emerging Eastern European wind farm O&M markets with significant growth.
As China started wind farm construction on a large scale from 2009, most of wind turbines have come out of warranty from about 2012. The number of wind turbines coming out of warranty stood at 6,769 in 2013, and is expected to total 12,182 in 2014. A surge in the number of wind turbines out of warranty period will greatly promote the development of the Chinese wind farm O&M market, which saw an annual average growth rate of 142%, and is expected to be worth about USD 1.4 billion in 2014.
At present, competitors in the Chinese wind farm O&M market can be divided into three main types: wind turbine manufacturers, wind farm developers and third party O&M companies.
Xinjiang Goldwind Science & Technology Co., Ltd, a leader in China’s wind turbine manufacturing, set up a subsidiary- Tianyuan New Energy Technology Co., Ltd. that specializes in wind power services in 2005, and achieved revenue of RMB 240 million from wind farm O&M business in the first half of 2014. With regard to wind power developer and operator, large developers usually establish overhaul companies, like Beijing Century Concord Operation and Maintenance Wind Power Technology Co., Ltd. under China WindPower Group Limited. Due to technical barriers put by manufacturers, third-party O&M companies are small in China, only being responsible for maintenance of specific fields in the early stage, like Shenyang Gideon Wind Power Science & Technology Co., Ltd, which engages mainly in grounding grid engineering construction.
Global and China Wind Farm O&M Industry Report, 2014-2016 by ResearchInChina focuses on the following:
Market size, competitive landscape, cost analysis and development prospect of global wind farm O&M industry;
Development, market size, competitive landscape, cost analysis and development prospect of China’s wind farm O&M industry;
Operation and wind farm O&M business of 5 major global wind farm O&M companies (including Vestas, Gamesa, Suzlon, GE and Siemens);
Operation and wind farm O&M business of 10 major Chinese wind farm O&M companies (covering Goldwind, Ming Yang Wind Power, China Wind Power, Longyuan Power).
第一章风电运维简介
1.1 定义
1.2 分类
第二章全球风电运维市场分析
2.1 全球风电市场
2.1.1 装机情况
2.1.2 德国
2.1.3 西班牙
2.1.4 美国
2.2 市场规模
2.3成本分析
2.4 欧洲风电运维市场
2.4.1 市场规模
2.4.2 竞争格局
第三章中国风电运维市场分析
3.1 中国风电市场
3.1.1 装机及并网情况
3.1.2 分散式风电
3.1.3 海上风电
3.1.4 上网电价
3.2 发展概况
3.3 市场规模
3.4 成本分析
3.5 竞争格局
第四章全球主要风电运维企业分析
4.1 维斯塔斯
4.1.1 企业简介
4.1.2 运营情况
4.1.3 营收构成
4.1.4 在华业务
4.1.5 风电运维业务
4.2 歌美飒
4.2.1 企业简介
4.2.2 运营情况
4.2.3 营收构成
4.2.4 在华业务
4.2.5 风电运维业务
4.3 苏司兰
4.3.1 企业简介
4.3.2 运营情况
4.3.3 营收构成
4.3.4 在华业务
4.3.5 风电运维业务
4.4 通用电气
4.4.1 企业简介
4.4.2 运营情况
4.4.3 营收构成
4.4.4 在华业务
4.4.5 风电运维业务
4.5 西门子
4.5.1 企业简介
4.5.2 运营情况
4.5.3 营收构成
4.5.4 在华业务
4.5.5 风电运维业务
第五章中国风电运维行业重点企业分析
5.1 龙源电力
5.1.1 企业简介
5.1.2 经营情况
5.1.3 营收构成
5.1.4 毛利率
5.1.5 风电运维业务
5.1.6 发展前景
5.2 金风科技
5.2.1 企业简介
5.2.2 经营情况
5.2.3 营收构成
5.2.4 毛利率
5.2.5 客户与供应商
5.2.6 风电运维业务
5.2.7 发展前景
5.3 明阳风电
5.3.1 企业简介
5.3.2 经营情况
5.3.3 营收构成
5.3.4 客户与供应商
5.3.5 风电运维业务
5.3.6 发展前景
5.4 中国风电
5.4.1 企业简介
5.4.2 运营情况
5.4.3 营收构成
5.4.4 客户与供应商
5.4.5 风电运维业务
5.4.6 发展前景
5.5 联合动力
5.5.1 企业简介
5.5.2 运营情况
5.5.3 风电运维业务
5.6 优利康达
5.6.1 企业简介
5.6.2 风电运维业务
5.7 金达坂
5.7.1 企业简介
5.7.2 风电运维业务
5.8 吉地安
5.8.1 企业简介
5.8.2 风电运维业务
5.9 锋电能源技术
5.9.1 企业简介
5.9.2 风电运维业务
5.10 EUM风电技术(北京)
第六章总结与预测
6.1 总结
6.2预测
1. Overview of Wind Farm O&M
1.1 Definition
1.2 Classification
2. Global Wind Farm O&M Market
2.1 Global Wind Power Market
2.1.1 Installed Capacity
2.1.2 Germany
2.1.3 Spain
2.1.4 USA
2.2 Market Size
2.3 Cost Analysis
2.4 European Wind Farm O&M Market
2.4.1 Market Size
2.4.2 Competitive Landscape
3. Chinese Wind Farm O&M Market
3.1 Chinese Wind Power Market
3.1.1 Installed Capacity and Grid Connection
3.1.2 Distributed Wind Power
3.1.3 Offshore Wind Power
3.1.4 Feed-In Tariff
3.2 Development
3.3 Market Size
3.4 Cost Analysis
3.5 Competitive Landscape
4. Major Global Wind Farm O&M Companies
4.1 Vestas
4.1.1 Profile
4.1.2 Operation
4.1.3 Revenue Structure
4.1.4 Business in China
4.1.5 Wind Farm O&M Business
4.2 Gamesa
4.2.1 Profile
4.2.2 Operation
4.2.3 Revenue Structure
4.2.4 Business in China
4.2.5 Wind Farm O&M Business
4.3 Suzlon
4.3.1 Profile
4.3.2 Operation
4.3.3 Revenue Structure
4.3.4 Business in China
4.3.5 Wind Farm O&M Business
4.4 GE
4.4.1 Profile
4.4.2 Operation
4.4.3 Revenue Structure
4.4.4 Business in China
4.4.5 Wind Farm O&M Business
4.5 Siemens
4.5.1 Profile
4.5.2 Operation
4.5.3 Revenue Structure
4.5.4 Business in China
4.5.5 Wind Farm O&M Business
5. Major Chinese Wind Farm O&M Companies
5.1 Longyuan Power
5.1.1 Profile
5.1.2 Operation
5.1.3 Revenue Structure
5.1.4 Gross Margin
5.1.5 Wind Farm O&M Business
5.1.6 Development Prospect
5.2 Goldwind
5.2.1 Profile
5.2.2 Operation
5.2.3 Revenue Structure
5.2.4 Gross Margin
5.2.5 Customersand Suppliers
5.2.6 Wind Farm O&M Business
5.2.7 Development Prospect
5.3 Ming Yang Wind Power
5.3.1 Profile
5.3.2 Operation
5.3.3 Revenue Structure
5.3.4 Customers and Suppliers
5.3.5 Wind Farm O&M Business
5.3.6 Development Prospect
5.4 China Wind Power
5.4.1 Profile
5.4.2 Operation
5.4.3 Revenue Structure
5.4.4 Customers and Suppliers
5.4.5 Wind Farm O&M Business
5.4.6 Development Prospect
5.5 United Power
5.5.1 Profile
5.5.2 Operation
5.5.3 Wind Farm O&M Business
5.6 EULIKIND
5.6.1 Profile
5.6.2 Wind Farm O&M Business
5.7 Xinjiang Jindaban Clean Energy
5.7.1 Profile
5.7.2 Wind Farm O&M Business
5.8 Gideon
5.8.1 Profile
5.8.2 Wind Farm O&M Business
5.9 Sharpower
5.9.1 Profile
5.9.2 Wind Farm O&M Business
5.10 EUM Wind Power Technologies Service (Beijing)
6. Summary and Forecast
6.1 Summary
6.2 Forecast
图:风电服务行业主要业务板块
图:2013年全球风电运维市场服务类型占比
图:2001-2013年全球风电新增装机容量
表:2011-2013年全球风电新增装机TOP10
图:1993-2013年德国新增及累计风电装机容量
表:2013年德国(分地区)风电装机容量
表:2014年德国在运行、在建及规划风电场
图:2005-2013年西班牙累计风电装机容量
表:2013年西班牙(分地区)新增装机容量
2005-2012年美国累计风电装机容量
图:2013年美国(分地区)风电累计装机容量
图:2008-2020年全球风电运维市场规模
图:图:2008-2015年全球风电运维服务收益及风机销售收益
图:风电运维成本增长趋势
图:风电服务成本构成
图:2005-2020年欧洲风电运维市场规模
图:2005-2020年欧洲(分国家)风电运维市场规模
图:2012-2020年欧洲(分国家)新增可运维风电装机容量
图:2011和2020年欧洲风电运维(分电厂类型)市场份额
图:2013年欧洲风电运维市场(分国家和服务商类型)市场份额
图:2007-2020年中国风电装机容量
表:2013年中国风电累计装机容量TOP20及市场份额
图:2006-2013年中国风电场闲置产能
图:2009-2013年中国风电并网装机容量
图:2007-2013年中国海上风电新增装机容量及累计装机容量
表:中国首批海上风电特许权项目
表:2013年中国海上风电机组安装情况
表:中国风力发电标杆上网电价
图:2011-2020年中国出质保期外风机数量
图:2008-2013年中国风电运维市场规模
图:2013年中国风电运维(分类型)市场规模占比
表:50MW风电场年度运营成本
图:中国陆地风力发电运营成本结构
图:中国海上风力发电运营成本结构
图:中国风电运维市场三类竞争者SOWT分析
图:2009-2014年维斯塔斯营业收入及净利润
图:2013年维斯塔斯(分业务)营收占比
图:2013年维斯塔斯(分地区)营收占比
图:2008-2013年维斯塔斯在华风机出货量
表:维斯塔斯在华分支机构
图:2009-2014年维斯塔斯风电运维服务订单储备量
图:2010-2014年维斯塔斯风电运维营业收入
图:2009-2014年歌美飒营业收入及净利润
图:2013年歌美飒(分业务)营收占比
图:2013年歌美飒(分地区)营收占比
图:2008-2013年歌美飒在华营业收入
图:2012-2013年歌美飒(分地区)风机销量占比
图:2010-2014年歌美飒风电运维业务营业收入
图:2011-2013年歌美飒风电运维业务订单总额
图:2009-2014财年苏司兰营业收入及净利润
图:2014财年苏司兰(分地区)营收构成
图:2009-2013财年苏司兰风电运维业务营业收入
图:2009-2014年通用电气营业收入及净利润
图:2009-2014年通用电气(分业务)营收占比
图:2011-2013年通用电气(分地区)营收构成
图:通用电气灵活风电服务解决方案
图:2009-2014年西门子营业收入及净利润
图:2009-2014年西门子中国营业收入
图:2011-2014年西门子风能部门营业收入
图:2011-2014年西门子风能部门在手订单额
图:西门子风电服务系统
图:2009-2014年龙源电力营业收入与净利润
图:2013 年龙源电力(分业务)营收占比
图:2009-2014年龙源电力毛利率
图:龙源电力六大风电基地
图:2011-2016年龙源电力营业收入及净利润
图:2009-2014年金风科技营业收入与净利润
图:2011-2014年金风科技风机(分类型)销量
图:2014年上半年金风科技(分产品)营收占比
图:2010-2013年金风科技(分产品)毛利率
图:2008-2013年金风科技前五名供应商合计采购金额及占比
图:2008-2013年金风科技前五名客户合计营业收入及占比
图:2010-2014年金风科技风电服务营业收入
图:2010-2013年天源科创营业收入及净利润
图:2013-2016年金风科技营业收入与净利润
图:2009-2014年明阳风电营业收入与净利润
图:2008-2013年明阳风电风机出货量
图:2008-2013年明阳风电(分业务)营收占比
图:2012-2013年明阳风电(分地区)营收构成
图:2009-2013年明阳风电前五名供应商合计采购金额占比
图:2008-2013年明阳风电前五名客户合计营业收入占比
图:明阳风电风电运维业务系统
图:2009-2013年明阳风电风电运维营业收入
图:2013-2016年明阳风电营业收入及净利润
图:2009-2014年中国风电营业收入及净利润
图:2014年上半年中国风电(分业务)营收占比
图:2010-2013年中国风电前五名供应商合计采购金额占比
图:2010-2013年中国风电前五名客户合计营业收入占比
图:2013-2016年中国风电营业收入及净利润
图:2012-2013年联合动力营业收入及净利润
图:2011-2013年联合动力风机出货量
图:联合动力风电场工程总包(EPC)建设流程
表:2006-2014年优利康达风电运维业务发展情况
表:2005-2010年金达坂风电运维业务发展情况
表:2006-2013年吉地安主要风电运维项目
图:2013-2020年中国风电运维市场规模
图:2020年全球陆上风电运维(分国家)市场规模占比
Major Business Sectors in Wind Power Service Industry
Structure of Global Wind Farm O&M Market by Type of Service, 2013
Global Newly-installed Wind Power Capacity, 2001-2013
Global Top10 Countries with Newly-installed Wind Power Capacity, 2011-2013
Newly-installed and Cumulative Wind Power Capacity in Germany, 1993-2013
Installed Wind Power Capacity in Germany (by Region), 2013
Wind Farms Being Operational, Under Construction and Planned in Germany, 2014
Cumulative Installed Wind Power Capacity in Spain, 2005-2013
Newly-installed Wind Power Capacity in Spain (by Region), 2013
Cumulative Installed Wind Power Capacity in USA, 2005-2012
Cumulative Installed Wind Power Capacity in USA (by Region), 2013
Global Wind Farm O&M Market Size, 2008-2020E
Global Wind Farm O&M Service Revenue and Wind Turbine Revenue, 2008-2015E
Cost Growth Trend of Wind Farm O&M
Cost Structure of Wind Power Service
European Wind Farm O&M Market Size, 2005-2020E
European Wind Farm O&M Market Size (by Country), 2005-2020E
Newly-added Installed Wind Power Capacity Coming into O&M in Europe (by Country), 2012-2020E
Share of European Wind Farm O&M Market (by Type of Farm), 2011&2020E
Share of European Wind Farm O&M Market (by Country and Type of Service Provider), 2013
Installed Wind Power Capacity in China, 2007-2020E
Top 20 Companies with Cumulative Installed Wind Power Capacity in China and Their Shares, 2013
Idle Wind Power Capacity in China’s Wind Farms, 2006-2013
Grid-connected Installed Wind Power Capacity in China, 2009-2013
Newly-installed and Cumulative Offshore Wind Capacity in China, 2007-2013
China’s First Franchise Offshore Wind Projects
Offshore Wind Turbine Installations in China, 2013
Benchmark Feed-In Tariff for Wind Power in China,
Number of Wind Turbines Out of Warranty, 2011-2020E
Chinese Wind Farm O&M Market Size, 2008-2013
Structure of Chinese Wind Farm O&M Market (by Type), 2013
Annual Operating Costs of A 50MW Wind Farm
Operating Costs Structure of Onshore Wind Power in China
Operating Costs Structure of Offshore Wind Power in China
SWOT Analysis of Three Types of Competitors in Chinese Wind Farm O&M Market
Revenue and Net Income of Vestas, 2009-2014
Revenue Structure of Vestas (by Business), 2013
Revenue Structure of Vestas (by Region), 2013
Wind Turbine Shipments of Vestas in China, 2008-2013
Branches of Vestas in China
Vestas’ Wind Farm O&M Order Backlog, 2009-2014
Vestas’ Revenue from Wind Farm O&M Business, 2010-2014
Revenue and Net Income of Gamesa, 2009-2014
Revenue Structure of Gamesa (by Business), 2013
Revenue Structure of Gamesa (by Region), 2013
Gamesa’s Revenue in China, 2008-2013
Wind Turbine Sales Volume Structure of Gamesa (by Region), 2012-2013
Gamesa’s Revenue from Wind Farm O&M Business, 2010-2014
Total Order of Gamesa’s Wind Farm O&M Business, 2011-2013
Revenue and Net Income of Suzlon, FY2009-FY2014
Revenue Structure of Suzlon (by Region), FY2014
Suzlon’s Revenue from Wind Farm O&M Business, FY2009-FY2013
Revenue and Net Income of GE, 2009-2014
Revenue Structure of GE (by Business), 2009-2014
Revenue Structure of GE (by Region), 2011-2013
GE’s Flexible Wind Power Service Solutions
Revenue and Net Income of Siemens, 2009-2014
Siemens’ Revenue in China, 2009-2014
Siemens’ Revenue from Wind Power Division, 2011-2014
Current Orders of Siemens’ Wind Power Division, 2011-2014
Siemens’ Wind Power Service System
Revenue and Net Income of Longyuan Power, 2009-2014
Revenue Structure of Longyuan Power (by Business), 2013
Gross Margin of Longyuan Power, 2009-2014
Six Wind Power Bases of Longyuan Power
Revenue and Net Income of Longyuan Power, 2011-2016E
Revenue and Net Income of Goldwind, 2009-2014
Wind Turbine Sales Volume of Goldwind (by Type), 2011-2014
Revenue Structure of Goldwind (by Product), 2014H1
Gross Margin of Goldwind (by Product), 2010-2013
Goldwind’s Procurement from Top 5 Suppliers and % of Total Procurement, 2008-2013
Goldwind’s Revenue from Top 5 Customers and % of Total Revenue, 2008-2013
Goldwind’s Revenue from Wind Power Service Business, 2010-2014
Revenue and Net Income of China Tianyuan New Energy Technology, 2010-2013
Revenue and Net Income of Goldwind, 2013-2016E
Revenue and Net Income of Ming Yang Wind Power, 2009-2014
Wind Turbine Shipments of Ming Yang Wind Power, 2008-2013
Revenue Structure of Ming Yang Wind Power (by Business), 2008-2013
Revenue Structure of Ming Yang Wind Power (by Region), 2012-2013
Ming Yang Wind Power’s Procurement from Top 5 Suppliers and % of Total Procurement, 2009-2013
Ming Yang Wind Power’s Revenue from Top 5 Customers and % of Total Revenue, 2008-2013
Ming Yang Wind Power’s Wind Farm O&M Business System
Ming Yang Wind Power’s Revenue from Wind Farm O&M Business, 2009-2013
Revenue and Net Income of Ming Yang Wind Power, 2013-2016E
Revenue and Net Income of China Wind Power, 2009-2014
Revenue Structure of China Wind Power (by Business), 2014H1
China Wind Power’s Procurement from Top 5 Suppliers and % of Total Procurement, 2010-2013
China Wind Power’s Revenue from Top 5 Customers and % of Total Revenue, 2010-2013
Revenue and Net Income of China Wind Power, 2013-2016E
Revenue and Net Income of United Power, 2012-2013
Wind Turbine Shipments of United Power, 2011-2013
Construction Procedures for Wind Farm EPC of United Power
Development of EULIKIND’s Wind Farm O&M Business, 2006-2014
Development of Xinjiang Jindaban Clean Energy’s Wind Farm O&M Business, 2005-2010
Major Wind Farm O&M Projects of Gideon, 2006-2013
Chinese Wind Farm O&M Market Size, 2013-2020E
Share of Global Onshore Wind Farm O&M Market Size (by Country), 2020E
如果这份报告不能满足您的要求,我们还可以为您定制报告,请 留言说明您的详细需求。
|