|
|
|
报告导航:研究报告—
制造业—化工
|
|
2014-2017年全球及中国白炭黑行业研究报告 |
 |
字数:4.2万 |
页数:136 |
图表数:151 |
|
中文电子版:8000元 |
中文纸版:4000元 |
中文(电子+纸)版:8500元 |
|
英文电子版:2400美元 |
英文纸版:2600美元 |
英文(电子+纸)版:2700美元 |
|
编号:LMX058
|
发布日期:2014-11 |
附件:下载 |
 |
|
|
中国是全球最大的白炭黑生产国,2013年,中国白炭黑产能220万吨,同比增长8.1%,增速有所放缓,约占全球总产能的60%。其中,沉淀法白炭黑产能207.9万吨,气相法白炭黑产能11.8万吨,分别同比增长7.44%和21.15%。
白炭黑产能的不断增长主要得益于下游需求尤其是绿色轮胎和硅橡胶需求的增长以及生产厂商扩建项目的陆续投产。
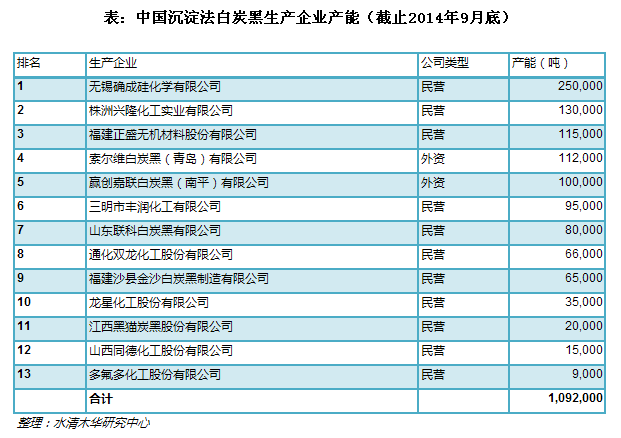
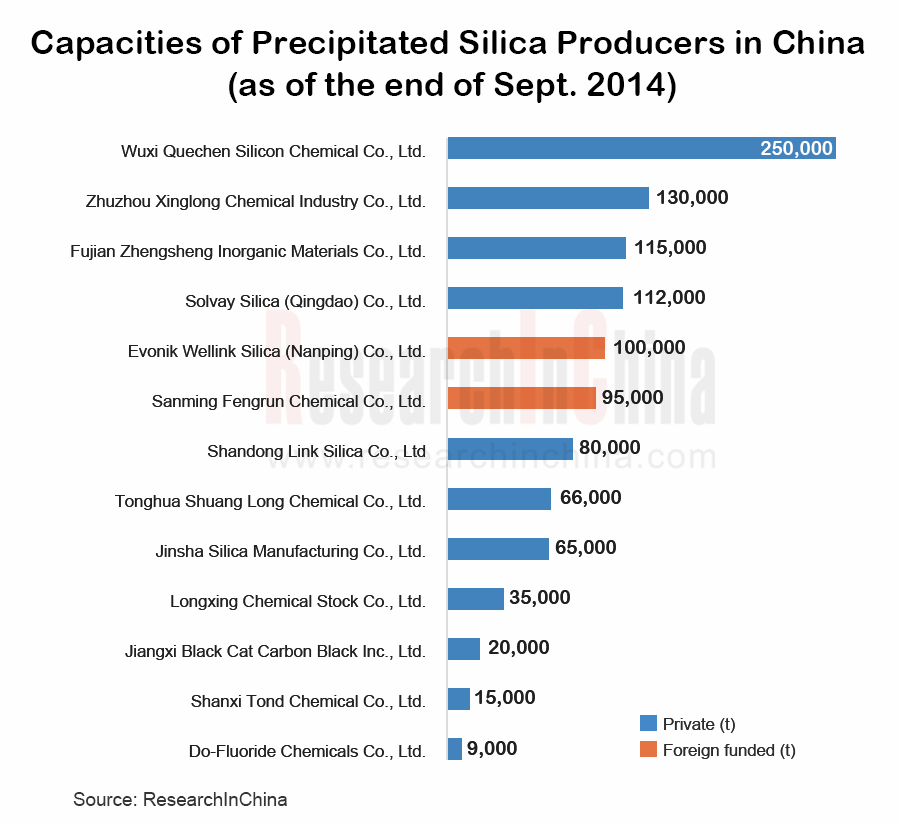
2013年3月,中国最大的沉淀法白炭黑生产商无锡确成硅化学有限公司无锡生产基地低聚高分散型白炭黑生产线竣工投产,单线产能为6万吨/年;2014年3月,安徽确成硅化学有限公司年产7万吨低聚高分散型二氧化硅生产线投产。截止2014年9月底,无锡确成硅沉淀法白炭黑产能达到25万吨/年。
除了国内民营企业扩产之外,外资企业也纷纷扩大在华白炭黑产能。2013年底,索尔维白炭黑青岛工厂将年产能从7.2万吨提升至11.2万吨。索尔维主要生产沉淀法白炭黑,产能为38万吨,在全球拥有8个白炭黑生产基地,其产能占全球产能的10%左右。
2014年7月,赢创工业宣布与江苏中能硅业科技发展有限公司在徐州建造硅化合物生产工厂,生产气相白炭黑和超纯四氯化硅,预计年产能超过2万吨,项目预计于2016年开始投入运营。赢创工业是全球最大的白炭黑生产商,产能55万吨,占全球产能的15%。2014年以来,公司宣布了一系列扩产规划,计划将其2014年产能在2010年的基础上提升30%。
从需求状况来看,中国近年来沉淀法白炭黑需求结构发生了一些变化,制鞋需求比例呈
现下滑趋势,而轮胎需求比例呈现上升趋势。主要是由于汽车工业的发展带动轮胎需求尤其是绿色轮胎需求的快速增长。2013年,中国白炭黑下游制鞋需求占比38%(2011年为40%),轮胎需求占比20%(2011年为18%)。
《2014-2017年全球及中国白炭黑行业研究报告》主要包含以下内容:
 全球白炭黑市场格局、供应及需求状况; 全球白炭黑市场格局、供应及需求状况;
中国白炭黑行业政策、生产结构、产能、产量、进出口及竞争格局分析;
中国白炭黑行业细分产品分析,分别对沉淀法白炭黑和气相法白炭黑的产能、产量、生
产结构、主要企业产能及主要项目进行分析;
中国白炭黑消费结构以及6大主要应用领域分析;
全球6家及中国19家重点沉淀法白炭黑和气相法白炭黑生产企业分析。
China, the world’s largest silica producer, had silica capacity of 2.20 million tons in 2013, slowing to a year-on-year increase of 8.1% and accounting for 60% of global capacity, of which 2.079 million tons were precipitated silica and 118,000 tons fumed silica, rising by 7.44% and 21.15% from a year earlier, respectively.
Ever-increasing silica capacity is attributed mainly to the increase in downstream demand, especially that of green tire and silicone rubber and the commissioning of expanded projects of producers.
In March, 2013, the LPS & HDS silica production lines in Wuxi production base of Quechen Silicon Chemical Co., Ltd., the largest precipitated silica producer in China, were completed and put into operation. The capacity of single production line is 60,000t/a. In March, 2013, the 70,000t/a LPS & HDS silica production lines of Anhui Quechen Silicon Chemical were formally put into production. As of the end of Sept. 2014, precipitated silica capacity of Wuxi Quechen totaled 250,000t/a.
While domestic private companies are expanding capacities, foreign ones are also expanding their silica capacities in China. At the end of 2013, Solvay Silica elevated the capacity of Qingdao Plant from 72,000 tons/a to 112,000 tons/a. Solvay mainly produces precipitated silica with a capacity of 380,000 tons, accounting for about 10% of global amount, and has 8 silica production bases around the globe.
In Jul. 2014, Evonik Industries announced that it would establish silicon compound plants with Jiangsu Zhongneng Polysilicon Technology Development Co. Ltd. for the production of fumed silica and ultra-pure silicon tetrachloride. The plants will have an annual capacity of over 20,000 tons, and are scheduled to start-up operation in 2016. Evonik Industries is the world’s largest silica producer with capacity of 550,000 tons, 15% of global total. Since the year 2014, the company has announced a series of plans for capacity expansion with the aim of raising its capacity in 2014 by 30% compared to 2010 levels.
From the perspective of demand, China’s demand structure for precipitated silica has undergone some changes in recent years, with proportion of shoe making industry declining and that of tire rising. The improvement in tire demand proportion is largely due to the development of automobile industry, which spurs fast growth in demand for silica from tire, particularly green tire. In 2013, the downstream shoemaking industry made up 38% of total demand for silica (40% in 2011), and tire 20% (18% in 2011).
Global and China Silica Industry Report, 2014-2017 covers the following:
Global silica market pattern, supply & demand;
Policies, production structure, capacity, output, import & export and competitive landscape of China silica industry;
Product segments in China silica industry, covering capacity, output and production structure of precipitated silica and fumed silica, capacities and key projects of major companies;
Consumption structure and 6 main applications of silica in China;
6 global and 19 Chinese major precipitated silica and fumed silica producers.
前言
第一章 白炭黑行业概述
1.1 定义及分类
1.2 应用领域
1.3 行业政策
第二章 全球白炭黑行业发展状况
2.1 市场格局
2.2 供应状况
2.3 需求状况
第三章 中国白炭黑行业发展状况
3.1 产能及产量
3.1.1 产品结构
3.1.2 生产数据
3.2 进出口
3.2.1 进口
3.2.2 出口
3.3 竞争格局
第四章 中国白炭黑行业细分产品分析
4.1 沉淀法白炭黑
4.1.1 产能及产量
4.1.2 生产结构
4.1.3 主要企业
4.1.4 主要项目
4.2 气相法白炭黑
4.2.1 产能及产量
4.2.2 生产结构
4.2.3 主要企业
4.2.4 主要项目
第五章 中国白炭黑行业下游应用领域分析
5.1 消费结构及消费量
5.2 鞋类
5.3 轮胎
5.3.1 轮胎产量
5.3.2 对白炭黑的需求
5.4 硅橡胶
5.5 农药和饲料
5.6 涂料
5.7 牙膏
第六章 全球主要白炭黑企业分析
6.1 比利时索尔维集团(SOLVAY)
6.1.1 公司简介
6.1.2 白炭黑业务
6.1.3 经营状况
6.1.4 Solvay breaks ground on new state-of-the-art silica plant in Poland
6.1.5 在华发展
6.2 德国赢创工业集团(EVONIC)
6.2.1 公司简介
6.2.2 白炭黑业务
6.2.3 经营状况
6.2.4 白炭黑在建项目
6.2.5 在华发展
6.3 美国PPG公司(PPG)
6.3.1 公司简介
6.3.2 白炭黑业务
6.3.3 经营状况
6.4 美国卡博特公司(Cabot)
6.4.1 公司简介
6.4.2 白炭黑业务
6.4.3 经营状况
6.4.4 卡博特蓝星化工(江西)有限公司
6.5 德国瓦克化学公司(Wacker)
6.5.1 公司简介
6.5.2 白炭黑业务
6.5.3 经营状况
6.5.4 瓦克化学(张家港)有限公司
6.6 日本德山株式会社(Tokuyama)
6.6.1 公司简介
6.6.2 白炭黑业务
6.6.3 经营状况
6.6.4 业绩预测
6.6.5 发展规划
6.6.6 德山化工(浙江)有限公司
第七章 中国主要白炭黑企业分析
沉淀法白炭黑生产企业
7.1 通化双龙化工股份有限公司
7.1.1 公司简介
7.1.2 白炭黑产销量
7.1.3 经营状况
7.1.4 营收构成
7.1.5 毛利率分析
7.1.6 研发与投资
7.1.7 竞争优势
7.1.8 客户与供应商
7.1.9 收购金宝药业
7.1.10 业绩预测
7.2 多氟多化工股份有限公司
7.2.1 公司简介
7.2.2 经营状况
7.2.3 营收构成
7.2.4 白炭黑业务
7.2.5 发展战略
7.2.6 业绩预测
7.3 山东海化股份有限公司
7.3.1 公司简介
7.3.2 经营状况
7.3.3 营收构成
7.3.4 白炭黑业务
7.3.5 业绩预测
7.4 龙星化工股份有限公司
7.4.1 公司简介
7.4.2 经营状况
7.4.3 营收构成
7.4.4 白炭黑业务
7.4.5 业绩预测
7.5 山西同德化工股份有限公司
7.5.1 公司简介
7.5.2 白炭黑产销量
7.5.3 经营状况
7.5.4 营收构成
7.5.5 毛利率分析
7.5.6 研发与投资
7.5.7 业绩预测
7.6 山东联科白炭黑有限公司
7.6.1 公司简介
7.6.2 白炭黑产销量
7.6.3 经营状况
7.6.4 营收构成
7.6.5 毛利率分析
7.6.6 客户及供应商
7.6.7 发展前景
7.7 株洲兴隆化工实业有限公司
7.8 无锡确成硅化学有限公司
7.8.1 公司简介
7.8.2 发展历程
7.8.3 白炭黑产品
7.8.4 竞争优势
7.8.5 “走出去”战略
7.9 福建正盛无机材料股份有限公司
7.9.1 公司简介
7.9.2 白炭黑产品
7.10 三明市丰润化工有限公司
7.10.1 公司简介
7.10.2 白炭黑产品
7.11 福建沙县金沙白炭黑制造有限公司
7.12 福建三明正元化工有限公司
气相法白炭黑生产企业
7.13 广州吉必盛科技实业有限公司
7.14 浙江富士特集团
7.15 赤峰盛森硅业科技发展有限公司
7.16 济宁青云化工有限公司
7.17 宜昌南玻硅材料有限公司
7.18 洛阳中硅高科技有限公司
7.19 江西黑猫炭黑股份有限公司
7.19.1 公司简介
7.19.2 经营状况
7.19.3 白炭黑业务
第八章 市场总结与发展预测
8.1 市场总结
8.2 发展预测
8.2.1 产量预测
8.2.2 需求预测
Preface
1. Overview of Silica Industry
1.1 Definition and Classification
1.2 Applications
1.3 Industry Policy
2. Development of Global Silica Industry
2.1 Market Pattern
2.2 Supply
2.3 Demand
3. Development of China Silica Industry
3.1 Capacity and Output
3.1.1 Production Structure
3.1.2 Production Figure
3.2 Import and Export
3.2.1 Import
3.2.2 Export
3.3 Competition
4. Segmented Markets of China Silica Industry
4.1 Precipitated Silica
4.1.1 Capacity and Output
4.1.2 Production Structure
4.1.3 Major Producers
4.1.4 Major Projects
4.2 Fumed Silica
4.2.1 Capacity and Output
4.2.2 Production Structure
4.2.3 Major Producers
4.2.4 Major Projects
5. Downstream Applications of China Silica Industry
5.1 Consumption
5.2 Footwear
5.3 Tire
5.3.1 Tire Output
5.3.2 Demand for Silica
5.4 Silicone Rubber
5.5 Pesticide & Feed
5.6 Coating
5.7 Toothpaste
6. Key Companies in the World
6.1 SOLVAY
6.1.1 Profile
6.1.2 Silica Business
6.1.3 Operation
6.1.4 Solvay Breaks Ground on New State-Of-The-Art Silica Plant in Poland
6.1.5 Development in China
6.2 EVONIC
6.2.1 Profile
6.2.2 Silica Business
6.2.3 Operation
6.2.4 Projects
6.2.5 Development in China
6.3 PPG
6.3.1 Profile
6.3.2 Silica Business
6.3.3 Operation
6.4 Cabot
6.4.1 Profile
6.4.2 Silica Business
6.4.3 Operation
6.4.4 Cabot Bluestar Chemical (Jiangxi) Company Limited
6.5 Wacker
6.5.1 Profile
6.5.2 Silica Business
6.5.3 Operation
6.5.4 Wacker Chemicals (Zhangjiagang) Co., Ltd.
6.6 Tokuyama
6.6.1 Profile
6.6.2 Silica Business
6.6.3 Operation
6.6.4 Performance Forecast
6.6.5 Development Plan
6.6.6 Tokuyama Chemicals (Zhejiang) Co., Ltd.
7. Key Companies in China
Precipitated Silica Producers
7.1 Tong Hua Shuang Long Chemical Co., Ltd.
7.1.1 Profile
7.1.2 Output and Sales Volume of Silica
7.1.3 Operation
7.1.4 Revenue Structure
7.1.5 Gross Margin
7.1.6 R & D and Investment
7.1.7 Competitive Advantages
7.1.8 Clients and Suppliers
7.1.9 Acquisition of Jilin Jinbao Pharmaceutical Co., Ltd.
7.1.10 Performance Forecast
7.2 Do-fluoride Chemicals Co., Ltd.
7.2.1 Profile
7.2.2 Operation
7.2.3 Revenue Structure
7.2.4 Silica Business
7.2.5 Strategy
7.2.6 Performance Forecast
7.3 Shandong Haihua Company Limited
7.3.1 Profile
7.3.2 Operation
7.3.3 Revenue Structure
7.3.4 Silica Business
7.3.5 Performance Forecast
7.4 Longxing Chemical Stock Co., Ltd.
7.4.1 Profile
7.4.2 Operation
7.4.3 Revenue Structure
7.4.4 Silica Business
7.4.5 Performance Forecast
7.5 Shanxi Tond Chemical Co., Ltd.
7.5.1 Profile
7.5.2 Output and Sales Volume of Silica
7.5.3 Operation
7.5.4 Revenue Structure
7.5.5 Gross Margin
7.5.6 R & D and Investment
7.5.7 Performance Forecast
7.6 Shandong Link Silica Co., Ltd.
7.6.1 Profile
7.6.2 Output and Sales Volume of Silica
7.6.3 Operation
7.6.4 Revenue Structure
7.6.5 Gross Margin
7.6.6 Clients and Suppliers
7.6.7 Development Outlook
7.7 Zhuzhou Xinglong Chemical Industrial Co., Ltd.
7.8 Wuxi QueChen Silicon Chemical Co., Ltd.
7.8.1 Profile
7.8.2 Development Course
7.8.3 Silica Products
7.8.4 Competitive Advantages
7.8.5 “Go Global” Strategy
7.9 Fujian Zhengsheng Inorganic Materials Co., Ltd.
7.9.1 Profile
7.9.2 Silica Products
7.10 Sanming City Fengrun Chemical Industry Co., Ltd.
7.10.1 Profile
7.10.2 Silica Products
7.11 Jinsha Silica Manufacturing Co., Ltd.
7.12 ZhengYuan Chemical Co., Ltd.
Fumed Silica Producers
7.13 Guangzhou GBS High-tech & Industry Co., Ltd.
7.14 Zhejiang Fushite Group
7.15 Chifeng Shengsen Silicon Technology Development Co., Ltd.
7.16 Jining Qingyun Chemical Co., Ltd.
7.17 Yichang CSC Polysilicon Co., Ltd.
7.18 China Silicon Corporation Ltd
7.19 Jiangxi Black Cat Carbon Black Co., ltd.
7.19.1 Profile
7.19.2 Operation
7.19.3 Silica Business
8. Market Review and Development Forecast
8.1 Market Review
8.2 Development Forecast
8.2.1 Output Forecast
8.2.2 Demand Forecast
图:白炭黑分类
表:白炭黑主要应用领域
表:2005-2014年中国白炭黑行业相关法规及政策
表:全球主要白炭黑生产厂家产品、工艺、产能及生产基地(截止2013年)
图:2013年全球白炭黑市场份额(按企业产能)
图:2013年全球白炭黑产能结构(按生产工艺)
表:2010-2014年全球主要白炭黑生产厂家产能扩建项目
图:全球沉淀白炭黑市场消费结构
表:2003-2018年美国白炭黑需求
图:2013年中国白炭黑市场产品结构(按产量)
图:2008-2013年中国白炭黑产能及产量
图:2001-2014年中国二氧化硅进口量
图:2001-2014年中国二氧化硅进口金额
图:2001-2014年中国二氧化硅出口量
图:2010-2014年中国二氧化硅出口金额
表:中国白炭黑市场分类
表:全球主要白炭黑生产厂家在华布局
图:2008-2013年中国沉淀法白炭黑产能及产量
图:2008-2012年中国沉淀法白炭黑企业数量
表:2012年中国沉淀法白炭黑生产能力和产量
表:2012年中国沉淀法白炭黑生产能力和产量(分企业性质)
表:2012年中国沉淀法白炭黑生产能力和产量(分区域)
表:中国沉淀法白炭黑生产企业产能(截止2014年9月底)
表:2013-2014年中国沉淀法白炭黑主要在建项目
图:2008-2013年中国气相法白炭黑产能及产量
表:2012年中国气相法白炭黑生产能力和产量(分企业性质)
表:中国气相法白炭黑生产企业产能(截止2014年9月底)
表:2013-2014年中国气相法白炭黑主要在建项目
图:2013年中国沉淀法白炭黑消费结构
图:2013年中国气相法白炭黑消费结构
图:2008-2013年中国白炭黑消费量
图:2000-2014年中国皮革鞋靴产量及同比增长
图:2010-2013年中国鞋类制品对白炭黑的需求量
图:2007-2014年中国橡胶轮胎外胎产量及同比增长
图:2007-2014年中国子午线轮胎外胎产量及同比增长
图:2010-2013年中国轮胎用白炭黑需求量
表:2010-2013年中国硅橡胶用白炭黑需求量
图:2007-2014年中国饲料产量及同比增长
图:2005-2014年中国化学农药原药产量及同比增长
图:2010-2013年中国农药和饲料行业对白炭黑的需求量
图:2003-2014年中国涂料产量及同比增长
图:2010-2013年中国涂料用白炭黑需求量
图:2010-2013年中国牙膏用白炭黑需求量
图:索尔维运营数据
图:索尔维全球业务分布
图:索尔维集团白炭黑业务全球分布
图:2013-2014年索尔维集团主要财务指标(分业务)构成
图:索尔维集团在华业务分布
表:索尔维集团在华发展里程碑
图:德国赢创工业集团介绍
表:德国赢创工业集团无机材料业务生产基地全球分布
图:2010-2013年德国赢创工业集团主要财务指标
图:2010-2013年德国赢创工业集团Resource Efficiency业务主要财务指标
图:2013-2014年德国赢创工业集团Resource Efficiency业务主要财务指标
表:PPG公司白炭黑全球生产基地分布
图:2013年PPG公司营业收入(分业务)构成
图:2012-2013年PPG公司营业收入与利润(分业务)构成
图:2013-2014年PPG工业营业收入与利润(分业务)构成
图:卡博特全球业务分布
图:2011-2014财年卡博特营业收入与净利润
图:2013财年卡博特营业收入(分业务)构成
图:2011-2014财年卡博特Performance Materials业务主要财务指标
图:瓦克化学业务部门
表:瓦克化学主要白炭黑生产基地全球分布
图:2008-2013年瓦克化学主要财务指标
图:2013年瓦克化学营业收入(分业务)构成
图:2007-2013年瓦克有机硅主要财务指标
图:2013-2014年瓦克化学主要财务指标
图:2013-2014年瓦克化学营业收入(分区域)构成
图:2013-2014年瓦克化学营业收入(分业务)构成
图:2013-2014年瓦克有机硅主要财务指标
图:瓦克化学中期目标
图:德山全球业务分布
图:德山白炭黑产品介绍
图:2009-2013财年德山主要财务指标
图:2013-2014财年德山主要财务指标
图:2013财年德山营业收入(分业务)构成
图:2014财年第一季度德山营业收入和利润(分业务)构成
图:2009-2014财年德山Specialty Products业务收入与利润
图:2014财年德山主要财务指标预测
图:德山中期发展规划
表:德山化工(浙江)有限公司介绍
表:德山化工(浙江)有限公司白炭黑产品应用领域及型号
表:双龙股份主要白炭黑产品及用途
图:2007-2013年双龙股份白炭黑产销量
图:2008-2014年双龙股份营业收入与净利润
表:2012-2014年双龙股份营业收入(分产品)
图:2008-2014年双龙股份营业收入(分区域)构成
图:2008-2014年双龙股份综合毛利率
表:2012-2014年双龙股份(分产品)毛利率
表:2014年上半年双龙股份主要研发项目
表:2008-2014年双龙股份研发费用及占营业收入的比例
表:2014上半年双龙化工前五名客户收入及其占比
表:2014上半年双龙化工对前五名供应商采购额及其占比
表:2014-2017年双龙股份营业收入与净利润预测
图:2008-2014年多氟多营业收入与净利润
表:2013-2014年多氟多营业收入(分业务)构成
图:2008-2014年多氟多营业收入(分区域)构成
图:多氟多白炭黑产品技术指标
表:多氟多主要产品产能
表:2014-2017年多氟多营业收入与净利润预测
图:2008-2014年海化股份营业收入与净利润
表:2013-2014年海化股份营业收入(分产品)构成
图:2014年上半年海化股份营业收入(分区域)构成
图:2010-2013年海化股份水玻璃、白炭黑业务收入及其占总营业收入的比重
表:2010-2013年山东海化股份有限公司白炭黑厂资产与负债
表:2010-2013年山东海化股份有限公司白炭黑厂产品产量
表:2014-2017年海化股份营业收入与净利润预测
图:2008-2014年龙星化工营业收入与净利润
图:2014年龙星化工营业收入(分产品)构成
图:2011-2014年龙星化工营业收入(分区域)构成
表:龙星化工白炭黑项目
图:龙星化工橡胶用白炭黑产品技术指标
表:2014年上半年龙星化工白炭黑业务财务数据
表:2014-2017年龙星化工营业收入与净利润预测
表:同德化工白炭黑产品型号及应用
表:2011-2013年同德化工白炭黑产量、销量及库存量
图:2008-2014年同德化工营业收入与净利润
图:2012-2013年同德化工营业成本(分业务)构成
图:2011-2014年同德化工营业收入(分业务)构成
图:2011-2014年同德化工白炭黑业务收入及同比增长
图:2011-2014年同德化工白炭黑业务营业收入(分区域)构成
图:2011-2014年同德化工毛利率(分产品)
表:2011-2014年同德化工研发费用及占营业收入的比例
表:同德化工主要白炭黑研发项目
表:2014-2017年同德化工营业收入与净利润预测
图:山东联科白炭黑有限公司白炭黑产品结构(按产量)(截止2014年3月末)
表:山东联科白炭黑有限公司白炭黑产品型号及其应用
表:2009-2014年山东联科白炭黑有限公司白炭黑产能、产量及销量
表:2009-2014年山东联科白炭黑公司主要营业指标
表:2009-2014年山东联科白炭黑有限公司销售收入(分产品)构成
表:2009-2014年山东联科白炭黑有限公司销售收入(分区域)构成
表:2009-2014年山东联科白炭黑有限公司毛利率
表:2013年山东联科白炭黑有限公司对前五名供应商采购额及占比
表:2013年山东联科白炭黑有限公司前五名客户收入及其占比
表:确成硅化学股份有限公司发展历程
表:确成硅化学股份有限公司白炭黑产品类型及型号
图:福建正盛无机材料股份有限公司销售网络
表:福建正盛无机材料股份有限公司白炭黑产品型号及应用
表:三明市丰润化工有限公司发展里程碑
表:三明市丰润化工有限公司白炭黑产品型号及应用
表:福建三明正元化工有限公司白炭黑产品型号及应用
表:广州吉必盛科技实业有限公司白炭黑产品类型及型号
图:浙江富士特集团白炭黑产品技术指标
表:宜昌南玻硅材料有限公司发展历程
图:2008-2014年黑猫股份营业收入与净利润
表:2011-2014年黑猫股份白炭黑业务收入、毛利率及占营业总收入的比重
图:2014-2017年中国白炭黑产量预测
图:2017年全球绿色轮胎分地区消费结构预测
图:2020年亚洲主要国家绿色轮胎市场份额预测
Classification of Silica
Main Applications of Silica
Regulations and Policies on Silica Industry in China, 2005-2014
Products, Techniques, Capacities and Production Bases for Major Silica Producers in the World (as of 2013)
Global Silica Market Share in 2013 (by Capacity)
Capacity Structure of Global Silica in 2013 (by Process)
Silica Expansion Projects in the World, 2010-2014
Consumption Structure of Global Precipitated Silica Market
Demand for Silica in USA, 2003-2018
Silica Production Structure in China, 2013 (by Output)
Capacity and Output of Silica in China, 2008-2013
Silica Import Volume in China, 2001-2014
Silica Import Value in China, 2001-2014
Silica Export Volume in China, 2001-2014
Silica Export Value in China, 2010-2014
Classification of Silica Market in China
Global Silica Producers’ Layout in China
Capacity and Output of Precipitated Silica in China, 2008-2013
Number of Precipitated Silica Producers in China, 2008-2012
Capacity and Output of Precipitated Silica in China, 2012
Capacity and Output of Precipitated Silica in China, 2012 (by Nature of Enterprise)
Capacity and Output of Precipitated Silica in China, 2012 (by Regions)
Precipitated Silica Producers’ Capacities in China (as of Sept. 2014)
Major Precipitated Silica Projects in China, 2013-2014
Capacity and Output of Fumed Silica in China, 2008-2013
Capacity and Output of Fumed Silica in China, 2012 (by Nature of Enterprise)
Fumed Silica Producers’ Capacities in China (as of Sept. 2014)
Major Fumed Silica Projects in China, 2013-2014
Consumption Structure for Precipitated Silica in China, 2013
Consumption Structure for Fumed Silica in China, 2013
Silica Consumption in China, 2008-2013
Output and YoY Growth Rate of Leather Footwear in China, 2000-2014
Silica Consumption in Footwear Industry in China, 2010-2013
Output and YoY Growth Rate of Rubber Tire Casting, 2007-2017
Output and YoY Growth Rate of Radial Tire Casting, 2007-2017
Silica Consumption in Tire Industry in China, 2010-2013
Silica Consumption in Silicone Rubber Industry in China, 2010-2013
Feed Output and YoY Change in China, 2007-2014
Output and YoY Change of Chemical Pesticide in China, 2005-2014
Silica Consumption in Pesticide & Feed Industry in China, 2010-2013
Coating Output and YoY Change in China, 2007-2014
Silica Consumption in Coating Industry in China, 2010-2013
Silica Consumption in Toothpaste Industry in China, 2010-2013
Operation of Solvay
Global Business Distribution of Solvay
Global Silica Business Distribution of Solvay
Main Financials of Solvay, 2013-2014 (by Business)
Business Distribution of Solvay in China
Development Course of Solvay in China
Introduction to Evonik
Production Bases of Inorganic Materials of Evonik in the World
Main Financials of Evonik, 2010-2013
Main Financials of Resource Efficiency Business of Evonic, 2010-2013
Main Financials of Resource Efficiency Business of Evonic, 2013-2014
Silica Production Bases of PPG in the World
Revenue Structure of PPG (buy Business), 2013
Revenue and Profit Breakdown of PPG (by Business), 2012-2013
Revenue and Profit Breakdown of PPG (by Business), 2013-2014
Global Business of Cabot
Revenue and Net Income of Cabot, FY2011-FY2014
Revenue Structure of Cabot (by Business), FY2013
Main Financials of Performance Materials of Cabot, FY2011-FY2014
Business Divisions of Wacker
Silica Production Bases of Wacker in the World
Main Financials of Wacker, 2008-2013
Revenue Structure of Wacker (by Business), 2013
Main Financials of Wacker Silicones, 2007-2013
Main Financials of Wacker, 2013-2014
Revenue Breakdown of Wacker (by Region), 2013-2014
Revenue Breakdown of Wacker (by Business), 2013-2014
Main Financials of Wacker Silicones, 2013-2014
Wacker’s Medium-term Targets
Global Business of Tokuyama
Introduction to Silica Products of Tokuyama
Main Financials of Tokuyama, FY2009-FY2013
Main Financials of Tokuyama, FY2013-FY2014
Revenue Structure of Tokuyama (by Business), FY2013
Revenue and Operating Income of Tokuyama (by Business), Q1 FY2014
Revenue and Operating Income of Specialty Products of Tokuyama, FY2009-FY2014
Main Financials Forecast of Tokuyama, FY2014
Medium-term Development Plan of Tokuyama
Introduction to Tokuyama Chemicals (Zhejiang) Co., Ltd.
Silica Application Fields and Product Types of Tokuyama Chemicals (Zhejiang) Co., Ltd.
Main Silica Products and Applications of Tong Hua Shuang Long Chemical
Output and Sales Volume of Silica of Tong Hua Shuang Long Chemical, 2007-2013
Revenue and Net Income of Tong Hua Shuang Long Chemical, 2008-2014
Revenue Breakdown of Tong Hua Shuang Long Chemical (by Products), 2012-2014
Revenue Structure of Tong Hua Shuang Long Chemical (by Regions), 2008-2014
Consolidated Gross Margin of Tong Hua Shuang Long Chemical, 2008-2014
Gross Margin of Tong Hua Shuang Long Chemical (by Products), 2012-2014
R & D Projects of Tong Hua Shuang Long Chemical, H1 2014
R&D Costs and % of Total Revenue of Tong Hua Shuang Long Chemical, 2008-2014
Tong Hua Shuang Long Chemical’s Revenue from Top 5 Clients and % of Total Revenue, H1 2014
Tong Hua Shuang Long Chemical’s Procurement from Top 5 Suppliers and % of Total Procurement, H1 2014
Revenue and Net Income of Tong Hua Shuang Long Chemical, 2014E-2017E
Revenue and Net Income of Do-fluoride Chemicals, 2008-2014
Revenue Breakdown of Do-fluoride Chemicals (by Business), 2013-2014
Revenue Structure of Do-fluoride Chemicals (by Regions), 2008-2014
Technical Indicators of Silica of Do-fluoride Chemicals
Capacity of Do-fluoride Chemicals (by Products)
Revenue and Net Income of Do-fluoride Chemicals, 2014E-2017E
Revenue and Net Income of Shandong Haihua Company Limited, 2008-2014
Revenue Breakdown of Shandong Haihua Company Limited (by Products), 2013-2014
Revenue Structure of Shandong Haihua Company Limited (by Regions), H1 2014
Revenue of Sodium Silicate and Silica Business and % of Total Revenue of Shandong Haihua Company Limited, 2010-2013
Assets and Liabilities of Silica Plant of Shandong Haihua Company Limited, 2010-2013
Output of Silica Plant of Shandong Haihua Company Limited, 2010-2013
Revenue and Net Income of Shandong Haihua Company Limited, 2014E-2017E
Revenue and Net Income of Longxing Chemical Stock, 2008-2014
Revenue Structure of Longxing Chemical Stock (by Products), 2014
Revenue Structure of Longxing Chemical Stock (by Regions), 2011-2014
Silica Projects of Longxing Chemical Stock
Technical Indicators of Silica of Longxing Chemical Stock
Revenue, Operating Cost, and Gross Margin of Silica Business of Longxing Chemical Stock, H1 2014
Revenue and Net Income of Longxing Chemical Stock, 2014E-2017E
Types and Applications of Silica of Shanxi Tond Chemical
Output, Sales Volume, and Inventory of Silica of Shanxi Tond Chemical, 2011-2013
Revenue and Net Income of Shanxi Tond Chemical, 2008-2014
Operating Cost Structure of Shanxi Tond Chemical (by Business), 2012-2013
Revenue Structure of Shanxi Tond Chemical (by Business), 2011-2014
Revenue and YoY Change of Silica Business of Shanxi Tond Chemical, 2011-2014
Revenue Structure of Silica Business of Shanxi Tond Chemical (by Regions), 2011-2014
Gross Margin of Shanxi Tond Chemical (by Products), 2011-2014
R&D Costs and % of Total Revenue of Shanxi Tond Chemical, 2011-2014
Silica R & D Projects of Shanxi Tond Chemical
Revenue and Net Income of Shanxi Tond Chemical, 2014E-2017E
Silica Production Structure of Shandong Link Silica (by Output) (as of Mar.2014)
Silica Product Types and Applications of Shandong Link Silica
Capacity, Output, and Sales Volume of Silica of Shandong Link Silica, 2009-2014
Main Operating Indicators of Shandong Link Silica, 2009-2014
Revenue Structure of Silica of Shandong Link Silica (by Products), 2009-2014
Revenue Structure of Silica of Shandong Link Silica (by Regions), 2009-2014
Gross Margin of Shandong Link Silica, 2009-2014
Shandong Link Silica’s Procurement from Top 5 Suppliers and % of Total Procurement, 2013
Shandong Link Silica’s Revenue from Top 5 Clients and % of Total Revenue, 2013
Development Course of Wuxi QueChen Silicon Chemical
Product Types and Models of Silica of Wuxi QueChen Silicon Chemical
Marketing Network of Fujian Zhengsheng Inorganic Materials
Product Types and Applications of Fujian Zhengsheng Inorganic Materials
Development Milestones of Sanming City Fengrun Chemical
Product Types and Applications of Silica of Sanming City Fengrun Chemical
Product Types and Applications of Silica of ZhengYuan Chemical
Product Types and Models of Guangzhou GBS High-tech & Industry
Technical Indicators of Zhejiang Fushite Group
Development Course of Yichang CSC Polysilicon
Revenue and Net Income of Jiangxi Black Cat Carbon Black, 2008-2014
Revenue and Gross Margin of Silica Business of Jiangxi Black Cat Carbon Black, 2011-2014
Silica Output in China, 2014E-2017E
Consumption Structure of Green Tire in the World (by Regions), 2017E
Green Tire Market Share in Major Asian Countries, 2020E
如果这份报告不能满足您的要求,我们还可以为您定制报告,请 留言说明您的详细需求。
|