|
|
|
报告导航:研究报告—
生命科学—制药医疗
|
|
2014-2017年中国药用辅料行业研究报告 |
 |
字数:3.3万 |
页数:100 |
图表数:110 |
|
中文电子版:8000元 |
中文纸版:4000元 |
中文(电子+纸)版:8500元 |
|
英文电子版:2300美元 |
英文纸版:2500美元 |
英文(电子+纸)版:2600美元 |
|
编号:ZLC011
|
发布日期:2014-11 |
附件:下载 |
 |
|
|
药用辅料是指生产药品和调配处方所使用的赋形剂和附加剂,是除活性成分以外,在安全性方面进行了合理评估并且包含在药物制剂中的物质。
中国已上市的药用辅料有500多种,但与美国1500余种、欧洲约3000余种相比,差距很大。中国市场规模前十的药用辅料为明胶胶囊、蔗糖、淀粉、薄膜包衣粉、1,2-丙二醇、聚乙烯吡咯烷酮(PVP)、羟丙基甲基纤维素(HPMC)、微晶纤维素、羟丙基纤维素(HPC)、乳糖。
其中,明胶胶囊作为传统型药用辅料,供应充足,出口量较大。2014上半年,中国明胶制装药用胶囊出口量达1427.5吨,金额达3240.8万美元。但是薄膜包衣、聚乙烯吡咯烷酮(PVP)等新型高端药用辅料仍主要依赖进口。
目前,药用辅料占中国药品制剂总产值的2%~3%左右,2013年中国药用辅料行业市场规模约为263.5亿元,预计到2017年将达548.3亿元。
中国现有药用辅料生产企业约400家,其中专业从事药用辅料生产的企业约90多家,占比仅为23%左右,其他大部分为化工或食品加工企业。
目前,国外领先的药用辅料公司如美国卡乐康、德国德固赛和美剂乐、法国罗盖特等均已在中国建立合资、独资公司或办事处。其中卡乐康主要提供薄膜包衣产品;美剂乐主要提供药用乳糖;罗盖特主要提供药用淀粉和多元醇等。
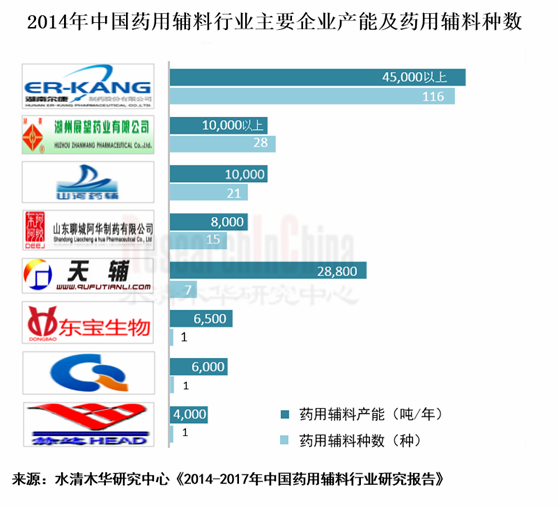
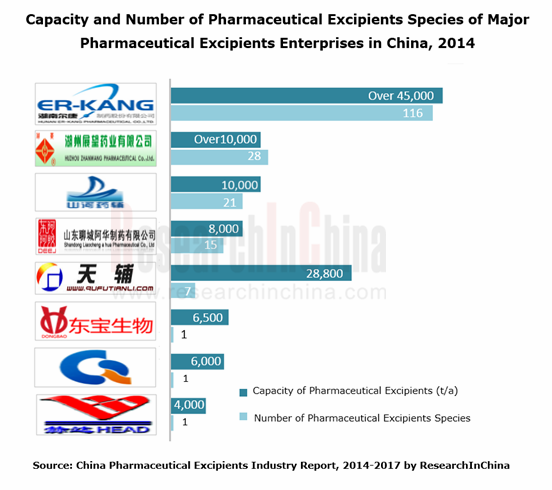
中国领先的药用辅料企业有尔康制药、山河药辅、东宝生物、青海明胶、阿华制药、展望药业和曲阜天利等,但市场集中度很低。作为龙头企业的尔康制药2013年的市场份额也仅有2.7%左右。
尔康制药是中国品种最全、规模最大的药用辅料生产企业之一,拥有药用辅料品种116个,产能4.5万吨以上。近两年,公司持续采用外延扩张战略,加快市场布局。2014年3月,公司先后收购了长沙正阳药用胶囊公司100%的股权和湖南洞庭柠檬酸化学有限公司51%的股权。此外,公司年产18万吨药用木薯淀粉的生产项目已于2014年3月31日投产;“华南药用辅料基地建设项目”已完成一期工程建设,将于2014年底达产。
山河药辅是国际药用辅料协会中国会员,主要生产微晶纤维素、羟丙纤维素、羟丙甲纤维素等21种新型药用辅料,产能1万吨。2014年4月24日,山河药辅拟IPO募集资金用于年产7100吨新型药用辅料生产线扩建项目等。
展望药业拥有羧甲淀粉钠、预胶化淀粉、羟丙甲纤维素、微晶纤维素等28种药用辅料产品,产能1万吨以上。公司部分生产基地已通过美国FDA认证和欧洲COS认证,外贸出口目前已占公司营业收入的25%。
《2014-2017年中国药用辅料行业研究报》包括以下内容:
 中国药用辅料行业运行环境,包括经济环境、政策环境、进入壁垒和上下游环境等; 中国药用辅料行业运行环境,包括经济环境、政策环境、进入壁垒和上下游环境等;
中国药用辅料行业发展现状、竞争格局、进出口情况以及发展趋势等;
中国10家药用辅料主要企业的经营情况、药用辅料业务及发展前景等;
2014-2017年中国药用辅料行业发展预测及主要企业经营对比。
Pharmaceutical excipients refer to adjuvants and additives used for production of pharmaceuticals and compounding of prescriptions. In addition to active ingredients, pharmaceutical excipients are also contained in pharmaceutical preparations after reasonable safety assessment.
China has launched more than 500 types of pharmaceutical excipients, far less than 1,500 types of the United States and 3,000 types of Europe. By market size, gelatin capsules, sucrose, starch, film-coated powder, 1,2-propylene glycol, polyvinylpyrrolidone (PVP), hydroxypropyl methyl cellulose (HPMC), microcrystalline cellulose, hydroxypropyl cellulose (HPC) and lactose rank as the top 10 pharmaceutical excipients in China.
Among them, the traditional pharmaceutical excipients --gelatin capsules are involved with adequate supply and large export volume. In H1 2014, China’s gelatin capsule export volume amounted to 1,427.5 tons and the export value hit USD32.408 million. However, China still relies on the import of film-coated powder, polyvinylpyrrolidone (PVP) and other new-type high-end pharmaceutical excipients.
Currently, pharmaceutical excipients account for about 2%-3% of China's total output value of pharmaceutical preparations. Chinese pharmaceutical excipient market size reached about RMB26.35 billion in 2013 and is expected to be RMB54.83 billion in 2017.
There are about 400 pharmaceutical excipient manufacturers in China, of which over 90 ones or 23% specialize in the production of pharmaceutical excipients, while most of the remaining ones focus on chemical or food processing.
Currently, foreign leading pharmaceutical excipient companies, such as Colorcon (the USA), Degussa (Germany), Meggle (Germany) and Roquette (France), have set up joint ventures, wholly-owned companies or offices in China. Colorcon mainly provides film-coated products; Meggle pharmaceutical lactose, and Roquette pharmaceutical starch and polyols.
Chinese pharmaceutical excipient giants include Er-Kang Pharmaceutical, Sunhere Pharmaceutical Excipients, Dongbao Bio-Tech, Qinghai Gelatin, Shandong Liaocheng A Hua Pharmaceutical, Zhanwang Pharmaceutical and Qufu Tianli, but their market concentration rate is rather low. As a tycoon, Er-Kang Pharmaceutical only seized about 2.7% market share in 2013.
Ranking among the largest Chinese pharmaceutical excipient producers with the most complete types, Er-Kang Pharmaceutical holds 116 types of pharmaceutical excipients and the capacity of 45,000 tons or more. Over the past two years, the company has continued to enforce epitaxial expansion strategy and accelerate market layout. In March 2014, the company acquired 100% stake in Changsha Zhengyang Pharmaceutical Capsule and 51% stake in Hunan Dongting Citric Acid Chemicals. In addition, the company’s 180,000 tons/a medicinal cassava starch production project went into operation on March 31, 2014; the first phase of "South China Pharmaceutical Excipient Base Construction Project" has been completed and will realize production goal at the end of 2014.
Sunhere Pharmaceutical Excipients is a Chinese member of International Pharmaceutical Excipient Confederation (IPEC), mainly producing microcrystalline cellulose, hydroxypropyl cellulose, hypromellose and other 18 types of new-type pharmaceutical excipients with the capacity of 10,000 tons. On April 24, 2014, Sunhere Pharmaceutical Excipients planned to go public so as to raise funds for 7,100 tons/a new-type pharmaceutical excipient production line expansion project.
Zhanwang Pharmaceutical produces 28 types of pharmaceutical excipient products including carboxymethyl starch sodium, pre-gelatinized starch, hypromellose, microcrystalline cellulose, etc., with the capacity of over 10,000 tons. Some production bases of the company have passed the certification of the US FDA and the European COS. Now, export has contributed 25% to the company’s revenue.
The report includes the following aspects:
Operating environment (including economy, policies, barriers to entry, upstream and downstream environment) of China pharmaceutical excipient industry;
Status quo, competition pattern, import & export and development trend of China pharmaceutical excipient industry;
Operation, pharmaceutical excipient business and prospects of 10 major Chinese pharmaceutical excipient companies;
Development forecast and operation comparison between major enterprises in China pharmaceutical excipient industry.
第一章 药用辅料概述
1.1 概述
1.2 分类
第二章 中国药用辅料行业运行环境
2.1 经济环境
2.2 政策环境
2.3 进入壁垒
2.3.1 行业资质壁垒
2.3.2 研发和技术壁垒
2.3.3 营销渠道及品牌壁垒
2.3.4 资金壁垒
2.4 上下游环境
2.4.1 上游
2.4.2 下游
第三章 中国药用辅料行业发展概况
3.1 国际市场
3.2 发展现状
3.3 竞争格局
3.4 进出口
3.4.1 进口
3.4.2 出口
3.5 细分产品
3.5.1 药用明胶
3.5.2 羟丙基甲基纤维素
3.5.3 药用淀粉
3.5.4 药用蔗糖
3.5.5 丙二醇
3.6 发展趋势
3.6.1 注重营销渠道和品牌建设
3.6.2 产业向着生产专业化、规范化发展
3.6.3 药用辅料品种不断增多
3.6.4 下游医药制剂业推动药用辅料行业发展
3.6.5 产业集中度逐渐提升
3.6.6 技术开发向安全性、功能性、适应性、高效性等方向发展
3.6.7 复合辅料将成为药用辅料产品的发展方向之一
第四章 主要企业
4.1 尔康制药
4.1.1 公司简介
4.1.2 经营情况
4.1.3 营收构成
4.1.4 毛利率
4.1.5 研发与投资
4.1.6 药用辅料业务
4.1.7 预测与展望
4.2 山河药辅
4.2.1 公司简介
4.2.2 经营情况
4.2.3 营收构成
4.2.4 毛利率
4.2.5 研发与投资
4.2.6 产销量
4.2.7 供销情况
4.2.8 预测与展望
4.3 东宝生物
4.3.1 公司简介
4.3.2 营业收入
4.3.3 营收构成
4.3.4 毛利率
4.3.5 研发与投资
4.3.6 药用辅料业务
4.3.7 预测与展望
4.4 青海明胶
4.4.1 公司简介
4.4.2 经营情况
4.4.3 营收构成
4.4.4 毛利率
4.4.5 药用辅料业务
4.4.6 预测与展望
4.5 赫达股份
4.5.1 公司简介
4.5.2 经营情况
4.5.3 营收构成
4.5.4 毛利率
4.5.5 研发与投资
4.5.6 药用辅料业务
4.5.7 产销量
4.5.8 供销情况
4.5.9 预测与展望
4.6 阿华制药
4.6.1 公司简介
4.6.2 经营情况
4.6.3 药用辅料业务
4.7 展望药业
4.7.1 公司简介
4.7.2 经营情况
4.7.3 药用辅料业务
4.8 曲阜天利
4.8.1 公司简介
4.8.2药用辅料业务
4.9 华北制药
4.9.1 公司简介
4.9.2 经营情况
4.9.3 营收构成
4.9.4 药用辅料业务
4.10 中维药业
4.10.1 公司简介
4.10.2 药用辅料业务
第五章 预测与展望
5.1 行业发展预测
5.2 主要企业经营对比
5.2.1 营业收入
5.2.2 净利润
5.2.3 净利润率
5.2.4 毛利率
5.2.5 药用辅料业务
1 Overview of Pharmaceutical Excipients
1.1 Overview
1.2 Classification
2 Operating Environment of China Pharmaceutical Excipient Industry
2.1 Economy
2.2 Policies
2.3 Entry Barriers
2.3.1 Qualification
2.3.2 R & D and Technology
2.3.3 Marketing Channels and Brands
2.3.4 Funds
2.4 Upstream and Downstream Environment
2.4.1 Upstream
2.4.2 Downstream
3 Development of China Pharmaceutical Excipient Industry
3.1 International Market
3.2 Status Quo
3.3 Competition Pattern
3.4 Import and Export
3.4.1 Import
3.4.2 Export
3.5 Breakdown Products
3.5.1 Pharmaceutical Gelatin
3.5.2 Hydroxypropyl Methyl Cellulose (HPMC)
3.5.3 Pharmaceutical Starch
3.5.4 Pharmaceutical Sucrose
3.5.5 Propanediol
3.6 Development Trend
3.6.1 Marketing Channels and Brand Building Are Strengthened
3.6.2 The Industry Heads toward Production Specialization and Standardization
3.6.3 The Varieties of Pharmaceutical Excipients Increase
3.6.4 Downstream Pharmaceutical Preparation Industry Boosts Pharmaceutical Excipient Industry
3.6.5 Industrial Concentration Rate Will Ascend Gradually
3.6.6 Technological Development Turns the Focus to Security, Functionality, Adaptability, Efficiency, etc.
3.6.7 Composite Excipients Will Be One Development Direction of Pharmaceutical Excipients
4 Major Companies
4.1 Er-Kang Pharmaceutical
4.1.1 Profile
4.1.2 Operation
4.1.3 Revenue Structure
4.1.4 Gross Margin
4.1.5 R & D and Investment
4.1.6 Pharmaceutical Excipient Business
4.1.7 Forecast and Outlook
4.2 Sunhere Pharmaceutical Excipients
4.2.1 Profile
4.2.2 Operation
4.2.3 Revenue Structure
4.2.4 Gross Margin
4.2.5 R & D and Investment
4.2.6 Output and Sales Volume
4.2.7 Supply
4.2.8 Forecast and Outlook
4.3 Dongbao Bio-Tech
4.3.1 Profile
4.3.2 Revenue
4.3.3 Revenue Structure
4.3.4 Gross Margin
4.3.5 R & D and Investment
4.3.6 Pharmaceutical Excipient Business
4.3.7 Forecast and Outlook
4.4 Qinghai Gelatin
4.4.1 Profile
4.4.2 Operation
4.4.3 Revenue Structure
4.4.4 Gross Margin
4.4.5 Pharmaceutical Excipient Business
4.4.6 Forecast and Outlook
4.5 Shandong Head
4.5.1 Profile
4.5.2 Operation
4.5.3 Revenue Structure
4.5.4 Gross Margin
4.5.5 R & D and Investment
4.5.6 Pharmaceutical Excipient Business
4.5.7 Output and Sales Volume
4.5.8 Supply
4.5.9 Forecast and Outlook
4.6 Shandong Liaocheng A Hua Pharmaceutical
4.6.1 Profile
4.6.2 Operation
4.6.3 Pharmaceutical Excipient Business
4.7 Zhanwang Pharmaceutical
4.7.1 Profile
4.7.2 Operation
4.7.3 Pharmaceutical Excipient Business
4.8 Qufu Tianli
4.8.1 Profile
4.8.2 Pharmaceutical Excipient Business
4.9 North China Pharmaceutical
4.9.1 Profile
4.9.2 Operation
4.9.3 Revenue Structure
4.9.4 Pharmaceutical Excipient Business
4.10 Joinway Pharmaceutical
4.10.1 Profile
4.10.2 Pharmaceutical Excipient Business
5 Forecast and Outlook
5.1 Industrial Development Forecast
5.2 Operation Comparison between Major Enterprises
5.2.1 Revenue
5.2.2 Net Profit
5.2.3 Net Profit Margin
5.2.4 Gross Margin
5.2.5 Pharmaceutical Excipient Business
表:药用辅料分类
图:1985-2014年中国GDP及同比增长率
表:中国药用辅料行业相关政策法规
图:2009-2013年中国玉米淀粉产量
图:2014年10月-11月中国玉米淀粉价格走势
图:2013年12月-2014年4月中国精制棉价格走势
图:2009-2013年中国化学药品制剂制造业销售收入及同比增长
图:2009-2013年中国中成药制造业销售收入及同比增长
图:2009-2013年中国生物、生化制品制造业销售收入及同比增长
图:2009-2014年中国药用辅料行业市场规模
图:中国药用辅料行业企业构成(分类型)
图:2013年中国药用辅料行业主要企业市场占有率
图:2013年中国药用辅料行业主要企业药用辅料产品、总类及产能
表:2013-2014年中国明胶制装药用胶囊进口前十国家地区的进口量及金额
表:2013-2014年中国明胶制装药用胶囊出口前十国家地区的出口量及金额
图:世界各地区明胶消费量占比
图:中国明胶产量构成(按类型)
图:2005-2014年中国明胶及骨明胶市场容量
图:2006-2013年中国MC/HPMC产能
图:2009-2016年中国医药级纤维素醚需求量
图:2009-2013年中国淀粉产量
图:中国淀粉产量占比(分产品)
表:2013年中国淀粉进出口情况(分产品)
表:中国药用淀粉质量指标
图:2011-2015E中国药用淀粉需求量
图:2006/07-2013/14年度中国糖产量及同比增长率
图:2013/14年度中国糖主产区产量占比
表:药用蔗糖与白砂糖质量指标对比
图:2005-2010年中国丙二醇产量及同比增长
表:2014,1-9月中国丙二醇进出口情况
图:2009-2014年尔康制药营业收入及净利润
图:2009-2014年尔康制药营业收入(分产品)
图:2009-2014年尔康制药营业收入构成(分产品)
图:2009-2014年尔康制药营业收入(分地区)
图:2009-2014年尔康制药营业收入构成(分地区)
图:2009-2014年尔康制药毛利率
图:2009-2014年尔康制药毛利率(按产品)
图:2009-2013年尔康制药研发投入及占营业收入比
表:2013年尔康制药募投项目完成情况
图:2009-2014年尔康制药药用辅料业务营业收入及占营业收入比
表:2013年尔康制药主要药用辅料产能
图:2012-2017E尔康制药营业收入及净利润预测
图:2011-2013年山河药辅营业收入及净利润
图:2011-2013年山河药辅营业收入(分产品)
图:2011-2013年山河药辅营业收入构成(分产品)
图:2011-2013年山河药辅营业收入(分地区)
图:2011-2013年山河药辅营业收入构成(分地区)
图:2011-2013年山河药辅毛利率
图:2011-2013年山河药辅研发投入及占营业收入比
表:山河药辅募投项目及募集资金分配情况
表:2011-2013年山河药辅主要产品的产能、产能利用率及产品产销率
表:2011-2013年山河药辅基础原料产品前五大客户
图:2011-2013年山河药辅粗品精加工产品前五大客户
表:2011-2013年山河药辅基础原料生产的前五大供应商
表:2011-2013年山河药辅精品精加工生产的前五大供应商
图:2012-2017E山河药辅营业收入及净利润预测
图:2010-2014年东宝生物营业收入及净利润
表:2010-2014年东宝生物营业收入(分产品)
图:2011-2014年东宝生物营业收入(分地区)
图:2011-2014年东宝生物营业收入构成(分地区)
图:2011-2014年东宝生物毛利率
图:2011-2014年东宝生物毛利率(分产品)
图:2011-2013年东宝生物毛利率(分地区)
图:2011-2013年东宝生物研发投入及占营业收入比
表:2013年东宝生物募投项目完成情况
图:2010-2014上半年东宝生物药用明胶营业收入
图:2012-2017年东宝生物营业收入及净利润预测
图:2010-2014年青海明胶营业收入及净利润
图:2010-2014年青海明胶营业收入(分产品)
图:2010-2014年青海明胶营业收入(分行业)
图:2011-2014年青海明胶营业收入(分地区)
图:2011-2014年青海明胶营业收入构成(分地区)
图:2010-2014年青海明胶毛利率
图:2010-2014年青海明胶毛利率(分产品)
图:2012-2014年青海明胶毛利率(分地区)
图:2010-2014年青海明胶药用辅料业务营业收入及占总营业收入比
图:2012-2017E青海明胶营业收入及净利润
表:纤维素醚分类及特性
图:2011-2013年赫达股份营业收入及净利润
图:2011-2013年赫达股份营业收入(分产品)
图:2011-2013年赫达股份营业收入构成(分产品)
图:2011-2013年赫达股份营业收入(分地区)
图:2011-2013年赫达股份营业收入构成(分地区)
图:2011-2013年赫达股份国内营业收入(分地区)
图:2011-2013年赫达股份国外营业收入(分地区)
图:2011-2013年赫达股份毛利率
图:2011-2013年赫达股份毛利率(分产品)
图:2011-2013年赫达股份研发投入及占营业收入比
表:赫达股份募投项目及募集资金分配
图:2011-2013年赫达股份药用辅料业务营业收入、占总营业收入比及毛利率
图:2011-2013年赫达股份主要产品产能、产量及销量
表:2011-2013年赫达股份双丙酮丙烯酰胺产能、产量及销量
表:2011-2013年赫达股份前五大客户
表:2011-2013年赫达股份前五大供应商
图:2012-2017E赫达股份营业收入及净利润预测
图:2010-2014年阿华制药总资产、营业收入及净利润
图:阿华制药主要产品产能及用途
图:2012-2016E展望药业营业收入预测
表:曲阜天利主要药用辅料产品产能
表:2009-2014年华北制药营业收入及净利润
图:2009-2014年华北制药营业收入(分产品)
图:2009-2014年华北制药营业收入构成(分产品)
图:2009-2014年华北制药营业收入(分地区)
图:2009-2014年华北制药营业收入构成(分地区)
图:2012-2017E中国药用辅料行业市场规模预测
图:2009-2013年中国药用辅料行业主要企业营业收入
图:2009-2013年中国药用辅料行业主要企业净利润
图:2009-2013年中国药用辅料行业主要企业净利润率
图:2009-2013年中国药用辅料行业主要企业毛利率
图:2009-2013年中国主要药用辅料企业药用辅料业务营业收入
Classification of Pharmaceutical Excipients
China's GDP and YoY Growth Rate, 1985-2014
Policies and Regulations on China Pharmaceutical Excipient Industry
China’s Corn Starch Output, 2009-2013
China’s Corn Starch Price, Oct-Nov 2014
China’s Refined Cotton Price, Dec 2013-Apr 2014
China’s Chemical Preparation Manufacturing Revenue and YoY Growth, 2009-2013
China’s Chinese Patent Medicine Manufacturing Revenue and YoY Growth, 2009-2013
China’s Biological and Biochemical Manufacturing Revenue and YoY Growth, 2009-2013
China’s Pharmaceutical Excipient Market Size, 2009-2014
Structure of Chinese Pharmaceutical Excipient Enterprises (by Type)
Market Share of Major Chinese Pharmaceutical Excipient Companies, 2013
Products, Categories and Capacity of Major Chinese Pharmaceutical Excipient Companies, 2013
Top 10 Gelatin Capsule Import Sources of China by Import Volume and Value, 2013-2014
Top 10 Gelatin Capsule Export Destinations of China by Export Volume and Value, 2013-2014
Gelatin Consumption Structure (%) by Country / Region
China’s Gelatin Output Structure (by Type)
China’s Gelatin and Bone Gelatin Market Capacity, 2005-2014
China’s MC/HPMC Capacity, 2006-2013
China’s Pharmaceutical Cellulose Ether Demand, 2009-2016E
China’s Starch Output, 2009-2013
Proportion of China’s Starch Output (by Product)
China’s Starch Import and Export (by Product), 2013
China’s Medicinal Starch Quality Index
China’s Medicinal Starch Demand, 2011-2015E
China’s Sugar Output and YoY Growth Rate, 2006/07-2013/14
Output Proportion of China's Main Sugar Producing Areas, 2013-2014
Quality Index Comparison between Medicinal Sucrose and White Sugar
China’s Propanediol Output and YoY Growth, 2005-2010
China’s Propanediol Import and Export, Jan-Sep 2014
Revenue and Net Income of Er-Kang Pharmaceutical, 2009-2014
Revenue of Er-Kang Pharmaceutical (by Product), 2009-2014
Revenue Structure of Er-Kang Pharmaceutical (by Product), 2009-2014
Revenue of Er-Kang Pharmaceutical (by Region), 2009-2014
Revenue Structure of Er-Kang Pharmaceutical (by Region), 2009-2014
Gross Margin of Er-Kang Pharmaceutical, 2009-2014
Gross Margin of Er-Kang Pharmaceutical (by Product), 2009-2014
R & D Costs and % of Total Revenue of Er-Kang Pharmaceutical, 2009-2013
Completion of Fund-raising Projects of Er-Kang Pharmaceutical, 2013
Pharmaceutical Excipient Revenue and % of Total Revenue of Er-Kang Pharmaceutical, 2009-2014
Main Pharmaceutical Excipient Capacity of Er-Kang Pharmaceutical, 2013
Revenue and Net Income of Er-Kang Pharmaceutical, 2012-2017E
Revenue and Net Income of Sunhere Pharmaceutical Excipients, 2011-2013
Revenue of Sunhere Pharmaceutical Excipients (by Product), 2011-2013
Revenue Structure of Sunhere Pharmaceutical Excipients (by Product), 2011-2013
Revenue of Sunhere Pharmaceutical Excipients (by Region), 2011-2013
Revenue Structure of Sunhere Pharmaceutical Excipients (by Region), 2011-2013
Gross Margin of Sunhere Pharmaceutical Excipients, 2011-2013
R & D Costs and % of Total Revenue of Sunhere Pharmaceutical Excipients, 2011-2013
Fund-raising Projects of Sunhere Pharmaceutical Excipients and Allocation of Raised Funds
Capacity, Capacity Utilization and Sales-Output Ratio of Main Products of Sunhere Pharmaceutical Excipients, 2011-2013
Top Five Customers of Sunhere Pharmaceutical Excipients in Basic Raw Material Products, 2011-2013
Top Five Customers of Sunhere Pharmaceutical Excipients in Crude-product Fine Processing Products, 2011-2013
Top Five Suppliers of Sunhere Pharmaceutical Excipients in Basic Raw Material Production, 2011-2013
Top Five Suppliers of Sunhere Pharmaceutical Excipients in Excellent-product Fine Processing and Production, 2011-2013
Revenue and Net Income of Sunhere Pharmaceutical Excipients, 2012-2017E
Revenue and Net Income of Dongbao Bio-Tech, 2010-2014
Revenue of Dongbao Bio-Tech (by Product), 2010-2014
Revenue of Dongbao Bio-Tech (by Region), 2011-2014
Revenue Structure of Dongbao Bio-Tech (by Region), 2011-2014
Gross Margin of Dongbao Bio-Tech, 2011-2014
Gross Margin of Dongbao Bio-Tech (by Product), 2011-2014
Gross Margin of Dongbao Bio-Tech (by Region), 2011-2013
R & D Costs and % of Total Revenue of Dongbao Bio-Tech, 2011-2013
Completion of Fund-raising Projects of Dongbao Bio-Tech, 2013
Pharmaceutical Gelatin Revenue of Dongbao Bio-Tech, 2010-H1 2014
Revenue and Net Income of Dongbao Bio-Tech, 2012-2017E
Revenue and Net Income of Qinghai Gelatin, 2010-2014
Revenue of Qinghai Gelatin (by Product), 2010-2014
Revenue of Qinghai Gelatin (by Sector), 2010-2014
Revenue of Qinghai Gelatin (by Region), 2011-2014
Revenue Structure of Qinghai Gelatin (by Region), 2011-2014
Gross Margin of Qinghai Gelatin, 2010-2014
Gross Margin of Qinghai Gelatin (by Product), 2010-2014
Gross Margin of Qinghai Gelatin (by Region), 2012-2014
Pharmaceutical Excipient Revenue and% of Total Revenue of Qinghai Gelatin, 2010-2014
Revenue and Net Income of Qinghai Gelatin, 2012-2017E
Classification and Properties of Cellulose Ether
Revenue and Net Income of Shandong Head, 2011-2013
Revenue of Shandong Head (by Product), 2011-2013
Revenue Structure of Shandong Head (by Product), 2011-2013
Revenue of Shandong Head (by Region), 2011-2013
Revenue Structure of Shandong Head (by Region), 2011-2013
Domestic Revenue of Shandong Head (by Region), 2011-2013
Overseas Revenue of Shandong Head (by Region), 2011-2013
Gross Margin of Shandong Head, 2011-2013
Gross Margin of Shandong Head (by Product), 2011-2013
R & D Costs and % of Total Revenue of Shandong Head, 2011-2013
Fund-raising Projects of Shandong Head and Allocation of Raised Funds
Pharmaceutical Excipient Revenue, % of Total Revenue and Gross Margin of Shandong Head, 2011-2013
Capacity, Output and Sales Volume of Main Products of Shandong Head, 2011-2013
Diacetone Acrylamide Capacity, Output and Sales Volume of Shandong Head, 2011-2013
Top Five Customers of Shandong Head, 2011-2013
Top Five Suppliers of Shandong Head, 2011-2013
Revenue and Net Income of Shandong Head, 2012-2017E
Total Assets, Revenue and Net Income of Shandong Liaocheng A Hua Pharmaceutical, 2010-2014
Capacity and Application of Main Products of Shandong Liaocheng A Hua Pharmaceutical
Revenue of Zhanwang Pharmaceutical, 2012-2016E
Capacity of Main Pharmaceutical Excipient Products of Qufu Tianli
Revenue and Net Income of North China Pharmaceutical, 2009-2014
Revenue of North China Pharmaceutical (by Product), 2009-2014
Revenue Structure of North China Pharmaceutical (by Product), 2009-2014
Revenue of North China Pharmaceutical (by Region), 2009-2014
Revenue Structure of North China Pharmaceutical (by Region), 2009-2014
Chinese Pharmaceutical Excipient Market Size, 2012-2017E
Revenue of Major Companies in China Pharmaceutical Excipient Industry, 2009-2013
Net Income of Major Companies in China Pharmaceutical Excipient Industry, 2009-2013
Net Profit Margin of Major Companies in China Pharmaceutical Excipient Industry, 2009-2013
Gross Margin of Major Companies in China Pharmaceutical Excipient Industry, 2009-2013
Pharmaceutical Excipient Revenue of Major Chinese Pharmaceutical Excipient Companies, 2009-2013
如果这份报告不能满足您的要求,我们还可以为您定制报告,请 留言说明您的详细需求。
|