|
|
|
报告导航:研究报告—
TMT产业—电子半导体
|
|
2014年全球及中国柔性线路板(FPCB)行业研究报告 |
 |
字数:2.2万 |
页数:150 |
图表数:160 |
|
中文电子版:8000元 |
中文纸版:4000元 |
中文(电子+纸)版:8500元 |
|
英文电子版:2400美元 |
英文纸版:2600美元 |
英文(电子+纸)版:2700美元 |
|
编号:ZYW188
|
发布日期:2014-11 |
附件:下载 |
 |
|
|
《2014年全球及中国FPCB行业研究报告》包含以下内容:
1、FPCB简介
2、FPCB市场分析
3、FPCB产业分析
4、22家FPCB厂家研究
5、9家FCCL厂家研究
2013年FPCB行业高速发展,2013年全球FPCB市场规模大约120.3亿美元,比2012年大涨16.2%。韩国厂家高速发展,对行业前景过分乐观,从2012年初就大举扩张产能,2013年2季度大部分新产能加入,韩国FPCB厂家客户单一,对大客户三星和LG依赖严重,在价格谈判中缺乏竞争力,遂导致在2013年4季度,韩国FPCB厂家大幅度杀价竞争。
进入2014年价格下滑状况继续恶化,遂导致韩国厂家收入锐减。产能高速扩展的后果是固定成本居高不下,导致利润率大跌。预计韩国FPCB龙头厂家INTERFLEX 2014年收入锐减近50%,营业利润率由2013年的盈亏持平到2014年亏损27%。INTERFLEX也受苹果转移订单影响,2014年几乎没有接到来自苹果的订单。
韩国厂家的另一个压力来自日元贬值,而韩元相对日元升值。日本产品本身性能就比较好,价格又得益于日元贬值而更具竞争力。
苹果缩短供应链,将更多订单交给台湾厂家,美国M-Flex收入下滑,预计2014年下滑20%,亏损幅度加大,营业利润率预计从2013年的-8.4%下滑到-11.8%。
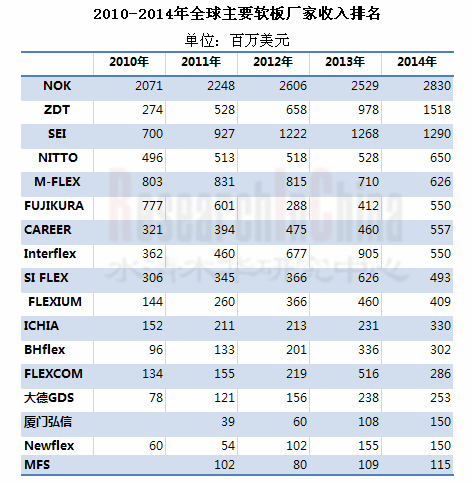
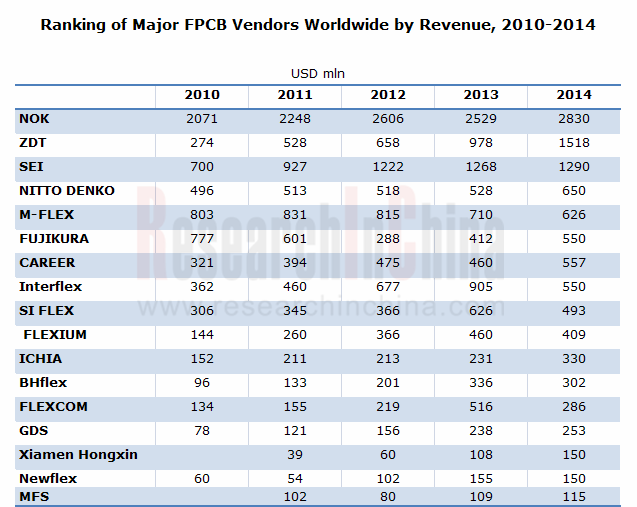
虽然韩国厂家大幅度下滑,但是FPCB市场最大客户苹果并未降低采购价格,同时新iPhone尺寸更大,所需FPCB更多,因此台湾和日本厂家收入大增,填补了空缺,预计2014年全球FPCB市场规模达126.08亿美元,比2013年增长4.8%。
台湾厂家以(臻鼎)ZDT增长最多,同属鸿海体系的ZDT在2014年获得更多苹果分配的订单,预计2014年收入大增55%,达到15.18亿美元,超越日本三菱电气(SEI)成为全球第二。全球第一的NOK则减少日本本土产能,加大泰国和中国大陆产能,不仅收入大增,也迅速扭亏为盈。同时全球硬盘(HDD)市场趋于稳定,出货量比2013年微幅增长,而HDD用FPCB是NOK的主要产品。NOK也是苹果主力供应商。
展望2015年,智能手机成长趋缓,平板电脑开始下滑,笔记本电脑微幅增长或持平。LCD-TV电视有望小幅度成长。可穿戴设备有望大幅度成长,不过其采用FPCB的面积太小,不足以拉动市场。2015年最能拉动市场的可能是LCD-TV电视。LCD-TV电视经历6-8年的普及后,预计将出现一波换机潮,消费者选择分辨率更高的4K电视,或者将原来较小的32-37寸电视换为40-42寸电视。
预计2015年韩国厂家难以扭转颓势,因为三星手机出货量增幅放缓,三星LCD出货量也在下滑,并且出现亏损。韩国厂家恐出现倒闭。日本和台湾厂家则从中获利,尤其日本厂家在日元持续贬值后,提高了竞争力。
Global and China FPCB Industry Report, 2014 mainly deals with the followings:
1. Overview of FPCB;
2. FPCB market;
3. FPCB industry;
4. 22 FPCB vendors;
5. 9 FCCL vendors.
In 2013, FPCB industry enjoyed a high-speed growth with the market size approximating USD12.03 billion, up 16.2% from the level in 2012. The South Korean vendors developed rapidly and were excessively upbeat about the industry’s outlook, aggressively expanding capacity starting from the very beginning of 2012. As a result, most of new capacity was available in Q2 2013. However, the FPCB companies in South Korea without diversified customers, were heavily dependent on the key accounts such as Samsung and LG, thus making them less competitive during negotiations. Therefore, these vendors cut the prices steeply in Q4 2013, sending them into price war.
In 2014, price decline continued to deteriorate, which led to a sharp fall in revenue of South Korean vendors. The implications of high-speed capacity expansion are high fixed costs, which would thus result in a plunge in profit margin. It is projected that the revenue of INTERFLEX, a leading South Korean FPCB company, would tumble by 50%, and its operating margin would record a 27% loss in 2014 in contrast to no-profit-no-loss in 2013. Additionally, affected by the order shift of Apple, the company has hardly received any orders from Apple in 2014.
Another pressure for the vendors in South Korea came from the depreciated yen, and the won appreciated against the yen. However, the Japanese products have better performance; coupled with the reduced prices bought on by yen depreciation, they are more competitive.
Apple shortened the supply chain, giving more of its orders to the vendors in Taiwan, which resulted in a fall in revenue of M-Flex, at an estimated 20% drop in 2014. And as the losses expand, M-Flex’s operating margin is expected to slip from -8.4% in 2013 to -11.8%.
Despite a substantial decline in revenue of the South Korean vendors, the biggest customer of FPCB market—Apple did not bring down the purchase price. Meanwhile, the new iPhones have bigger size and therefore need more FPCBs. Consequently, the vendors in Taiwan and Japan saw a big increase in revenue, thereby filling in the vacuum. We predict that in 2014 the market size of FPCB worldwide reached USD12.608 billion, up 4.8% from 2013.
Of the Taiwanese vendors, ZDT generated the most revenue. ZDT under Hon Hai obtained more of the orders from Apple. It is forecasted that its revenue will jump by 55% to USD1.518 billion in 2014, overtaking Japan’s SEI as the world's second. In contrast, the world’s first NOK reduced the capacity in Japan, instead expanded the capacity in Thailand and Mainland China, which helped not only substantially increase its revenue but also rapidly turn out of red. At the same time, the global HDD market tends to be stable, with the shipments rising mildly from 2013. The HDD for FPCB is the main product of NOK, an Apple's leading supplier.
We project that in 2015 smartphones will present a slowing growth, tablet PCs will begin to decline, notebook computers will grow slightly or be flat. Moreover, LCD-TVs are expected to grow by a small margin. And wearable devices are very likely to rise significantly, but its application of FPCB is too small to fuel the market. In 2015, it is more than likely that LCD-TV will be the mainstay to drive the market. And after 6-8 years of popularization, LCD-TV is expected to undergo a boom of TV set replacement. And consumers will choose 4K TV with higher resolution or change the original smaller 32-37 inch television to 40-42 inch television.
We expect that it will be very hard for the South Korean vendors to reverse the downtrend when Samsung’s mobile phone shipments slow down and its LCD shipments are falling with losses. It is more likely that the South Korean vendors will suffer collapse, while the companies from Japan and China’s Taiwan will benefit from it, especially Japanese ones that had improved the competitiveness after the repeated depreciation of yen.
第一章 软板简介
1.1、软板简介
1.2、单面板
1.3、双面板、单铜双做、单+单、多层板
1.4、软板制造流程
1.5、FinePitch FPCB
1.6、PEDLIM
第二章 FPCB市场
2.1、FPCB市场规模
2.2、全球手机市场
2.3、全球智能手机市场
2.4、中国手机市场
2.5、平板电脑市场
2.6、笔记本电脑市场
2.7、台式机市场
2.8、触控屏市场规模
2.9、触控屏厂家排名
2.10、触控屏厂家与客户配套关系
2.11、可穿戴设备
第三章 软板产业
3.1、软板产业链
3.2、FPCB厂家业务模式
3.3、FPC产业地域分布
3.4、FPCB客户供应关系
3.5、手机软板供应关系
3.6、FPCB厂家排名
第四章 FPCB厂家研究
4.1、FUJIKURA(藤仓)
4.2、Nippon Mektron(旗胜)
4.2.1、珠海紫翔电子科技有限公司MEKTEC (Zhuhai)
4.2.2、苏州紫翔电子科技有限公司MEKTEC (Suzhou)
4.3、日东电工NITTO DENKO
4.4、Dexerials索尼凯美高
4.5、M-FLEX
4.6、台郡科技FLEXIUM
4.7、嘉联益CAREER
4.8、旭软SUNFLEX
4.9、安捷利AKM
4.10、厦门弘信电子科技
4.11、Parlex
4.12、SI Flex
4.13、住友电工Sumitomo Electric Industries
4.14、DAEDUCK GDS
4.15、Interflex
4.16、深圳市精诚达电路科技
4.17、范桓BHflex 090460
4.18、Newflex 085670
4.19、FLEXCOM
4.20、MFS
4.21、毅嘉Ichia
4.22、臻鼎ZDT
第五章 FCCL厂家
5.1、宏仁电子GraceElectron
5.2、台虹科技Taiflex
5.3、新扬科技ThinFlex
5.4、新日本制铁化学NIPPON STEEL CHEMICAL
5.5、有泽制造所Arisawa
5.6、律胜科技MICROCOSM
5.7、亚洲电材AEM
5.8、达迈科技TAIMIDE
5.9、INNOX
1 Overview of FPCB
1.1 Overview
1.2 Single Side FPCB
1.3 Double Side, Double Access Flexible Circuit, Single+Single, and Multi-layer
1.4 Manufacturing Process of FPCB
1.5 FinePitch FPCB
1.6 PEDLIM
2 FPCB Market
2.1 Market Size
2.2 Global Mobile Phone Market
2.3 Global Smartphone Market
2.4 China’s Mobile Phone Market
2.5 Tablet PC Market
2.6 Notebook Computer Market
2.7 Desktop PC Market
2.8 Touch Panel Market Size
2.9 Ranking of Touch Panel Companies
2.10 Supplier Relationship between Touch Panel Companies and Their Customers
2.11 Wearable Devices
3 FPCB Industry
3.1 Industry Chain
3.2 Business Model
3.3 Geographical Distribution
3.4 FPCB Supplier Relationship
3.5 Mobile Phone FPCB Supplier Relationship
3.6 Ranking of FPCB Vendors
4 FPCB Companies
4.1 FUJIKURA
4.2 Nippon Mektron
4.2.1 MEKTEC (Zhuhai)
4.2.2 MEKTEC (Suzhou)
4.3 NITTO DENKO
4.4 Dexerials
4.5 M-FLEX
4.6 FLEXIUM
4.7 CAREER
4.8 SUNFLEX
4.9 AKM
4.10 Xiamen Hongxin Electron-Tech Co., Ltd.
4.11 Parlex
4.12 SI Flex
4.13 Sumitomo Electric Industries
4.14 DAEDUCK GDS
4.15 Interflex
4.16 Shenzhen JingChengDa Circuit Technology Co., Ltd.
4.17 BHflex
4.18 Newflex
4.19 FLEXCOM
4.20 MFS
4.21 Ichia
4.22 ZDT
5 FCCL Companies
5.1 GraceElectron
5.2 Taiflex
5.3 ThinFlex
5.4 NIPPON STEEL CHEMICAL
5.5 Arisawa
5.6 MICROCOSM
5.7 AEM
5.8 TAIMIDE
5.9 INNOX
FPC单面板结构
双面板结构
单铜双做结构
单+单结构图
双层板结构图
COF构装图
软硬板示意图
软板制造流程
曝光机工作概念
显像冲洗
蚀刻冲洗
剥膜
热压和
FPCB L/S Roadmap
2007-2015年FPCB市场规模
2013\2017年FPCB市场下游分布
2007-2015年全球手机出货量
2011-2014年全球3G/4G手机出货量地域分布
Worldwide Mobile Phone Sales to End Users by Vendor in 2013 (Thousands of Units)
Worldwide Smartphone Sales to End Users by Vendor in 2013 (Thousands of Units)
Worldwide Smartphone Sales to End Users by Operating System in 2013 (Thousands of Units)
2013-2015年全球Top 13智能手机厂家出货量
2014年1-9月中国手机月度出货量
2011-2016年全球平板电脑出货量
2013年平板电脑主要品牌市场占有率
2012、2013年全球平板电脑制造厂家产量
2008-2015年笔记本电脑出货量
2010-2013年全球主要笔记本电脑ODM厂家出货量
2009-2015年HDD出货量
2008-2015年Desktop PC出货量
Top 5 Vendors, Worldwide PC Shipments, Fourth Quarter 2013
Top 5 Vendors, Worldwide PC Shipments 2013
2010-2016年全球触控屏市场规模(金额)
2010-2016年全球触控屏市场规模(出货量)
2010-2015年全球触控屏市场出货量下游分布
2010-2013年全球主要OUT-CELL触摸屏厂家收入
2012-2013年全球主要OUT-CELL触摸屏厂家营业利润率
2010-2013主要触控屏厂家出货量
三星2012-2013年手机触控屏供应商市场占有率
三星2012-2013年TabletPC触控屏供应商市场占有率
2012年诺基亚触控屏主要供应厂家所占比例
2012年LG触控屏主要供应厂家所占比例
2012年HTC触控屏主要供应厂家所占比例
2012-2020年全球可穿戴设备出货量
2012-2016年中国可穿戴设备出货量
2012-2016年中国可穿戴设备市场规模
台湾软板产业链
2009-2013年全球FPCB产业收入地域分布
2011-2013三星集团软板主要供应商供应比例(金额)
2011年LG 软板主要供应商供应比例(金额)
2011-2013苹果集团软板主要供应商供应比例(金额)
2013-2014年苹果iPhone用FPCB主要供应商供应比例
2010-2014年日本FPCB厂家收入排名
2012-2014年韩国FPCB厂家收入排名
2012-2014年韩国FPCB厂家运营利润率排名
2010-2014年台湾FPCB厂家收入排名
2009-2014台湾FPC厂家运营利润率排名
2010-2014年全球主要软板厂家收入排名
藤仓泰国基地一览
2004-2015财年藤仓收入与运营利润统计
2008-2013财年藤仓收入部门分布
2013-2015财年Fujikura收入产品分布
2007-2013财年藤仓运营利润部门分布
2008-2015财年藤仓FPC收入产品分布
FY2014-FY2015藤仓电子部门收入与营业利润
Mektron组织结构
FY2006-FY2015 NOK收入与运营利润
FY2006-FY2015 NOK收入产品分布
FY2010-FY2015 NOK收入地域分布
FY2010-FY2015 MEKTRON 收入地域分布
Mektron全球分布
2008-2014年珠海紫翔电子科技有限公司收入与运营利润率
2005-2015财年日东电工收入与运营利润率
2009-2015年财年日东电工FPC事业收入与光电(Optronics)事业部运营利润
2004-2014财年M-FLEX收入与运营利润
3Q12-3Q4 MFLEX季度收入
2010-2013财年M-FLEX收入地域分布
2006-2013财年M-FELX收入国别结构
2006-2013财年M-FELX运营利润地域分布
2006-2008财年M-FLEX 索爱和摩托罗拉占收入比例
2006-2014财年M-FLEX客户结构比例
2008年4季度-2014年2季度MFLEX收入下游分布
2005-2014年台郡收入与毛利率
2005-2014年台郡收入与运营利润率
2012年10月-2014年10月台郡月度收入与年增率
2009-2013年台郡收入下游应用分布
2009-2013年台郡FPC层数分布
嘉联益关联公司关系
嘉联益各部门介绍
2003-2014年嘉联益收入与运营利润率
2012年10月-2014年10月嘉联益收入与年增率
2013-2014年嘉联益收入客户分布
2012年嘉联益各工厂主要业务
2013年嘉联益大陆子公司简明财务数据
2012年9月-2014年9月旭软每月收入与增幅
旭软各部门简介
2006-2014年安捷利实业收入与毛利率
2006-2014年安捷利实业收入与运营利润
2009-2014年安捷利实业收入业务分布
安捷利主要客户
安捷利FPC技术能力
2011-2014年厦门弘信资产负债
2011-2014年厦门弘信收入与营业利润
2011-2014年厦门弘信销量与ASP
2013-2014年厦门弘信客户分布
2007-2014年SI FLEX收入与运营利润
SI FLEX组织结构
2008-2015财年住友电工收入与运营利润率
2008-2015财年住友电工FPC部门收入统计
2005-2014年大德GDS收入与运营利润率
2010-2014年大德GDS收入业务分布
2005-2014年Interflex收入与运营利润率
2011年1季度-2013年4季度Interflex收入产品分布
2009-2013年Interflex收入客户分布
2009-2012年Interflex产能
2005-2014年 BHflex收入与运营利润
2009-2012年BHflex收入客户分布
2013年BHflex收入客户分布
2009-2012年BHflex收入下游应用分布
2005-2014年Newflex收入与运营利润
2006-2014年FLEXCOM收入与运营利润率
2011年FLEXCOM收入客户分布
2013年1季度-2014年4季度Flexcom季度收入与营业利润
2006-2014年MFS收入与股东应得利润
2008-2013年MFS收入地域分布
毅嘉组织结构
2006-2014年毅嘉收入与运营利润率
2012年10月-2014年10月毅嘉月度收入
2012年1季度-2014年3季度毅嘉FPCB收入与毛利率
2012、2013年ICHIA收入下游分布
2014年ICHIA收入下游分布
臻鼎组织结构
臻鼎全球分布
2008-2014年臻鼎收入与运营利润率
2008-2014年臻鼎收入与毛利率
ZDT 2013-2014 Consolidated Balance Sheet
2012年10月-2014年10月臻鼎月度收入
2006-2014年7月底臻鼎员工数量
2013年臻鼎大陆子公司财务报表
2002-2014年台虹收入与运营利润率
2012年10月-2014年10月台虹科技月度收入与年增率
2008-2014年台虹科技收入业务分布
2009-2012年台虹FCCL产品收入结构
2010年10月-2014年10月新扬科技收入与年增率
2008-2015财年新日本制铁化学收入与运营利润
2006-2015财年新日本制铁化学收入产品分布
2008-2015财年有泽制造所收入与运营利润率
2008-2014财年有泽制造所收入产品分布
2003-2014年律胜科技收入与运营利润率
2012年10月-2014年10月律胜科技收入与年增率
2007-2014年亚洲电材收入与运营利润率
2012年10月-2014年10月亚洲电材月度收入与增幅
亚洲电材组织结构
2014年亚洲电材收入产品分布
2005-2014年达迈科技收入与运营利润率
2012年10月-2014年10月达迈科技每月收入与增幅
2010-2011年达迈科技收入客户分布
2011年全球主要PI厂家市场占有率
2005-2014年INNOX收入与运营利润率
2011-2013年INNOX收入产品分布
INNOX 2012年收入客户分布
FPC Single-side Board Structure
Double-side PCB Structure
Double Access Flexible Circuit
Single+Single Side Structure
Double-layer Board Structure
COF Diagram
Schematic Diagram of Flexible and Rigid PCB
Manufacturing Process of FPCB
Working Principle of Exposure Machine
Film Developing Solution Spray
Etching Solution Spray
Film Stripping Process
FPCB L/S Roadmap
FPCB Market Size, 2007-2015E
FPCB Market Downstream Distribution, 2013\2017E
Global Mobile Shipments, 2007-2015E
Shipment Breakdown of 3G/4G Mobile Phones Worldwide by Region, 2011-2014
Worldwide Mobile Phone Sales to End Users by Vendor, 2013
Worldwide Smartphone Sales to End Users by Vendor, 2013
Worldwide Smartphone Sales to End Users by Operating System, 2013
Shipments of Top 13 Global Smartphone Companies, 2013-2015E
Monthly Shipments of Mobiles Phones in China, Jan.-Sep. 2014
Shipments of Tablet PCs Worldwide, 2011-2016E
Market Share of Major Tablet PC Brands, 2013
Output of Global Tablet PC Companies, 2012-2013
Notebook PC Shipments, 2008-2015E
Shipments of Major Notebook PC ODMs Worldwide, 2010-2013
HDD Shipments, 2009-2015E
Desktop PC Shipments, 2008-2015E
Top 5 Vendors, Worldwide PC Shipments, Fourth Quarter 2013
Top 5 Vendors, Worldwide PC Shipments 2013
Market Size of Touch Screens Worldwide (by Sales), 2010-2016E
Market Size of Touch Screens Worldwide (by Shipment), 2010-2016E
Downstream Distribution of Global Touch Screen Market by Shipment, 2010-2015E
Revenue of Major Global OUT-CELL Touch Screen Vendors, 2010-2013
Operating Margin of Major Global OUT-CELL Touch Screen Vendors, 2012-2013
Shipments of Major Touch Screen Vendors, 2010-2013
Market Share of Samsung’s Mobile Phone Touch Screen Suppliers, 2012-2013
Market Share of Samsung’s Tablet PC Touch Screen Suppliers, 2012-2013
Supply Structure of Nokia’s Major Touch Screen Suppliers, 2012
Supply Structure of LG’s Major Touch Screen Suppliers, 2012
Supply Structure of HTC’s Major Touch Screen Suppliers, 2012
Shipments of Wearable Devices Worldwide, 2012-2020E
Shipments of Wearable Devices in China, 2012-2016E
Market Size of Wearable Devices in China, 2012-2016E
FPCB Industry Chain in Taiwan
Revenue Breakdown of Global FPCB Industry by Region, 2009-2013
Supply Structure of Samsung’s Major FPCB Suppliers by Sales, 2011-2013
Supply Structure of LG’s Major FPCB Suppliers by Sales, 2011
Supply Structure of Apple’s Major FPCB Suppliers by Sales, 2011-2013
Supply Structure of Major iPhone FPCB Suppliers, 2013-2014
Ranking of FPCB Vendors in Japan by Revenue, 2010-2014
Ranking of FPCB Vendors in S. Korea by Revenue, 2012-2014
Ranking of FPCB Vendors in S. Korea by Operating Margin, 2012-2014
Ranking of FPCB Vendors in Taiwan by Revenue, 2010-2014
Ranking of FPC Vendors in Taiwan by Operating Margin, 2009-2014
Ranking of Major FPCB Vendors Worldwide by Revenue, 2010-2014
FUJIKURA’s Bases in Thailand
Revenue and Operating Income of FUJIKURA, FY 2004-FY 2015
Revenue Breakdown of FUJIKURA by Segment, FY 2008-FY 2013
Revenue Breakdown of Fujikura by Product, FY 2013-FY 2015
Operating Income Breakdown of FUJIKURA by Segment, FY 2007-FY 2013
FPC Revenue Breakdown of Fujikura by Product, FY 2008-FY 2015
Revenue and Operating Income of FUJIKURA’s Electronics Division, FY2014-FY2015
Revenue and Operating Income of NOK, FY 2006-FY 2015
Revenue Breakdown of NOK by Product, FY 2006-FY 2015
Revenue Breakdown of NOK by Region, FY2010-FY2015
Revenue Breakdown of MEKTRON by Region, FY 2010-FY 2015
Mektron’s Distribution Worldwide
Revenue and Operating Margin of MEKTEC (Zhuhai), 2008-2014
Revenue and Operating Margin of NITTO DENKO, FY 2005-FY 2015
FPC Revenue and Optronics Operating Income of NITTO DENKO, FY 2009-FY 2015
Revenue and Operating Income of M-FLEX, FY 2004-FY 2014
Monthly Revenue of MFLEX, 3Q12-3Q14
Revenue Breakdown of M-FLEX by Region, FY 2010-FY 2013
Revenue Structure of M-FELX by Country, FY 2006-FY 2013
Operating Income Breakdown of M-FELX by Region, FY 2006-FY 2013
Custom Structure of M-FLEX, FY 2006-FY 2014
Revenue Breakdown of MFLEX by Downstream Sector, 2008Q4-2014Q2
Revenue and Gross Margin of Flexium, 2005-2014
Revenue and Operating Margin of Flexium, 2005-2014
Monthly Revenue and YoY Growth of Flexium, Oct.2012-Oct. 2014
Downstream Application Breakdown of Flexium by Revenue, 2009-2013
Flexium’s FPC Breakdown by Number of Layers, 2009-2013
Relationship between CAREER and Associate Companies
Profile of CAREER’s Segments
Revenue and Operating Margin of CAREER, 2003-2014
Revenue and YoY Growth of CAREER, Oct.2012-Oct. 2014
Revenue Breakdown of CAREER by Customer, 2013-2014
Main Business of CAREER’s Factories, 2012
Brief Financials of CAREER's Subsidiaries in China’s Mainland, 2013
Monthly Revenue and Growth Rate of SUNFLEX, Sep. 2012-Sep. 2014
Profile of all Segments of SUNFLEX
Revenue and Gross Margin of AKM, 2006-2014
Revenue and Operating Income of AKM, 2006-2014
Revenue Breakdown of AKM by Segment, 2009-2014
AKM’s Major Customers
AKMFPC’s Technical Capacity
Assets and Liabilities of Xiamen Hongxin, 2011-2014
Revenue and Operating Income of Xiamen Hongxin, 2011-2014
Sales Volume and ASP of Xiamen Hongxin, 2011-2014
Customer Distribution of Xiamen Hongxin, 2013-2014
Revenue and Operating Income of SI FLEX, 2007-2014
Revenue and Operating Margin of Sumitomo Electric Industries, FY 2008-FY 2015
Revenue of Sumitomo Electric Industries’ FPC Division, FY 2008-FY 2015
Revenue and Operating Margin of GDS, 2005-2014
Revenue Breakdown of GDS by Segment, 2010-2014
Revenue and Operating Margin of Interflex, 2005-2014
Revenue Breakdown of Interflex by Product, 2011Q1-2013Q4
Revenue Breakdown of Interflex by Customer, 2009-2013
Interflex’s Capacity, 2009-2012
Revenue and Operating Income of BHflex, 2005-2014
Revenue Breakdown of BHflex by Customer, 2009-2012
Revenue Breakdown of BHflex by Customer, 2013
Revenue Breakdown of BHflex by Downstream Application, 2009-2012
Revenue and Operating Income of Newflex, 2005-2014
Revenue and Operating Margin of FLEXCOM, 2006-2014
Revenue Breakdown of FLEXCOM by Customer, 2011
Quarterly Revenue and Operating Margin of Flexcom, 2013Q1-2014Q4
Revenue and Profit Attributable to Shareholders of MFS, 2006-2014
Revenue Breakdown of MFS by Region, 2008-2013
Revenue and Operating Margin of Ichia, 2006-2014
Monthly Revenue of Ichia, Oct. 2012-Oct.2014
Revenue and Gross Margin of Ichia’s FPCB, 2012Q1-2014Q3
Revenue Breakdown of ICHIA by Downstream Segment, 2012-2013
Revenue Breakdown of ICHIA by Downstream Segment, 2014
ZDT’s Distribution Worldwide
Revenue and Operating Margin of ZDT, 2008-2014
Revenue and Gross Margin of ZDT, 2008-2014
Consolidated Balance Sheet of ZDT, 2013-2014
Monthly Revenue of ZDT, Oct. 2012-Oct.2014
Number of Employees of ZDT, 2006-end of 2014
Financial Statement of ZDT’s Subsidiaries in Mainland China, 2013
Revenue and Operating Margin of Taiflex, 2002-2014
Monthly Revenue and Growth Rate of Taiflex, Oct. 2012-Oct.2014
Revenue Breakdown of Taiflex by Downstream Segment, 2008-2014
Revenue Structure of Taiflex’s FCCL Product, 2009-2012
Monthly Revenue and Growth Rate of ThinFlex, Oct. 2010-Oct.2014
Revenue and Operating Income of NIPPON STEEL CHEMICAL, FY 2008-FY 2015
Revenue Breakdown of NIPPON STEEL CHEMICAL by Product, FY 2006-FY 2015
Revenue and Operating Margin of Arisawa, FY 2008-FY 2015
Revenue Breakdown of Arisawa by Product, FY 2008-FY 2014
Revenue and Operating Margin of MICROCOSM, 2003-2014
Revenue and Growth Rate of MICROCOSM, Oct. 2012-Oct.2014
Revenue and Operating Margin of AEM, 2007-2014
Monthly Revenue and Growth Rate of AEM, Oct. 2012-Oct.2014
Revenue Breakdown of AEM by Product, 2014
Revenue and Operating Margin of TAIMIDE, 2005-2014
Monthly Revenue and Growth Rate of TAIMIDE, Oct. 2012-Oct.2014
Revenue Breakdown of TAIMIDE by Customer, 2010-2011
Market Share of Major PI Vendors Worldwide, 2011
Revenue and Operating Margin of INNOX, 2005-2014
Revenue Breakdown of INNOX by Product, 2011-2013
Revenue Breakdown of INNOX by Customer, 2012
如果这份报告不能满足您的要求,我们还可以为您定制报告,请 留言说明您的详细需求。
|