|
|
|
报告导航:研究报告—
TMT产业—电子半导体
|
|
2014-2015年全球及中国TFT-LCD行业研究报告 |
 |
字数:2.0万 |
页数:120 |
图表数:158 |
|
中文电子版:8000元 |
中文纸版:4000元 |
中文(电子+纸)版:8500元 |
|
英文电子版:2300美元 |
英文纸版:2500美元 |
英文(电子+纸)版:2600美元 |
|
编号:ZYW189
|
发布日期:2014-11 |
附件:下载 |
 |
|
|
《2014-2015年全球及中国TFT-LCD行业研究报告》包含以下内容:
1、TFT-LCD简介
2、TFT-LCD上游玻璃基板、背光模组、偏光板、驱动IC行业研究
3、TFT-LCD市场与产业分析
4、12家TFT-LCD厂家研究
TFT-LCD行业自2011年陷入低谷,之后在谷底徘徊一年后慢慢回升,预计在2015年初达到巅峰,到2016年进入下一轮漫长的下跌期。在TFT-LCD行业陷入低谷后,各国的TFT-LCD厂家选择了不同的过冬方式,韩国厂家努力开拓OLED领域,以三星最为努力。日本厂家中夏普选择努力转型为中小尺寸面板厂家,用8.5代线生产手机面板,同时大力发展IGZO技术。日立、索尼和东芝则选择合并成立Japan Display(简称JDI),大力发展LTPS技术。台湾厂家则选择发展4K高清技术。中国大陆厂家则在行业低谷期以较低的成本大举推进新生产线的建设。现在来看,中国大陆厂家最成功,其次台湾厂家,再次日本厂家,最后是三星最失败。
韩国厂家选错了方向,OLED并不能取代LCD,OLED属于电流型元件,而LCD是电压型元件,OLED必须配合LTPS技术,这就注定其成本永远无法和LCD抗衡,而电流型元件注定其分辨率难以提升,而LCD在分辨率方面挖掘潜力巨大。同时OLED采用不稳定的化学材料,注定其质量稳定性难以保证,发光效率随时间衰减也是其致命缺点。在中小尺寸领域,日本厂家依靠LTPS和IGZO占据技术制高点,台湾厂家则依靠4K第一次引领全球LCD趋势。
三星过分依赖OLED,其LCD业务日渐滑落,不仅在出货量方面落后台湾鸿海旗下的INNOLUX(群创),预计2014年三星在销售额方面也要落后于INNOLUX。盈利方面三星也陷入困境,三星对中国大陆市场过分乐观,巨资在苏州建成中国第一条外资8.5代线,2014年上半年此生产线巨亏866亿韩元。不仅中国区亏损,三星整体LCD业务也在2014年2季度出现亏损。三星已经透露2015年不会有任何OLED电视新品推出,三星可能退出OLED电视领域。
台湾厂家的经营策略也与日韩厂家不同,台湾厂家主动降低对单一大客户的依赖,业绩波动范围小。而日韩厂家对苹果和三星大客户依赖严重,淡季时大量产能闲置,造成利润下滑。旺季时产能吃紧,无奈放弃一些小客户。因此台湾厂家营业利润率上升最快,而日韩厂家技术一流,产能庞大,但在淡季时易出现亏损或利润大跌。
目前32-42英寸LCD-TV Panel价格已经趋于稳定,在旺季来临之际还能微幅上涨价格,而42-65英寸LCD-TV Panel价格仍然处于下跌趋势当中,因为LG Display、Samsung有两条8.5代线在2014年上半年投产。预计2015年CSOT(华星光电)的第二条8.5代线,重庆BOE的第二条8.5代线,CEC-Panda的第一条8.5代线,这三条8.5代线都是瞄准46-65英寸电视机市场,投产初期,产量不高,不会对市场造成太大压力。2015年中国大陆将有5条8.5代线。
需求方面,随着中国日益步入老龄化社会,经济增幅放缓,电视需求量下滑是毫无疑问的,2015年下半年市场会陷入严重的供过于求,价格战不可避免。这些新生产线固定成本高,折旧费用高,将严重侵蚀厂家的利润。
Global and China TFT-LCD Industry Report, 2014-2015 contains the following aspects:
1, Introduction to TFT-LCD
2, Research on TFT-LCD upstream industries (glass substrate, backlight module, polarizer, driver IC)
3, Analysis on TFT-LCD market and industry
4, Study on 12 TFT-LCD vendors
The TFT-LCD industry touched the bottom in 2011, then has warmed up slowly since 2012 and is expected to reach its peak in early 2015, but it will fall into another lengthy decline stage by 2016. After the TFT-LCD industry slumped, TFT-LCD vendors in different countries chose varying countermeasures. South Korean vendors represented by Samsung strived to explore the OLED field. In Japan, Sharp transferred to be a small and medium-sized panel vendor, produced mobile phone panels with 8.5-generation lines and vigorously developed IGZO technology. Hitachi, Sony and Toshiba set up a joint venture ------ Japan Display (referred to as JDI) to develop LTPS technology. Taiwanese vendors developed 4K HD technology. Chinese mainland vendors promoted the construction of new production lines at low costs aggressively. As a result, Chinese mainland vendors are the most notable winners, followed by Taiwanese and Japanese counterparts, while Samsung is the biggest loser.
South Korean vendors chose the wrong direction, because the current-based OLED can not replace the voltage-based LCD due to following factors. Firstly, OLED requires LTPS technology, which means its cost is much higher than LCD. Secondly, the resolution of current-based components is difficult to raise, but LCD has huge potentials in terms of resolution. Thirdly, OLED’s quality is not steady for its employment of unstable chemical materials, and its luminous efficiency decays as time goes by, which is another fatal flaw. In the small and medium-sized field, Japanese vendors make advantage of LTPS and IGZO to occupy technical high grounds, and Taiwanese vendors lead the global LCD trend with 4K for the first time.
Samsung shows over-reliance on OLED, and its LCD business has gradually crept down. It not only lags behind INNOLUX under Taiwan's Hon Hai in shipment, but also will drop behind INNOLUX in terms of revenue in 2014. As for profitability, Samsung gets into trouble as well. Being overly optimistic on the Chinese mainland market, Samsung invested heavily in China's first foreign-funded 8.5-generation line in Suzhou. However, the production line brought the huge loss of KRW86.6 billion in the first half of 2014. Besides China, Samsung also witnessed loss in its overall LCD business in Q2 2014. Samsung has revealed that it will not launch any new OLED TV, even it may quit the OLED TV field in 2015.
Unlike Japanese and South Korean vendors who represent excess dependence on large customers such as Apple and Samsung, Taiwanese vendors take the initiative to reduce dependence on a single large customer. Therefore, the performance of Taiwanese vendors fluctuates slightly and their operating margin ascends faster, whereas Japanese and South Korean vendors who master first-class technology see falling profit owing to the considerable idle capacity during low seasons but have to give up some small customers in busy seasons.
Currently, the prices of 32 to 42-inch LCD-TV panels have stabilized and tend to rise marginally before the peak season, while the prices of 42 to 65-inch LCD-TV panels follow the downward trend as LG Display and Samsung put two 8.5-generation lines into operation in the first half of 2014. In 2015, CSOT’s second 8.5-generation line, Chongqing BOE’s second 8.5-generation line and CEC-Panda's first 8.5-generation line will target at the 46 to 65-inch TV market, but the output will not be high in the initial stage, so they will not influence the market significantly. On the whole, China will have five 8.5-generation lines in 2015.
As China enters the aging society increasingly, the economic growth has slowed down. In this case, the TV demand will drop down undoubtedly, and serious oversupply will arise in the second half of 2015, leading to the inevitable price war. High fixed costs and depreciation charges of new production lines will seriously erode the profits of vendors.

第一章、TFT-LCD简介
1.1、TFT-LCD结构
1.2、TFT-LCD生产流程
1.3、LTPS
1.4、LGZO与LTPS竞争分析
1.5、TFT-LCD成本结构
第二章、TFT-LCD产业链
2.1、TFT-LCD 玻璃基板简介
2.2、TFT-LCD 玻璃基板产业分析
2.3、康宁
2.4、东旭光电
2.5、背光模组简介
2.6、背光模组成本结构
2.7、Open-cell与Hinge-Up
2.8、背光模组产业
2.9、瑞仪光电
2.10、中强光电
2.11、LCD驱动IC市场
2.12、LCD驱动IC产业
2.13、联咏
2.14、偏光板简介Polarizer
2.15、偏光板市场
2.16、偏光板产业分析
第三章、LCD市场与产业
3.1、全球手机市场
3.2、全球智能手机市场
3.3、中国手机市场
3.4、平板电脑市场
3.5、笔记本电脑市场
3.6、台式机市场
3.7、高清(HD)与超高清(UHD)视频设备
3.8、LCD-TV市场
3.9、LCD-TV面板产业
3.10、TFT-LCD产业近况
3.11、TFT-LCD Panel价格走势
3.12、TFT-LCD产业排名
第四章、主要TFT-LCD厂家研究
4.1、友达
4.2、群创
4.3、LG Display
4.4、中电熊猫液晶显示科技
4.5、京东方
4.6、深圳华星光电CSOT
4.7、夏普
4.8、三星显示器件
4.9、中华映管
4.10、瀚宇彩晶
4.11、天马微电子
4.12、Japan Display
1 Introduction to TFT-LCD
1.1 TFT-LCD Structure
1.2 TFT-LCD Production Process
1.3 LTPS
1.4 Competition Analysis between LGZO and LTPS
1.5 TFT-LCD Cost Structure
2 TFT-LCD Industry Chain
2.1 Introduction to TFT-LCD Glass Substrate
2.2 TFT-LCD Glass Substrate Industry
2.3 Corning
2.4 Dongxu Optoelectronic
2.5 Introduction to Backlight Module
2.6 Backlight Module Cost Structure
2.7 Open-cell and Hinge-Up
2.8 Backlight Module Industry
2.9 Radiant Opto-Electronics
2.10 Coretronic
2.11 LCD Driver IC Market
2.12 LCD Driver IC Industry
2.13 Novatek
2.14 Introduction to Polarizer
2.15 Polarizer Market
2.16 Polarizer Industry
3 LCD Market and Industry
3.1 Global Mobile Phone Market
3.2 Global Smartphone Market
3.3 Chinese Mobile Phone Market
3.4 Tablet PC Market
3.5 Laptop Computer Market
3.6 Desktop PC Market
3.7 HD and UHD Video Equipment
3.8 LCD-TV Market
3.9 LCD-TV Panel Industry
3.10 Status Quo of TFT-LCD Industry
3.11 TFT-LCD Panel Price
3.12 Ranking in TFT-LCD Industry
4 Major TFT-LCD Vendors
4.1 AUO
4.2 Innolux
4.3 LG Display
4.4 CEC Panda LCD Technology
4.5 BOE
4.6 CSOT
4.7 Sharp
4.8 Samsung Display
4.9 CPT
4.10 HannStar Display
4.11 Tianma Microelectronics
4.12 Japan Display
TFT-LCD结构
彩色滤光片生产工艺
TFT 生产工艺
LCD生产工艺
2014-2016 IGZO产能厂家分布
全球IGZO(Oxide)生产线一览
2010-2011年全球LCD 玻璃基板需求量
2010-2011年全球LCD 玻璃基板市场规模
2014年全球TFT-LCD 玻璃基板主要厂家市场占有率
全球TFT-LCD 玻璃基板主要厂家出货量尺寸分布
2008-2014年Corning收入与毛利率
2009-2014年Corning TFT-LCD Glass Substrate 收入与净利润
2008-2014年东旭光电收入与营业利润
东旭光电生产线List
笔记本电脑显示面板用背光模组结构
电脑显示器面板背光模组结构
电视面板背光模组结构
13.3英寸LED笔记本电脑显示面板用背光模组成本结构
18.5英寸LED电脑显示器面板背光模组结构
42英寸LED电视面板背光模组成本结构
hinge up 组织模式下的笔记本机壳供应链管理(SCM)
hinge up 模式下的BLU
2006-2012年Open-cell出货比例
2012年全球主要背光模组厂家市场占有率(按收入)
BLU-VS-PANEL MAKER关系
2010-2012年全球主要背光模组厂家运营利润率
2010-2012年全球主要背光模组厂家收入
Radiant Opto-Electronics组织结构
2008-2014年瑞仪收入与毛利率
2012年10月-2014年10月瑞仪月度收入
瑞仪生产基地分布
2012年瑞仪产能工厂分布
2012-2014年瑞仪收入产品分布
2012-2014年瑞仪收入客户分布
2012-2014年瑞仪NB/Tablet PC BLU 月度出货量
2012-2014年瑞仪Monitor BLU 月度出货量
2012-2014年瑞仪Tv BLU 月度出货量
2006-2014年中强光电收入与运营利润率
2012年10月-2014年10月中强光电月度收入
2010-2014年中强光电收入业务分布
3Q/13-3Q/14 中强光电季度BLU出货量下游分布
3Q/13-3Q/14 中强光电季度BLU收入下游分布
2009-2016年全球显示驱动IC市场规模
2009-2014年全球显示驱动IC市场规模类型分布
LCD驱动IC产业链
2014年大尺寸TFT-LCD 驱动IC主要厂家市场占有率
2014年中小尺寸 TFT-LCD 驱动IC主要厂家市场占有率
2010-2013年全球主要驱动IC厂家收入排名
Novatek 组织结构
2006-2014年联咏收入与运营利润率
2012年10月-2014年10月联咏月度收入
201-2015年联咏电视驱动IC出货量
Q1/13-Q4/14联咏季度收入产品分布
2011-2017年偏光板市场规模
2013-2018年偏光板市场技术分布
2014年TV用偏光板主要厂家市场占有率
2014年Notebook PC用偏光板厂家市场占有率
2014年TabletPC用偏光板厂家市场占有率
2014年Monitor用偏光板厂家市场占有率
2007-2015年全球手机出货量
2011-2014年全球3G/4G手机出货量地域分布
Worldwide Mobile Phone Sales to End Users by Vendor in 2013 (Thousands of Units)
Worldwide Smartphone Sales to End Users by Vendor in 2013 (Thousands of Units)
Worldwide Smartphone Sales to End Users by Operating System in 2013 (Thousands of Units)
2013-2015年全球Top 13智能手机厂家出货量
2014年1-8月中国手机月度出货量
2011-2016年全球平板电脑出货量
2013年平板电脑主要品牌市场占有率
2012、2013年全球平板电脑制造厂家产量
2008-2015年笔记本电脑出货量
2010-2013年全球主要笔记本电脑ODM厂家出货量
2008-2015年Desktop PC出货量
Top 5 Vendors, Worldwide PC Shipments, Fourth Quarter 2013
Top 5 Vendors, Worldwide PC Shipments 2013
2012-2016 HDTV与UHDTV出货量
2012-2018年LCD-TV出货量
2014年上半年全球LCD-TV主要厂家市场占有率
2014年上半年中国LCD-TV主要厂家市场占有率
2014-2015年LCD-TV出货量尺寸分布
2010-2014年全球电视用TFTLCD面板主要厂家市场占有率
2010-2014年中国电视用TFTLCD面板主要厂家市场占有率
2013-2014中国32英寸电视用面板主要厂家市场占有率
2013年9月-2014年9月TFT LCD月度收入及增长率
2013年9月-2014年9月LCD-TV面板月度出货量及增长率
2013年9月-2014年9月Monitor月度出货量及增长率
2013年9月-2014年9月Notebook PC面板月度出货量及增长率
2013年9月-2014年9月Tablet PC 面板月度出货量及增长率
2013年5月-2014年9月32、39、42、46英寸LCD-TV Panel月度价格走势
2012年1月-2014年7月15.6、17.3、18.5、21.5英寸LCD Panel月度价格走势
2014年2季度全球主要TFT-LCD大尺寸面板出货量市场占有率
2002-2013年全球主要TFT-LCD大尺寸面板厂家营业利润率
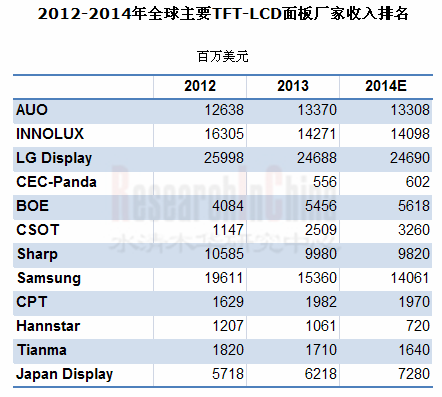
2012-2014年全球主要TFT-LCD面板厂家收入排名
2012-2014年全球主要TFT-LCD面板厂家营业利润率
AUO组织结构
2009-2014年AUO收入与毛利率
2012、2013年AUO收入地域分布
2012、2013年AUO收入下游分布
2012、2013年AUO出货量下游分布
关键原材料供应商
3Q13-3Q14 AUO Display下游应用收入分布
3Q13-3Q14 AUO Display产品尺寸收入分布
3Q13-3Q14 AUO出货量及均价
3Q13-3Q14 AUO 中小尺寸面板出货量(按尺寸及收入)
友达各生产线
友达LCM基地
INNOLUX组织结构
2010-2014年INNOLUX收入与营业利润率
4Q12-3Q14 INNOLUX收入,毛利率及 EBITDA Margin
4Q12-3Q14 INNOLUX 总负债及负债率
4Q12-3Q14 INNOLUX库存变化趋势
4Q12-3Q14 INNOLUX出货量及TFT LCD 价格走势
4Q12-3Q14 INNOLUX 中小尺寸出货量及销售走势
4Q12-3Q14 INNOLUX 下游应用收入分布
4Q12-3Q14 INNOLUX产品尺寸收入分布
INNOLUX TFT-LCD厂简介
触控传感器厂简介
2009-2015年LG Display收入与营业利润率
1Q13-3Q14 LG Display季度收入与毛利率
2012-2014 LG DISPLAY IFRS 财务数据
2009-2013 LG DISPLAY 出货量下游分布
2009-2013 LG DISPLAY 收入下游分布
2011-2013 LG DISPLAY 收入地域分布
Q3/13-Q3/14 LG Display 季度出货量及均价
Q3/13-Q3/14 LG Display季度下游应用收入分布
Q3/13-Q3/14 LG Display 季度产量
LG Display Fabs Capacity List
2011-2013 LG Display Fabs产能
LG Display 分布
LG Display 生产基地分布
南京中电熊猫液晶显示科技组织结构
2013南京中电熊猫液晶显示科技原材料采购额
2013南京中电熊猫液晶显示科技原材料供应商
2013南京中电熊猫液晶显示科技五大客户
2008-2014年BOE收入与营业利润
BOE MILESTONE
BOE生产基地分布
1Q/10-3Q/14 BOE 季度收入
2013年BOE主要子公司简明财务
FY2008-FY2015 SHARP 收入与营业利润率
FY2013-FY2015 SHARP收入业务分布
FY2013-FY2015 SHARP 各项业务营业利润率
2013-2014夏普手机面板分辨率
夏普生产线一览
2010-2015年三星DP事业部收入与营业利润率
2012-2015年三星Dp事业部收入产品分布
2012-2015年三星Dp事业部收入营业利润分布
三星生产线一览
2007-2014 CPT收入与营业利润率
CPT生产线一览
2006-2014年彩晶收入与营业利润率
彩晶基地分布
2005-2014年深圳天马微电子收入与运营利润率
天马微电子组织结构
天马生产线一览
天马各子公司2012-2013年产能、产量与产能利用率
2012-2013年天马客户分布
天马生产线产能
The JDI Group in Transition
2012年10月-2014年10月中日新月度收入
Structure of TFT-LCD
Color Filter Production Process
TFT Production Process
LCD Production Process
Capacity Distribution of IGZO Vendors, 2014-2016E
Global IGZO (Oxide) Production Lines
Global LCD Glass Substrate Demand, 2010-2011
Global LCD Glass Substrate Market Size, 2010-2011
Market Share of Global Major TFT-LCD Glass Substrate Vendors, 2014
Shipment of Global Major TFT-LCD Glass Substrate Vendors by Size
Corning’s Revenue and Gross Margin, 2008-2014
Corning’s TFT-LCD Glass Substrate Revenue and Net Income, 2009-2014
Revenue and Operating Profit of Dongxu Optoelectronic, 2008-2014
Production Lines of Dongxu Optoelectronic
Laptop Computer Display Panel-use Backlight Module Structure
Computer Display Panel Backlight Module Structure
TV Panel Backlight Module Structure
Cost Structure of Backlight Module for 13.3-inch LED Laptop Computer Display Panel
Cost Structure of Backlight Module for 18.5-inch LED Computer Display Panel
Cost Structure of Backlight Module for 42-inch LED TV Panel
Laptop Computer Case Supply Chain Management (SCM) under Hinge-up Mode
BLU under Hinge-up Mode
Open-cell Shipment Proportion, 2006-2012
Market Share of Global Major Backlight Module Vendors (by Revenue), 2012
Relationship between BLU-VS-Panel Makers
Revenue and Operating Margin of Global Major Backlight Module Vendors, 2010-2012
Revenue of Global Major Backlight Module Vendors, 2010-2012
Organization of Radiant Opto-Electronics
Revenue and Gross Margin of Radiant Opto-Electronics, 2008-2014
Monthly Revenue of Radiant Opto-Electronics, Oct 2012-Oct 2014
Production Base Distribution of Radiant Opto-Electronics
Capacity of Radiant Opto-Electronics by Factory 2012
Revenue of Radiant Opto-Electronics by Product, 2012-2014
Revenue of Radiant Opto-Electronics by Customer, 2012-2014
NB/Tablet PC BLU Monthly Shipment of Radiant Opto-Electronics, 2012-2014
Monitor BLU Monthly Shipment of Radiant Opto-Electronics, 2012-2014
TV BLU Monthly Shipment of Radiant Opto-Electronics, 2012-2014
Coretronic’s Revenue and Operating Margin, 2006-2014
Coretronic’s Monthly Revenue, Oct 2012-Oct 2014
Coretronic’s Revenue by Business, 2010-2014
Coretronic’s Quarterly BLU Shipment by Application, Q3 2013- Q3 2014
Coretronic’s Quarterly BLU Revenue by Application, Q3 2013- Q3 2014
Global Display Driver IC Market Size, 2009-2016E
Global Display Driver IC Market Size by Type, 2009-2014
LCD Driver IC Industry Chain
Market Share of Major Large Area TFT-LCD Driver IC Vendors, 2014
Market Share of Major Small-Medium Area TFT-LCD Driver IC Vendors, 2014
Ranking of Global Major Driver IC Vendors by Revenue, 2010-2013
Novatek Organization Chart
Novatek’s Revenue and Operating Margin, 2006-2014
Novatek’s Monthly Revenue, Oct 2012-Oct 2014
Novatek’s TV Driver IC Shipment, 201-2015E
Novatek’s Quarterly Revenue by Product, Q1 2013-Q4 2014
Polarizer Market Size, 2011-2017E
Polarizer Market by Technology, 2013-2018E
Market Share of Major TV-use Polarizer Vendors, 2014
Market Share of Laptop-use Polarizer Vendors, 2014
Market Share of Tablet PC-use Polarizer Vendors, 2014
Market Share of Monitor-use Polarizer Vendors, 2014
Global Mobile Phone Shipment, 2007-2015E
Global 3G / 4G Mobile Phone Shipment by Region, 2011-2014
Worldwide Mobile Phone Sales to End Users by Vendor in 2013 (Thousands of Units)
Worldwide Smartphone Sales to End Users by Vendor in 2013 (Thousands of Units)
Worldwide Smartphone Sales to End Users by Operating System in 2013 (Thousands of Units)
Shipment of Global Top 13 Smartphone Vendors, 2013-2015E
China’s Mobile Phone Monthly Shipment, Jan-Aug 2014
Global Tablet PC Shipment, 2011-2016E
Market Share of Major Tablet PC Brands, 2013
Output of Global Tablet PC Companies, 2012-2013
Laptop Computer Shipment, 2008-2015E
Shipment of Global Major Laptop ODMs, 2010-2013
Desktop PC Shipment, 2008-2015E
PC Shipment of Top 5 Vendors Worldwide, Q4 2013
PC Shipment of Top 5 Vendors Worldwide, 2013
HDTV and UHDTV Shipment, 2012-2016E
LCD-TV Shipment, 2012-2018E
Market Share of Global Major LCD-TV Vendors, H1 2014
Market Share of Major LCD-TV Vendors in China, H1 2014
LCD-TV Shipment by Size, 2014-2015E
Market Share of Global Major TV-use TFT-LCD Panel Vendors, 2010-2014
Market Share of Major TV-use TFT- LCD Panel Vendors in China, 2010-2014
Market Share of Major 32-inch TV-use Panel Vendors in China, 2013-2014
Monthly Total TFT -LCD Revenue and Growth, Sep 2013-Sep 2014
Monthly LCD-TV Panel Unit Shipment and Growth, Sep 2013-Sep 2014
Monthly Monitor Panel Unit Shipment and Growth, Sep 2013-Sep 2014
Monthly Laptop Panel Unit Shipment and Growth, Sep 2013-Sep 2014
Monthly Tablet PC Panel Unit Shipment and Growth, Sep 2013-Sep 2014
Monthly Price Trend of 32-, 39-, 42-, 46-inch LCD-TV Panel, May 2013-Sep 2014
Monthly Price Trend of 15.6-, 17.3-, 18.5-, 21.5-inch LCD Panel, Jan 2012-Jul 2014
Shipment and Market Share of Global Major Large-sized TFT-LCD Panel Vendors, Q2 2014
Operating Margin of Global Major Large-sized TFT-LCD Panel Vendors, 2002-2013
Ranking of Global Major TFT-LCD Panel Vendors by Revenue, 2012-2014
Operating Margin of Global Major TFT-LCD Panel Vendors, 2012-2014
AUO’s Revenue and Gross Margin, 2009-2014
AUO’s Revenue by Region, 2012-2013
AUO’s Revenue by Application, 2012-2013
AUO’s Shipment by Application, 2012-2013
Suppliers of Key Raw Materials and Components
AUO’s Display Revenue Breakdown by Application, Q3 2013-Q3 2014
AUO’s Display Revenue Breakdown by Size, Q3 2013-Q3 2014
AUO’s Shipment and ASP, Q3 2013-Q3 2014
AUO’s Small & Medium Panel Shipment by Area and Revenue, Q3 2013-Q3 2014
AUO’s Production Lines
AUO’s LCM Bases
INNOLUX’s Revenue and Operating Margin, 2010-2014
INNOLUX’s Revenue, Gross Margin, EBITDA Margin, Q4 2012-Q3 2014
INNOLUX’s Total Debt and Debt Ratio, Q4 2012-Q3 2014
INNOLUX’s Inventory, Q4 2012-Q3 2014
INNOLUX’s Regional Shipment and TFT LCD ASP, Q4 2012-Q3 2014
INNOLUX’s Small & Medium Size Unit Shipment and Sales, Q4 2012-Q3 2014
INNOLUX’s Sales Breakdown by Application, Q4 2012-Q3 2014
INNOLUX’s Sales Breakdown by Size, Q4 2012-Q3 2014
Profile of INNOLUX’s TFT-LCD Fabs
Profile of Touch Sensor Fabs
Revenue and Operating Margin of LG Display, 2009-2015E
Quarterly Revenue and Gross Margin of LG Display, Q1 2013-Q3 2014
IFRS Statements of Financial Position of LG Display, 2012-2014
Shipment of LG Display by Application, 2009-2013
Revenue of LG Display by Application, 2009-2013
Revenue of LG Display by Region, 2011-2013
Quarterly Shipment and ASP of LG Display, Q3 2013-Q3 2014
Quarterly Revenue by Application of LG Display, Q3 2013-Q3 2014
Quarterly Production of LG Display by Region, Q3 2013-Q3 2014
Capacity of LG Display’s Fabs
Capacity of LG Display’s Fabs, 2011-2013
Footprint of LG Display
Manufacturing Bases of LG Display
Raw Material Procurement of Nanjing CEC Panda LCD Technology, 2013
Raw Material Suppliers of Nanjing CEC Panda LCD Technology, 2013
Top Five Customers of Nanjing CEC Panda LCD Technology, 2013
BOE's Revenue and Operating Profit, 2008-2014
BOE's MILESTONE
BOE's Manufacturing Bases
BOE's Quarterly Revenue, Q1 2010-Q3 2014
Financial Summary of BOE's Major Subsidiaries, 2013
Sharp’s Revenue and Operating Margin, FY2008-FY2015
Sharp’s Revenue by Business, FY2013-FY2015
Sharp’s Operating Margin by Business, FY2013-FY2015
Sharp’s Mobile Phone Panel Resolution, 2013-2014
Sharp’s Production Lines
Revenue and Operating Margin of Samsung’s DP Division, 2010-2015E
Revenue of Samsung’s DP Division by Product, 2012-2015E
Revenue and Operating Profit of Samsung’s DP Division, 2012-2015E
Samsung’s Production Lines
CPT’s Revenue and Operating Margin, 2007-2014
CPT’s Production Lines
Revenue and Operating Margin of HannStar Display, 2006-2014
Base Distribution of HannStar Display
Revenue and Operating Margin of Tianma Microelectronics, 2005-2014
Production Lines of Tianma Microelectronics
Capacity, Output and Capacity Utilization of Subsidiaries of Tianma Microelectronics, 2012-2013
Customer Distribution of Tianma Microelectronics, 2012-2013
Capacity of Production Lines of Tianma Microelectronics
The JDI Group in Transition
Monthly Revenue of Star World Technology, Oct 2012-Oct 2014
如果这份报告不能满足您的要求,我们还可以为您定制报告,请 留言说明您的详细需求。
|