|
|
|
报告导航:研究报告—
制造业—能源矿产
|
|
2014-2017年全球及中国钒金属行业研究报告 |
 |
字数:1.9万 |
页数:84 |
图表数:105 |
|
中文电子版:7000元 |
中文纸版:3500元 |
中文(电子+纸)版:7500元 |
|
英文电子版:1900美元 |
英文纸版:2000美元 |
英文(电子+纸)版:2200美元 |
|
编号:LT-027
|
发布日期:2014-11 |
附件:下载 |
 |
|
|
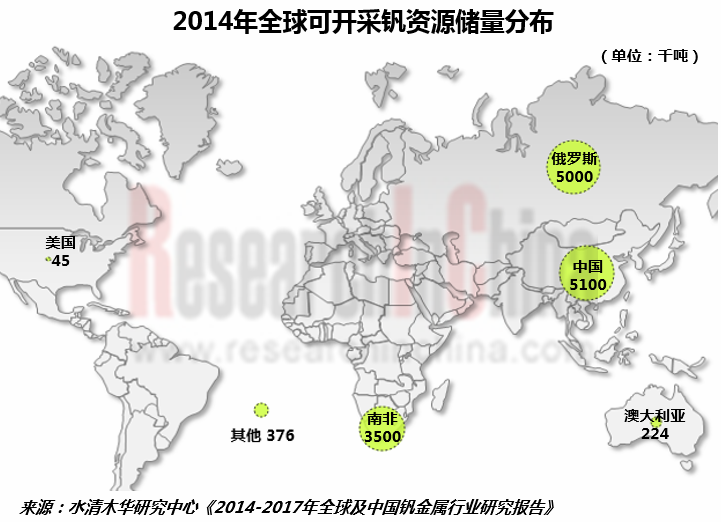
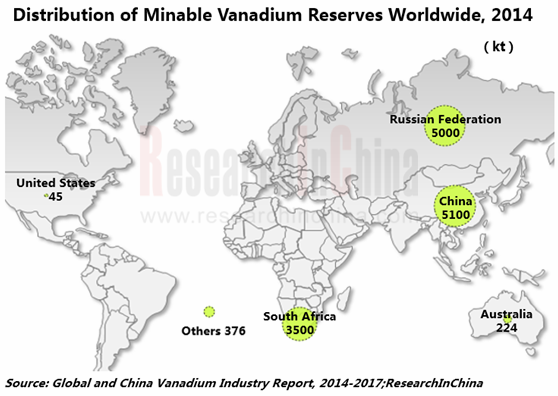
目前全球可开采钒资源储量为1400万吨,主要分布于中国、俄罗斯及南非等国家。2013年全球钒(折V2O5)产量总计约15.1万吨,同比增长11%。2001-2013年,全球钒消费量稳定增长,年均增速达到6.7%。钢铁是钒消费最大的行业,占2013年全球钒消费量9成以上,其次为钒钛合金及化工行业。
中国是全球最大的产钒国,2013年中国钒(折V2O5)产量约占全球57%,产能10万吨以上。同时,中国也是全球钒产品消费增长最快、消费量最大的国家。2001-2013年中国钒产品(折V2O5)消费量从 0.53万吨增至5.7万吨,年均增速约22%。中国钒消费量的快速增长主要得益于含钒高强度III级和IV级螺纹钢筋的推广使用。
中国钒产业集中度较高。早期西宁特钢、海亮股份及鼎立股份等投资的钒矿大部分仍未进入实质生产阶段,主要的钒产能仍掌握在攀钢钒钛、河北钢铁等部分钢铁大厂手中。
攀钢钒钛是中国最大的产钒企业。目前公司具备钒制品(以V2O5计)2万吨的生产能力,且是中国唯一的高钒铁(FeV80)生产企业。2014上半年公司钒产品实现营业收入16.1亿元,同比减少4.8%。
河北钢铁是中国最大的钒钛生产基地之一。目前公司拥有6条钒氮合金生产线,产品远销10多个国家和地区,约占全球钒市场8%的份额。2014上半年公司钒产品实现营业收入3.88亿元,同比增长2.4%。
水清木华研究中心《2014-2017年全球及中国钒金属行业研究报告》着重研究了以下内容:
● 全球钒矿资源、钒制品产量及需求规模、价格趋势等;
● 中国钒矿资源、钒制品供需、价格趋势及进出口等;
● 全球4家钒制品生产商(ATLANTIC LTD、Highveld Steel and Vanadium、Evraz及Vanadium Corp)运营情况及钒业务分析等;
● 中国8家钒制品重点企业(包括攀钢钒钛、河北钢铁、西宁特钢等)经营情况及钒业务分析等。
The world’s recoverable vanadium reserves so far has been recorded at 14 million tons, mainly found in China, Russia, South Africa and other countries. In 2013, roughly 151,000 tons of vanadium (V2O5 Equivalent) was produced worldwide, up 11% year on year. The global vanadium consumption increased at an AAGR of 6.7% during the period 2001-2013, of which, the iron and steel industry as the biggest consumer accounted for more than 90% in 2013, followed by vanadium-titanium alloy and chemical industry.
China, the world’s largest vanadium-producing country with a capacity of over 100 kt/a, contributed 57% to the world’s vanadium (V2O5 Equivalent) production in 2013. It also has the fastest-growing and highest consumption of vanadium products in the world, with vanadium (V2O5 Equivalent) consumption rising from 5.3 kilotons to 57 kilotons in 2001-2013 (an AAGR of 22% or so) as a result of promotion and use of vanadium-containing high-strength deformed steel bars grade III and grade IV.
China’s vanadium industry is highly concentrated in Pangang Group Vanadium Titanium & Resources Co., Ltd., Hebei Iron & Steel Group Co., Ltd. and other big steelmakers since most of the early vanadium ore investors such as Xining Special Steel Co., Ltd., Zhejiang Hailiang Co., Ltd. and Shanghai Dingli Technology Development (Group) Co., Ltd. haven’t entered substantial production yet.
Pangang Group Vanadium Titanium & Resources as China’s largest vanadium production enterprise now boasts a production capacity of 20 kt/a vanadium product (V2O5 Equivalent). Besides, it is the only high-vanadium ferroalloy (FeV80) manufacturer there. In the first half of 2014, the company’s vanadium products reaped RMB1.61 billion in revenue, down 4.8% year on year.
Hebei Iron & Steel is one of the largest vanadium-titanium production bases in China. It now has six vanadium-nitrogen alloy production lines, with products exported to more than 10 countries and regions, representing an approximately 8% share in global vanadium market. The company’s revenue from vanadium products in the first half of 2014 was RMB388 million, up 2.4% year on year.
Global and China Vanadium Industry Report, 2014-2017 by ResearchInChina focuses on the followings:
 Vanadium ore resources and output, demand and price of vanadium products in the world; Vanadium ore resources and output, demand and price of vanadium products in the world;
Vanadium ore resources and supply & demand, price, import & export of vanadium products in China;
Profile, operation, vanadium business and others of four global manufacturers of vanadium products (Atlantic Ltd, Highveld Steel and Vanadium Corporation, EVRAZ and Vanadium Corp);
Profile, operation, vanadium business and others of eight Chinese manufacturers of vanadium products (such as Pangang Group Vanadium Titanium & Resources, Hebei Iron & Steel, Xining Special Steel, and so on).
第一章 钒金属简介
1.1定义
1.2产业链
第二章 全球钒市场分析
2.1 钒矿资源
2.2 供给
2.3 需求
2.4 价格
第三章 中国钒市场分析
3.1 钒矿资源
3.2 供给
3.3 需求
3.4 价格
3.5 进出口
第四章 全球主要钒生产企业分析
4.1 ATLANTIC LTD
4.1.1 企业简介
4.1.2 运营情况
4.1.3 钒业务
4.2 Highveld Steel and Vanadium
4.2.1 企业简介
4.2.2 运营情况
4.2.3 营收构成
4.2.4 钒业务
4.3 Evraz
4.3.1 企业简介
4.3.2 运营情况
4.3.3 营收构成
4.3.4 钒业务
4.4 VanadiumCorp
4.4.1 企业简介
4.4.2 钒业务
第五章 中国钒重点生产企业分析
5.1 攀钢钒钛
5.1.1 企业简介
5.1.2 经营情况
5.1.3 营收构成
5.1.4 毛利率
5.1.5 客户与供应商
5.1.6 钒业务
5.1.7 发展前景
5.2 西宁特钢
5.2.1 企业简介
5.2.2 经营情况
5.2.3 营收构成
5.2.4 毛利率
5.2.5 客户与供应商
5.2.6 钒业务
5.2.7 发展前景
5.3 河北钢铁
5.3.1 企业简介
5.3.2 经营情况
5.3.3 营收构成
5.3.4 毛利率
5.3.5 客户与供应商
5.3.6 钒业务
5.3.7 发展前景
5.4 博信股份
5.4.1 企业简介
5.4.2 运营情况
5.4.3 营收构成
5.4.4 毛利率
5.4.5 客户与供应商
5.4.6 钒业务
5.4.7 发展前景
5.5 鼎立股份
5.5.1 企业简介
5.5.2 运营情况
5.5.3 营收构成
5.5.4 毛利率
5.5.5 客户与供应商
5.5.6 钒业务
5.5.7 发展前景
5.6 明星电力
5.6.1 企业简介
5.6.2 运营情况
5.6.3 营收构成
5.6.4 毛利率
5.6.5 客户与供应商
5.6.6 钒业务
5.6.7 发展前景
5.7 天兴仪表
5.7.1 企业简介
5.7.2 运营情况
5.7.3 营收构成
5.7.4 毛利率
5.7.5 客户与供应商
5.7.6 钒业务
5.7.7 发展前景
5.8 海亮股份
5.8.1 企业简介
5.8.2 运营情况
5.8.3 营收构成
5.8.4 毛利率
5.8.5 客户与供应商
5.8.6 钒业务
5.8.7 发展前景
第六章 总结与预测
6.1 总结
6.2预测
1. Introduction to Vanadium
1.1 Definition
1.2 Industry Chain
2. Global Vanadium Market
2.1 Vanadium Ore Resources
2.2 Supply
2.3 Demand
2.4 Price
3. China Vanadium Market
3.1 Vanadium Ore Resources
3.2 Supply
3.3 Demand
3.4 Price
3.5 Import and Export
4. Major Vanadium Manufacturers in the World
4.1 Atlantic Ltd
4.1.1 Profile
4.1.2 Operation
4.1.3 Vanadium Business
4.2 Highveld Steel and Vanadium Corporation
4.2.1 Profile
4.2.2 Operation
4.2.3 Revenue Structure
4.2.4 Vanadium Business
4.3 Evraz
4.3.1 Profile
4.3.2 Operation
4.3.3 Revenue Structure
4.3.4 Vanadium Business
4.4 American Vanadium Corp
4.4.1 Profile
4.4.2 Vanadium Business
5. Major Vanadium Manufacturers in China
5.1 Pangang Group Vanadium Titanium & Resources
5.1.1 Profile
5.1.2 Operation
5.1.3 Revenue Structure
5.1.4 Gross Margin
5.1.5 Clients and Suppliers
5.1.6 Vanadium Business
5.1.7 Prospects
5.2 Xining Special Steel
5.2.1 Profile
5.2.2 Operation
5.2.3 Revenue Structure
5.2.4 Gross Margin
5.2.5 Clients and Suppliers
5.2.6 Vanadium Business
5.2.7 Prospects
5.3 Hebei Iron & Steel
5.3.1 Profile
5.3.2 Operation
5.3.3 Revenue Structure
5.3.4 Gross Margin
5.3.5 Clients and Suppliers
5.3.6 Vanadium Business
5.3.7 Prospects
5.4 Guangdong Boxin Investing & Holdings
5.4.1 Profile
5.4.2 Operation
5.4.3 Revenue Structure
5.4.4 Gross Margin
5.4.5 Clients and Suppliers
5.4.6 Vanadium Business
5.4.7 Prospects
5.5 Shanghai Dingli Technology Development
5.5.1 Profile
5.5.2 Operation
5.5.3 Revenue Structure
5.5.4 Gross Margin
5.5.5 Clients and Suppliers
5.5.6 Vanadium Business
5.5.7 Prospects
5.6 Sichuan Mingxing Electric Power
5.6.1 Profile
5.6.2 Operation
5.6.3 Revenue Structure
5.6.4 Gross Margin
5.6.5 Clients and Suppliers
5.6.6 Vanadium Business
5.6.7 Prospects
5.7 Chengdu Tianxing Instrument And Meter
5.7.1 Profile
5.7.2 Operation
5.7.3 Revenue Structure
5.7.4 Gross Margin
5.7.5 Clients and Suppliers
5.7.6 Vanadium Business
5.7.7 Prospects
5.8 Zhejiang Hailiang
5.8.1 Profile
5.8.2 Operation
5.8.3 Revenue Structure
5.8.4 Gross Margin
5.8.5 Clients and Suppliers
5.8.6 Vanadium Business
5.8.7 Prospects
6. Summary and Forecast
6.1 Summary
6.2 Forecast
图:全球主要钒资源的利用途径
图:钒产业链
图:全球钒资源(分国家)储量占比
图:全球钒资源(分国家)可采储量占比
图:2013年全球钒(分国家和地区)产量占比
图:2013年全球钒(分不同原材料)产量占比
图:2013年全球钒(分不同原材料)现金成本曲线
图:2001-2013年全球(分国家和地区)钒产量
图:2011-2013年全球钒钒产品库存变化
图:2013年全球钒(分国家和地区)消费量占比
图:2013年全球钒(分应用领域)消费量占比
图:2001-2013年全球(分国家和地区)钒消费量
图:2003-2014年欧洲V2O5(含量≥98%)均价
图:2003-2014年欧洲钒铁(含量70-80%)均价
图:2003-2014年美国匹兹堡仓库钒铁(含量70-80%)均价
图:中国钒矿资源分布图
图:2001-2013年中国钒(折V2O5)产量
图:2001-2013年中国钒制品(折V2O5)消费量
图:2013年中国钒(分领域)消费结构
表:中国与世界主要国家的钢铁产品钒消耗量对比
图:2005-2014年中国钒(含量≥99.5%)均价
图:2011-2014年中国钒氮合金均价
图:2011-2014年中国五氧化二钒(V2O5)进口量及进口总额
图:2011-2014年中国五氧化二钒(V2O5)出口量及出口总额
表:2014年中国五氧化二钒出口前10名国家出口量及出口额
图:2011-2014年中国钒铁(按不同含钒量)出口量
图:2010-2013年ATLANTIC LTD营业收入及净利润
表:Mineral Resources – Windimurra Vanadium Project
图:2009-2013年Highveld Steel and Vanadium营业收入及净利润
表:2012-2013年Highveld Steel and Vanadium(分业务)营业收入及净利润
表:2012-2013年Highveld Steel and Vanadium(分地区)营业收入
图:2009-2013年Highveld Steel and Vanadium钒渣产量
图:2009-2013年Highveld Steel and Vanadium钒产品销量
图:2009-2013年Highveld Steel and Vanadium钒渣营业收入
图:2009-2013年Evraz营业收入及净利润
图:2011-2013年Evraz(分业务)营业收入
图:2011-2013年Evraz(分地区)营业占比
表:Evraz主要钒矿资源
图:2011-2013年Evraz钒渣(分地区)产量
图:2011-2013年Evraz钒渣(分工厂)产量
图:2011-2013年Evraz钒(分产品)销售均价
图:2009-2014年攀钢钒钛营业收入与净利润
图:2009-2014 年攀钢钒钛(分产品)营收占比
图:2009-2014 年攀钢钒钛(分地区)营收占比
图:2009-2014年攀钢钒钛(分产品)毛利率
图:2009-2013年攀钢钒钛前五名供应商合计采购金额及占比
图:2008-2013年攀钢钒钛前五名客户合计营业收入及占比
图:2011-2013年攀钢钒钛钒产品产销量
图:2013年攀钢钒钛钒产品成本结构
图:2009-2014年攀钢钒钛钒产品营业收入
图:2012-2016年攀钢钒钛营业收入及净利润
图:2009-2014年西宁特钢营业收入与净利润
图:2009-2014年西宁特钢(分产品)营收占比
图:2009-2014年西宁特钢(分地区)营收占比
图:2010-2014年西宁特钢(分产品)毛利率
图:2009-2013年西宁特钢前五名供应商合计采购金额及占比
图:2009-2013年西宁特钢前五名客户合计营业收入及占比
图:2010-2014年肃北博伦矿业开发有限公司净资产及净利润
图:2013-2016年西宁特钢营业收入与净利润
图:2009-2014年河北钢铁营业收入与净利润
图:2009-2014年河北钢铁(分业务)营收占比
图:2009-2014年河北钢铁(分地区)营收构成
图:2009-2014年河北钢铁(分产品)毛利率
图:2009-2013年河北钢铁前五名供应商合计采购金额及占比
图:2009-2013年河北钢铁前五名客户合计营业收入及占比
图:2009-2014年河北钢铁钒渣产量
图:2009-2014年河北钢铁钒产品营业收入
图:2013-2016年河北钢铁营业收入及净利润
图:2009-2014年博信股份营业收入及净利润
图:2012-2014年博信股份(分业务)营收占比
图:2012-2014年博信股份(分产品)毛利率
表:2013年博信股份前五名供应商采购金额及占比
表:2013年博信股份前五名客户营业收入及占比
表:贵州博信钒矿资源储量
图:2013-2016年博信股份营业收入及净利润
图:2009-2014年鼎立股份营业收入及净利润
图:2009-2014年鼎立股份(分业务)营收占比
图:2010-2014年鼎立股份(分产品)毛利率
图:2009-2013年鼎立股份前五名客户合计营业收入及占比
表:2013年鼎立股份前五名供应商采购金额
图:2013-2016年鼎立股份营业收入及净利润
表:2009-2014年明星电力营业收入及净利润
图:2009-2014年明星电力(分业务)营收占比
图:2009-2014年明星电力(分产品)毛利率
图:2009-2013年明星电力前五名客户合计营业收入及占比
图:2011-2013年明星电力前五名供应商合计采购金额及占比
图:2013-2016年明星电力营业收入及净利润
图:2009-2014年天兴仪表营业收入及净利润
图:2009-2014年天兴仪表(分业务)营收占比
图:2009-2014年天兴仪表(分地区)营收构成
图:2009-2014年天兴仪表(分产品)毛利率
图:2009-2013年天兴仪表前五名供应商合计采购金额及占比
图:2009-2013年天兴仪表前五名客户合计营业收入及占比
图:2013-2016年天兴仪表营业收入及净利润
图:2009-2014年海亮股份营业收入及净利润
图:2009-2014年海亮股份(分业务)营收占比
图:2009-2014年海亮股份(分地区)营收构成
图:2009-2014年海亮股份(分产品)毛利率
图:2009-2013年海亮股份前五名供应商合计采购金额及占比
图:2009-2013年海亮股份前五名客户合计营业收入及占比
图:2009-2014年恒昊矿业营业收入及净利润
图:2013-2016年海亮股份营业收入及净利润
图:2009-2014年中国主要钒厂商毛利率
图:2013-2017年中国钒(折V2O5)产量
图:2001-2020年全球(分国家和地区)钢铁产品钒消耗量
Utilization Ways for Major Vanadium Resources in the World
Vanadium Industry Chain
Proportion of Global Vanadium Reserves (by Country)
Proportion of Global Recoverable Vanadium Reserves (by Country)
Proportion of Global Vanadium Production (by Country/Region), 2013
Proportion of Global Vanadium Production (by Different Raw Materials), 2013
Cash Cost Curve of Global Vanadium (by Different Raw Materials), 2013
Global Vanadium Production (by Country/Region), 2001-2013
Changes in Global Vanadium Product Inventory, 2011-2013
Proportion of Global Vanadium Consumption (by Country/Region), 2013
Proportion of Global Vanadium Consumption (by Applications), 2013
Global Vanadium Consumption (by Country/Region), 2001-2013
Average Price of V2O5 (Content ≥98%) in Europe, 2003-2014
Average Price of Ferrovanadium (Content 70-80%) in Europe, 2003-2014
Average Price of Ferrovanadium (Content 70-80%) in Pittsburgh Depot, USA, 2013-2014
Distribution of Vanadium Ore Resources in China
Vanadium (V2O5 Equivalent) Output in China, 2001-2013
Consumption of Vanadium Products (V2O5 Equivalent) in China, 2001-2013
Consumption Structure of Vanadium (by Sector) in China, 2013
Comparison of China with Other Major Powers in Iron & Steel Products’ Consumption of Vanadium
Average Price of Vanadium (Content ≥99.5%) in China, 2005-2014
Average Price of Vanadium-Nitrogen Alloy in China, 2011-2014
Import Volume and Value of Vanadium Pentoxide (V2O5) in China, 2011-2014
Export Volume and Value of Vanadium Pentoxide (V2O5) in China, 2011-2014
China’s Export Volume and Value of Vanadium Pentoxide (V2O5) to Top 10 Export Destinations, 2014
Ferrovanadium (by Differed Content of Vanadium) Export Volume of China, 2011-2014
Revenue and Net Income of Atlantic Ltd., 2010-2013
Mineral Resources – Windimurra Vanadium Project
Revenue and Net Income of Highveld Steel and Vanadium, 2009-2013
Revenue and Net Income of Highveld Steel and Vanadium (by Business), 2012-2013
Revenue of Highveld Steel and Vanadium (by Region), 2012-2013
Vanadium Slag Output of Highveld Steel and Vanadium, 2009-2013
Sales Volume of Vanadium Products of Highveld Steel and Vanadium, 2009-2013
Revenue from Vanadium Slag of Highveld Steel and Vanadium, 2009-2013
Revenue and Net Income of Evraz, 2009-2013
Revenue of Evraz (by Business), 2011-2013
Revenue Structure of Evraz (by Region), 2011-2013
Vanadium Ore Resources of Evraz
Vanadium Slag Output of Evraz (by Region), 2011-2013
Vanadium Slag Output of Evraz (by Plant), 2011-2013
ASP of Vanadium of Evraz (by Product), 2011-2013
Revenue and Net Income of Pangang Group Vanadium Titanium & Resources, 2009-2014
Revenue Structure of Pangang Group Vanadium Titanium & Resources (by Product), 2009-2014
Revenue Structure of Pangang Group Vanadium Titanium & Resources (by Region), 2009-2014
Gross Margin of Pangang Group Vanadium Titanium & Resources (by Product), 2009-2014
Pangang Group Vanadium Titanium & Resources’ Combined Procurement from Top 5 Suppliers and % of Total Procurement, 2009-2013
Pangang Group Vanadium Titanium & Resources’ Combined Revenue from Top 5 Customers and % of Total Revenue, 2008-2013
Production and Sales Volume of Vanadium Products of Pangang Group Vanadium Titanium & Resources, 2011-2013
Cost Structure of Vanadium Products of Pangang Group Vanadium Titanium & Resources, 2013
Revenue from Vanadium Products of Pangang Group Vanadium Titanium & Resources, 2009-2014
Revenue and Net Income of Pangang Group Vanadium Titanium & Resources, 2012-2016E
Revenue and Net Income of Xining Special Steel, 2009-2014
Revenue Structure of Xining Special Steel (by Product), 2009-2014
Revenue Structure of Xining Special Steel (by Region), 2009-2014
Gross Margin of Xining Special Steel (by Product), 2010-2014
Xining Special Steel’s Combined Procurement from Top 5 Suppliers and % of Total Procurement, 2009-2013
Xining Special Steel’s Combined Revenue from Top 5 Customers and % of Total Revenue, 2009-2013
Net Assets and Net Income of Subei Bolun Mining Development Co., Ltd., 2010-2014
Revenue and Net Income of Xining Special Steel, 2013-2016E
Revenue and Net Income of Hebei Iron & Steel, 2009-2014
Revenue Structure of Hebei Iron & Steel (by Business), 2009-2014
Revenue Structure of Hebei Iron & Steel (by Region), 2009-2014
Gross Margin of Hebei Iron & Steel (by Product), 2009-2014
Hebei Iron & Steel’s Combined Procurement from Top 5 Suppliers and % of Total Procurement, 2009-2013
Hebei Iron & Steel’s Combined Revenue from Top 5 Customers and % of Total Revenue, 2009-2013
Vanadium Slag Output of Hebei Iron & Steel, 2009-2014
Revenue from Vanadium Products of Hebei Iron & Steel, 2009-2014
Revenue and Net Income of Hebei Iron & Steel, 2013-2016
Revenue and Net Income of Guangdong Boxin Investing & Holdings, 2009-2014
Revenue Structure of Guangdong Boxin Investing & Holdings (by Business), 2012-2014
Gross Margin of Guangdong Boxin Investing & Holdings (by Product), 2012-2014
Guangdong Boxin Investing & Holdings’ Combined Procurement from Top 5 Suppliers and % of Total Procurement, 2013
Guangdong Boxin Investing & Holdings’ Combined Revenue from Top 5 Customers and % of Total Revenue, 2013
Vanadium Resource Reserves of Guizhou Boxin Mining Co., Ltd.
Revenue and Net Income of Guangdong Boxin Investing & Holdings, 2013-2016E
Revenue and Net Income of Shanghai Dingli Technology Development, 2009-2014
Revenue Structure of Shanghai Dingli Technology Development (by Business), 2009-2014
Gross Margin of Shanghai Dingli Technology Development (by Product), 2010-2014
Shanghai Dingli Technology Development’s Combined Revenue from Top 5 Customers and % of Total Revenue, 2009-2013
Shanghai Dingli Technology Development’s Procurement from Top 5 Suppliers, 2013
Revenue and Net Income of Shanghai Dingli Technology Development, 2013-2016E
Revenue and Net Income of Sichuan Mingxing Electric Power, 2009-2014
Revenue Structure of Sichuan Mingxing Electric Power (by Business), 2009-2014
Gross Margin of Sichuan Mingxing Electric Power (by Product), 2009-2014
Sichuan Mingxing Electric Power’s Combined Revenue from Top 5 Customers and % of Total Revenue, 2009-2013
Sichuan Mingxing Electric Power’s Combined Procurement from Top 5 Suppliers and % of Total Procurement, 2011-2013
Revenue and Net Income of Sichuan Mingxing Electric Power, 2013-2016E
Revenue and Net Income of Chengdu Tianxing Instrument And Meter, 2009-2014
Revenue Structure of Chengdu Tianxing Instrument And Meter (by Business), 2009-2014
Revenue Structure of Chengdu Tianxing Instrument And Meter (by Region), 2009-2014
Gross Margin of Chengdu Tianxing Instrument And Meter (by Product), 2009-2014
Chengdu Tianxing Instrument And Meter’s Combined Procurement from Top 5 Suppliers and % of Total Procurement, 2009-2013
Chengdu Tianxing Instrument And Meter’s Combined Revenue from Top 5 Customers and % of Total Revenue, 2009-2013
Revenue and Net Income of Chengdu Tianxing Instrument And Meter, 2013-2016E
Revenue and Net Income of Zhejiang Hailiang, 2009-2014
Revenue Structure of Zhejiang Hailiang (by Business), 2009-2014
Revenue Structure of Zhejiang Hailiang (by Region), 2009-2014
Gross Margin of Zhejiang Hailiang (by Product), 2009-2014
Zhejiang Hailiang’s Combined Procurement from Top 5 Suppliers and % of Total Procurement, 2009-2013
Zhejiang Hailiang’s Combined Revenue from Top 5 Customers and % of Total Revenue, 2009-2013
Revenue and Net Income of Honghe Henghao Mining Co., Ltd, 2009-2014
Revenue and Net Income of Zhejiang Hailiang, 2013-2016E
Gross Margin of Key Vanadium Manufacturers in China, 2009-2014
Vanadium (V2O5 Equivalent) Output in China, 2013-2017E
Iron & Steel Products’ Consumption of Vanadium (by Country/Region) Worldwide, 2001-2020E
如果这份报告不能满足您的要求,我们还可以为您定制报告,请 留言说明您的详细需求。
|