|
|
|
报告导航:研究报告—
TMT产业—电子半导体
|
|
2014-2015年全球及中国手机显示屏行业研究报告 |
 |
字数:2.1万 |
页数:130 |
图表数:183 |
|
中文电子版:8000元 |
中文纸版:4000元 |
中文(电子+纸)版:8500元 |
|
英文电子版:2200美元 |
英文纸版:2400美元 |
英文(电子+纸)版:2500美元 |
|
编号:ZYW191
|
发布日期:2014-12 |
附件:下载 |
 |
|
|
《2014-2015年全球及中国手机显示屏行业研究报告》包含以下内容:
1、TFT-LCD简介
2、TFT-LCD产业链分析
3、LCD市场与产业分析
4、手机显示屏市场与产业分析
5、14家全球主要手机显示屏厂家研究
中国是全球第一大智能手机市场,不过这个市场在2014年开始下滑,一是中国国内经济增速放缓,二是智能手机普及率已经很高,市场已出现饱和。2014年1-10月中国智能手机出货量为3.12亿部,比2013年同期下滑10.4%。预计2014年智能手机出货量为3.98亿部,比2013年下滑9%。2015年,中国经济增速继续放缓,并且放缓幅度将大于2014年。预计2015年中国智能手机市场下滑13%,出货量为3.46亿部。
进入2014年,中国智能手机市场变化迅速。一是4G以惊人速度飞速发展,2014年2月4G手机占整个中国手机市场比例仅7.4%,而在2014年10月就达到了63.3%。3G手机2月份占比83.8%,10月份锐减到21.3%。二是本土厂家份额大幅度提升,国外品牌节节败退。本土厂家擅长炒作式营销,而这种高明的营销手段对中国消费者非常有效。本土品牌在营销手段上远胜国外品牌,尤其是小米。
三是市场集中度大幅度提高,2013年智能手机前十大厂家市场占有率不足70%,2014年前十大厂家市场占有率则达85%以上,预计2015年可达90%以上,小厂家生存空间即将消失。四是网络销售渠道改变市场游戏规则。2013年网络智能手机销售量所占比例只有10%,到2014年3季度则超过20%。加上运营商取消补贴,各大手机厂家都在加大网络销售力度。
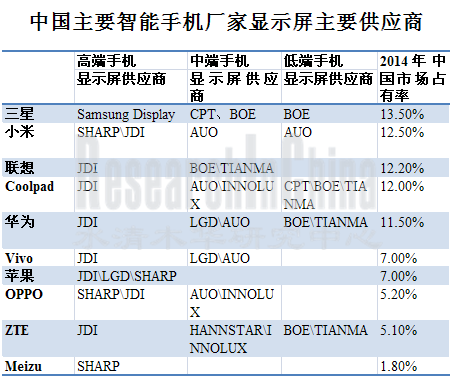
出乎大多数人的预料,中国品牌厂家如Vivo、OPPO等对手机屏幕要求极高。比如OPPO手机屏幕有一半以上来自日本JDI和夏普。魅族则超过90%来自夏普。小米也有1/3来自夏普。华为则有1/4的屏幕来自JDI。而国外品牌,却采用廉价的显示屏,如三星低端非AMOLED的显示屏主要供应商来自中国的京东方(BOE)和凌巨(Giantplus)。
产业方面,随着手机显示屏分辨率快速提升,LTPS投资火爆,到2016年底,全中国至少有5座6代线,以及1座5.5代线LTPS的产能开出,6代线包括友达昆山、京东方鄂尔多斯、成都、华星武汉、富士康成都等,以及天马厦门5.5代线。这些生产线会造成低端市场严重过剩,价格大幅度下滑;而高端市场,JDI、夏普和LG Display会依靠In-Cell,一样可以获得高利润。
触控屏方面,随着胜华的破产保护,OGS、TOL触控屏市场可能大幅度萎缩。而In-Cell经过数年的发展已经相当成熟,价格竞争力越来越明显,同时In-Cell更轻更薄,这让In-Cell市场大幅度扩展,中国本土品牌厂家都有推出采用In-Cell显示屏的手机。预计2015年In-Cell显示屏比例逼近25%,2017年可达43%。外挂型触控屏可能会大幅度萎缩。
Global and China Mobile Phone Display Industry Report, 2014-2015 focuses on the following:
1. Overview of TFT-LCD
2. TFT-LCD industry chain
3. LCD market and industry
4. Mobile phone display market and industry
5. 14 major mobile phone display companies
China is the world’s largest smart phone market, but has experienced a decline in 2014, due to slower domestic economic growth and already high penetration of smart phones, presenting some kind of saturation on the market. Smart phone shipments reached 312 million units in China during Jan.-Oct. 2014, sliding by 10.4% compared with the same period in 2013, and is expected to arrive at 398 million units throughout the year 2014, down 9% against 2013. It is projected that China’s economy will grow much slower in 2015, probably more dramatically than that in 2014. The Chinese smart phone market is estimated to fall by 13% in 2015 with 346 million units shipped.
Entering the year 2014, Chinese smart phone market has undergone dramatic changes, reflected by surprisingly rapid development of 4G and substantial increase in market share of domestic vendors and retreat of foreign brands. On the one hand, 4G mobile phones held only 7.4% of the Chinese mobile phone market in Feb. 2014, but the figure rose to 63.3% in Oct., compared with 83.8% in Feb. and 21.3% in Oct. for 3G mobile phones. On the other hand, local vendors excel at hype-style marketing, which is very effective to Chinese consumers. Local brands, especially Xiaomi, are far superior to foreign brand in the aspect of marketing tools.
Moreover, the market concentration was greatly enhanced. Top ten smart phone vendors together took up less than 70% market share in 2013, but the figure rose to over 85% in 2014, and is expected to exceed 90% in 2015, further squeezing the living space of small vendors. Fourth, Internet sales channel changed rules of market game. Smart phone sold over the Internet made up only 10% in 2013 but more than 20% in the third quarter of 2014. Furthermore, as operators cancelled subsidies, mobile phone vendors are stepping up their efforts on Internet sales.
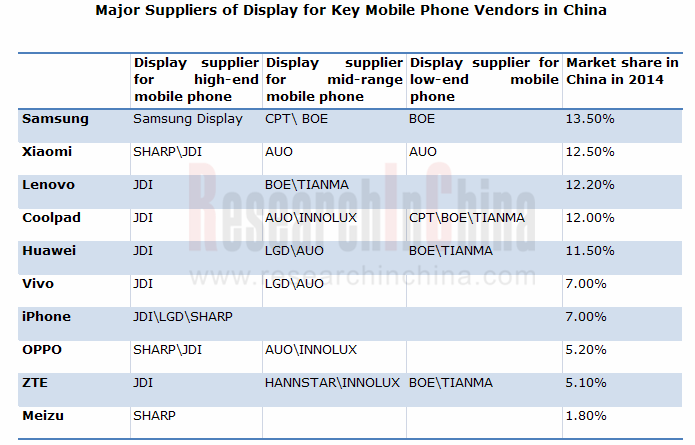
Contrary to what most people think, the Chinese brands, like Vivo and OPPO, are demanding on mobile phone display. More than half of displays for OPPO mobile phones come from Japanese JDI and Sharp, over 90% from Sharp for Meizu, 1/3 from Sharp for Xiaomi and 1/4 from JDI for Huawei. By contrast, foreign brands adopt cheap displays, like Samsung which purchases low-end non- AMOLED displays mainly from Chinese BOE and Giantplus.
With regard to industry, as the resolution of mobile phone display rises quickly, investment in LTPS is hot. By the end of 2016, there will be at least five G6 LTPS fabs and one G5.5 LTPS fab running in China, including G6 of AUO in Kunshan, BOE in Ordos and Chengdu, China Star in Wuhan, Foxconn in Chengdu, and G5.5 of Tianma in Xiamen. These production lines will cause severe oversupply in low-end market and sharp price decline; in high-end market, JDI, Sharp and LG Display are still able to make high profits by relying on In-Cell.
In respect to touch screen, with Wintek placed into bankruptcy protection, OGS and TOL touch screen market will shrink significantly. After years of development, In-Cell has been quite mature, and its price competitiveness has become more obvious. Being lighter and thinner, In-Cell sees a massive market expansion. Some local brands have introduced mobile phones with In-Cell display. It is projected that In-Cell display will approached 25% in 2015 and 43% in 2017. Plug-in touch screen is likely to contract drastically.
第一章、TFT-LCD简介
1.1、TFT-LCD结构
1.2、TFT-LCD生产流程
1.3、LTPS
1.4、LGZO与LTPS竞争分析
1.5、TFT-LCD成本结构
第二章、TFT-LCD产业链
2.1、TFT-LCD 玻璃基板简介
2.2、TFT-LCD 玻璃基板产业分析
2.3、康宁
2.4、东旭光电
2.5、背光模组简介
2.6、背光模组成本结构
2.7、OPEN-CELL与HINGE-UP
2.8、背光模组产业
2.9、瑞仪光电
2.10、中强光电
2.11、LCD驱动IC市场
2.12、LCD驱动IC产业
2.13、联咏
2.14、偏光板简介
2.15、偏光板市场
2.16、偏光板产业分析
第三章、LCD市场与产业
3.1、全球手机市场
3.2、全球智能手机市场
3.3、中国手机市场
3.4、平板电脑市场
第四章、手机显示屏产业与市场
4.1、TFT-LCD产业近况
4.2、TFT-LCD产业排名
4.3、全球手机显示屏发展趋势
4.4、中国手机显示屏发展趋势
4.5、全球手机显示屏产业分析
4.6、手机显示屏厂家与手机品牌厂家配套关系
第五章、主要TFT-LCD厂家研究
5.1、友达
5.2、群创
5.3、LG DISPLAY
5.4、中电熊猫液晶显示科技
5.5、京东方
5.6、深圳华星光电CSOT
5.7、夏普
5.8、三星显示器件
5.9、中华映管
5.10、瀚宇彩晶
5.11、天马微电子
5.12、JAPAN DISPLAY
5.13、TRULY信利国际
5.14、凌巨
1. Overview of TFT-LCD
1.1 Structure of TFT-LCD
1.2 TFT-LCD Production Process
1.3 LTPS
1.4 Competition between LGZO and LTPS
1.5 Cost Structure of TFT-LCD
2. TFT-LCD Industry Chain
2.1 Overview of TFT-LCD Glass Substrate
2.2 TFT-LCD Glass Substrate Industry
2.3 Corning
2.4 Dongxu Optoelectronic Technology
2.5 Overview of Backlight Module
2.6 Cost Structure of Backlight Module
2.7 OPEN-CELL and HINGE-UP
2.8 Backlight Module Industry
2.9 Radiant Opto-Electronics
2.10 Coretronic
2.11 LCD Driver IC Market
2.12 LCD Driver IC Industry
2.13 Novatek Microelectronics
2.14 Overview of Polarizing Plate
2.15 Polarizing Plate Market
2.16 Polarizing Plate Industry
3. LCD Market and Industry
3.1 Global Mobile Phone Market
3.2 Global Smart Phone Market
3.3 Chinese Mobile Phone Market
3.4 Tablet PC Market
4. Mobile Phone Display Industry and Market
4.1 Recent Developments in TFT-LCD Industry
4.2 Rankings in TFT-LCD Industry
4.3 Development Trend of Global Mobile Phone Display
4.4 Development Trend of Mobile Phone Display in China
4.5 Global Mobile Phone Display Industry
4.6 Supporting Relationship between Mobile Phone Display Manufacturers and Mobile Phone Vendors
5. Major TFT-LCD Vendors
5.1 AUO
5.2 InnoLux
5.3 LG DISPLAY
5.4 Nanjing CEC Panda LCD Technology
5.5 BOE
5.6 CSOT
5.7 Sharp
5.8 Samsung Display
5.9 CPT
5.10 HannStar
5.11 Tianma Micro-electronics
5.12 JAPAN DISPLAY
5.13 Truly International
5.14 Giantplus
Structure of TFT-LCD
Color Filter Production Process
TFT Production Process
LCD Production Process
2014-2016 IGZO产能厂家分布
全球IGZO(Oxide)生产线一览
2010-2011年全球LCD 玻璃基板需求量
2010-2011年全球LCD 玻璃基板市场规模
2014年全球TFT-LCD 玻璃基板主要厂家市场占有率
全球TFT-LCD 玻璃基板主要厂家出货量尺寸分布
2008-2014年Corning收入与毛利率
2009-2014年Corning TFT-LCD Glass Substrate 收入与净利润
2008-2014年东旭光电收入与营业利润
东旭光电生产线List
笔记本电脑显示面板用背光模组结构
电脑显示器面板背光模组结构
电视面板背光模组结构
13.3英寸LED笔记本电脑显示面板用背光模组成本结构
18.5英寸LED电脑显示器面板背光模组结构
42英寸LED电视面板背光模组成本结构
hinge up 组织模式下的笔记本机壳供应链管理(SCM)
hinge up 模式下的BLU
2006-2012年Open-cell出货比例
2012年全球主要背光模组厂家市场占有率(By Revenue)
BLU-VS-PANEL MAKER关系
2010-2012年全球主要背光模组厂家运营利润率
2010-2012年全球主要背光模组厂家收入
Radiant Opto-Electronics Organization
2008-2014年瑞仪收入与毛利率
2012年10月-2014年10月瑞仪月度收入
瑞仪生产基地分布
2012年瑞仪产能工厂分布
2012-2014年瑞仪收入产品分布
2012-2014年瑞仪收入客户分布
2012-2014年瑞仪NB/Tablet PC BLU 月度出货量
2012-2014年瑞仪Monitor BLU 月度出货量
2012-2014年瑞仪Tv BLU 月度出货量
2006-2014年中强光电收入与运营利润率
2012年10月-2014年10月中强光电月度收入
2010-2014年中强光电收入业务分布
3Q/13-3Q/14 中强光电季度BLU出货量下游分布
3Q/13-3Q/14 中强光电季度BLU收入下游分布
2009-2016年全球显示驱动IC市场规模
2009-2014年全球显示驱动IC市场规模类型分布
LCD驱动IC产业链
2014年Large Area TFT-LCD Driver IC主要厂家市场占有率
2014年Small-Medium Area TFT-LCD Driver IC主要厂家市场占有率
2010-2013年全球主要驱动IC厂家收入排名
Novatek Organization Chart
2006-2014年联咏收入与运营利润率
2012年10月-2014年10月联咏月度收入
201-2015年联咏电视驱动IC出货量
Q1/13-Q4/14联咏季度收入产品分布
2011-2017年偏光板市场规模
2013-2018年偏光板市场技术分布
2014年TV用偏光板主要厂家市场占有率
2014年Notebook PC用偏光板厂家市场占有率
2014年TabletPC用偏光板厂家市场占有率
2014年Monitor用偏光板厂家市场占有率
2007-2015年全球手机出货量
2011-2014年全球3G/4G手机出货量地域分布
Worldwide Mobile Phone Sales to End Users by Vendor in 2013 (Thousands of Units)
Worldwide Smartphone Sales to End Users by Vendor in 2013 (Thousands of Units)
Worldwide Smartphone Sales to End Users by Operating System in 2013 (Thousands of Units)
2013-2015年全球Top 13智能手机厂家出货量
2014年1-10月中国手机月度出货量
2014年中国智能手机市场主要厂家市场占有率
2014年中国4G手机市场主要厂家市场占有率
2011-2016年全球平板电脑出货量
2013年平板电脑主要品牌市场占有率
2012、2013年全球平板电脑制造厂家产量
Sep/2013-Sep/2014 Monthly Total TFT LCD Revenues and Growth
Sep/2013-Sep/2014 Monthly LCD-TV Panel Units Shipments and Growth
Sep/2013-Sep/2014 Monthly Monitor Panel Units Shipments and Growth
Sep/2013-Sep/2014 Monthly Notebook PC Panel Units Shipments and Growth
Sep/2013-Sep/2014 Monthly Tablet PC Panel Units Shipments and Growth
2014年2季度全球主要TFT-LCD大尺寸面板出货量市场占有率
2002-2013年全球主要TFT-LCD大尺寸面板厂家营业利润率
2012-2014年全球主要TFT-LCD面板厂家收入排名
2012-2014年全球主要TFT-LCD面板厂家营业利润率
2013-2017年全球智能手机显示屏尺寸发展趋势
2013-2017年全球智能手机触控技术发展趋势
2013-2017年全球智能手机显示屏技术发展趋势
2013-2017年全球智能手机显示屏分辨率发展趋势
2014年中国手机市场尺寸分布
2013-2017年中国智能手机显示屏尺寸发展趋势
2014年中国智能手机市场分辨率分布
2013-2017年中国智能手机显示屏分辨率发展趋势
2014年中国手机市场PPI分布
2013-2017年中国智能手机显示屏技术发展趋势
2013-2014年全球主要中小尺寸显示屏厂家出货量
2014年中国手机显示屏主要供应厂家市场占有率
2014年三星手机屏主要供应商份额
2014年APPLE手机屏主要供应商份额
2014年HUAWEI手机屏主要供应商份额
2014年LENOVO手机屏主要供应商份额
2014年ZTE手机屏主要供应商份额
2014年COOLPAD手机屏主要供应商份额
2014年OPPO手机屏主要供应商份额
2014年XIAOMI手机屏主要供应商份额
2014年Vivo手机屏主要供应商份额
AUO组织结构
2009-2014年AUO收入与毛利率
2012、2013年AUO收入地域分布
2012、2013年AUO收入下游分布
2012、2013年AUO出货量下游分布
major suppliers of key raw materials and components关键原材料供应商
3Q13-3Q14 AUO Display Revenue Breakdown by Application
3Q13-3Q14 AUO Display Revenue Breakdown by Size
3Q13-3Q14 AUO Shipments and ASP
3Q13-3Q14 AUO Small & Medium Panel Shipments by Area & Revenues
友达各生产线List
友达LCM基地
INNOLUX组织结构
2010-2014年INNOLUX收入与营业利润率
4Q12-3Q14 INNOLUX Revenue, Gross Margin, EBITDA Margin
4Q12-3Q14 INNOLUX Total Debt and Debt Ratios
4Q12-3Q14 INNOLUX Inventory Trend
4Q12-3Q14 INNOLUX Area Shipments and TFT LCD ASP Trends
4Q12-3Q14 INNOLUX Small & Medium Size Unit Shipments and Sales Trends
4Q12-3Q14 INNOLUX Sales Breakdown by Application
4Q12-3Q14 INNOLUX Sales Breakdown by Size
INNOLUX TFT-LCD Fabs Profile
Touch Sensor Fabs Profile
2009-2015年LG Display收入与营业利润率
1Q13-3Q14 LG Display季度收入与毛利率
2012-2014 LG DISPLAY IFRS Statements of Financial Position
2009-2013 LG DISPLAY 出货量下游分布
2009-2013 LG DISPLAY 收入下游分布
2011-2013 LG DISPLAY 收入地域分布
Q3/13-Q3/14 LG Display Quarterly Shipments and ASP
Q3/13-Q3/14 LG Display Quarterly Revenue by Application
Q3/13-Q3/14 LG Display Quarterly producible by area
LG Display Fabs Capacity List
2011-2013 LG Display Fabs Capacity
LG Display Footprint
LG Display Manufacturing Base Footprint
南京中电熊猫液晶显示科技组织结构
2013南京中电熊猫液晶显示科技原材料采购额
2013南京中电熊猫液晶显示科技原材料供应商
2013南京中电熊猫液晶显示科技五大客户
2008-2014年BOE收入与营业利润
BOE MILESTONE
BOE Manufacturing Base Foorprint
1Q/10-3Q/14 BOE Quarterly Revenue
2013年BOE主要子公司简明财务
FY2008-FY2015 SHARP 收入与营业利润率
FY2013-FY2015 SHARP收入业务分布
FY2013-FY2015 SHARP 各项业务营业利润率
2013-2014夏普手机面板分辨率
夏普生产线一览
2010-2015年三星DP事业部收入与营业利润率
2012-2015年三星Dp事业部收入产品分布
2012-2015年三星Dp事业部收入营业利润分布
三星生产线一览
2007-2014 CPT收入与营业利润率
CPT生产线一览
2006-2014年彩晶收入与营业利润率
彩晶基地分布
2005-2014年深圳天马微电子收入与运营利润率
天马微电子组织结构
天马生产线一览
天马各子公司2012-2013年产能、产量与产能利用率
2012-2013年天马客户分布
天马生产线产能
The JDI Group in Transition
2013年2季度-2014年季度JDI季度收入业务分布
2013年2季度-2014年季度JDI季度营业利润率
2013年1季度-2014年4季度JDI客户地域分布
2014年JDI出货量分辨率分布
JDI商业模式
2012年10月-2014年10月中日新月度收入
2005-2014年信利国际收入与运营利润率
2013年1季度-2014年4季度信利国际季度收入与毛利率
2006-2011年信利国际LCD业务收入技术分布
2012-2015年信利半导体收入业务分布
2012-2015年信利半导体各项产品出货量
2012-2015年信利半导体各项产品ASP
信利手机LCD主要客户
信利汽车显示器主要客户
信利触摸屏产能
信利CCM主要客户
2005-2014年凌巨收入与毛利率
2012年10月-2014年10月凌巨月度收入
Structure of TFT-LCD
Color Filter Production Process
TFT Production Process
LCD Production Process
IGZO Capacity Distribution by Vendor, 2014-2016E
Global IGZO (Oxide) Production Lines
Global LCD Glass Substrate Demand, 2010-2011
Global LCD Glass Substrate Market Size, 2010-2011
Market Share of Major Global TFT-LCD Glass Substrate Manufacturers, 2014
Shipments of Major Global TFT-LCD Glass Substrate Manufacturers by Size
Revenue and Gross Margin of Corning, 2008-2014
Corning’s Revenue and Net Income from TFT-LCD Glass Substrate, 2009-2014
Revenue and Operating Profit of Dongxu Optoelectronic Technology, 2008-2014
List of Production Lines of Dongxu Optoelectronic Technology
Laptop Computer Display Panel-use Backlight Module Structure
Computer Display Panel Backlight Module Structure
TV Panel Backlight Module Structure
Cost Structure of Backlight Module for 13.3-inch LED Laptop Computer Display Panel
Cost Structure of Backlight Module for 18.5-inch LED Computer Display Panel
Cost Structure of Backlight Module for 42-inch LED TV Panel
Laptop Computer Case Supply Chain Management (SCM) under Hinge-up Mode
BLU under Hinge-up Mode
Open-cell Shipment Proportion, 2006-2012
Market Share of Global Major Backlight Module Vendors (by Revenue), 2012
Relationship between BLU-VS-Panel Makers
Revenue and Operating Margin of Global Major Backlight Module Vendors, 2010-2012
Revenue of Global Major Backlight Module Vendors, 2010-2012
Organization of Radiant Opto-Electronics
Revenue and Gross Margin of Radiant Opto-Electronics, 2008-2014
Monthly Revenue of Radiant Opto-Electronics, Oct 2012-Oct 2014
Production Base Distribution of Radiant Opto-Electronics
Capacity of Radiant Opto-Electronics by Factory, 2012
Revenue Breakdown of Radiant Opto-Electronics by Product, 2012-2014
Revenue Breakdown of Radiant Opto-Electronics by Customer, 2012-2014
Monthly Shipments of NB/Tablet PC BLU of Radiant Opto-Electronics, 2012-2014
Monthly Shipments of Monitor BLU of Radiant Opto-Electronics, 2012-2014
Monthly Shipments of TV BLU of Radiant Opto-Electronics, 2012-2014
Revenue and Operating Margin of Coretronic, 2006-2014
Monthly Revenue of Coretronic, Oct. 2012-Oct. 2014
Revenue Breakdown of Coretronic by Business, 2010-2014
Quarterly BLU Shipments of Coretronic by Application, Q32013-3Q2014
Quarterly BLU Revenue of Coretronic by Application, Q32013-3Q2014
Global Display Driver IC Market Size, 2009-2016E
Global Display Driver IC Market Size by Type, 2009-2014
LCD Driver IC Industry Chain
Market Share of Major Large Area TFT-LCD Driver IC Vendors, 2014
Market Share of Major Small-Medium Area TFT-LCD Driver IC Vendors, 2014
Ranking of Major Global Driver IC Vendors by Revenue, 2010-2013
Organization Chart of Novatek Microelectronics
Revenue and Operating Margin of Novatek Microelectronics, 2006-2014
Monthly Revenue of Novatek Microelectronics, Oct. 2012-Oct. 2014
TV Driver IC Shipments of Novatek Microelectronics, 2001-2015E
Quarterly Revenue Breakdown of Novatek Microelectronics by Product, Q12013-Q42014
Polarizing Plate Market Size, 2011-2017E
Polarizing Plate Market by Technology, 2013-2018E
Market Share of Major Companies of Polarizing Plate for TV, 2014
Market Share of Major Companies of Polarizing Plate for Notebook PC, 2014
Market Share of Major Companies of Polarizing Plate for Tablet PC, 2014
Market Share of Major Manufacturers of Polarizing Plate for Monitor, 2014
Global Mobile Phone Shipments, 2007-2015E
Global 3G/4G Mobile Phone Shipments by Region, 2011-2014
Global Mobile Phone Sales to End Users by Vendor, 2013 (Thousands of Units)
Global Smartphone Sales to End Users by Vendor, 2013 (Thousands of Units)
Global Smartphone Sales to End Users by Operating System, 2013 (Thousands of Units)
Shipments of Global Top13 Smart Phone Vendors, 2013-2015E
Monthly Mobile Phone Shipments in China, Jan.-Oct. 2014
Market Share of Major Vendors in Chinese Smart Phone Market, 2014
Market Share of Major Vendors in Chinese 4G Mobile Phone Market, 2014
Global Tablet PC Shipments, 2011-2016E
Market Share of Major Tablet PC Brands, 2013
Output of Global Tablet PC Makers, 2012&2013
Monthly Total TFT LCD Revenues and Growth, Sep. 2013-Sep. 2014
Monthly LCD-TV Panel Units Shipments and Growth, Sep. 2013-Sep. 2014
Monthly Monitor Panel Units Shipments and Growth, Sep. 2013-Sep. 2014
Monthly Notebook PC Panel Units Shipments and Growth, Sep. 2013-Sep. 2014
Monthly Tablet PC Panel Units Shipments and Growth, Sep. 2013-Sep. 2014
Market Share of Major Global TFT-LCD Large Size Panels by Shipment, Q2’2014
Operating Margin of Major Global TFT-LCD Large Size Panel Vendors, 2002-2013
Ranking of Major Global TFT-LCD Panel Vendors by Revenue, 2012-2014
Operating Margin of Major Global TFT-LCD Panel Vendors, 2012-2014
Global Development Trend of Smart Phone Display Size, 2013-2017E
Global Development Trend of Smart Phone Touch Technology, 2013-2017E
Global Development Trend of Smart Phone Display Technology, 2013-2017E
Global Development Trend of Smart Phone Display Resolution, 2013-2017E
Chinese Mobile Phone Market by Size, 2014
Development Trend of Smart Phone Display Size in China, 2013-2017E
Chinese Mobile Phone Market by Resolution, 2014
Development Trend of Smart Phone Display Resolution in China, 2013-2017E
Chinese Mobile Phone Market by PPI, 2014
Development Trend of Smart Phone Display Technology in China, 2013-2017E
Shipments of Major Global Small- and Medium-sized Display Vendors, 2013-2014
Market Share of Major Suppliers of Mobile Phone Display in China, 2014
Share of Major Display Suppliers for Samsung Mobile Phones, 2014
Share of Major Display Suppliers for Apple Mobile Phones, 2014
Share of Major Display Suppliers for Huawei Mobile Phones, 2014
Share of Major Display Suppliers for Lenovo Mobile Phones, 2014
Share of Major Display Suppliers for ZTE Mobile Phones, 2014
Share of Major Display Suppliers for COOLPAD Mobile Phones, 2014
Share of Major Display Suppliers for OPPO Mobile Phones, 2014
Share of Major Display Suppliers for Xiaomi Mobile Phones, 2014
Share of Major Display Suppliers for Vivo Mobile Phones, 2014
Organization Chart of AUO
Revenue and Gross Margin of AUO, 2009-2014
Revenue Breakdown of AUO by Region, 2012&2013
Revenue Breakdown of AUO by Application, 2012&2013
Shipments Breakdown of AUO by Application, 2012&2013
Major Suppliers of Key Raw Materials and Components
Display Revenue Breakdown of AUO by Application, 3Q13-3Q14
Display Revenue Breakdown of AUO by Size, 3Q13-3Q14
Shipments and ASP of AUO, 3Q13-3Q14
Small & Medium Panel Shipments of AUO by Area & Revenue, 3Q2013-3Q2014
Production Line List of AUO
LCM Bases of AUO
Organization Chart of INNOLUX
Revenue and Operating Margin of INNOLUX, 2010-2014
Revenue, Gross Margin, EBITDA Margin of INNOLUX, 4Q2012-3Q2014
Total Debt and Debt Ratios of INNOLUX, 4Q2012-3Q2014
Inventory Trend of INNOLUX, 4Q2012-3Q2014
Area Shipments and TFT LCD ASP Trend of INNOLUX, 4Q2012-3Q2014
Small & Medium Size Unit Shipments and Sales Trend of INNOLUX, 4Q2012-3Q2014
Sales Breakdown of INNOLUX by Application, 4Q2012-3Q2014
Sales Breakdown of INNOLUX by Size, 4Q2012-3Q2014
TFT-LCD Fabs Profile of INNOLUX
Profile of Touch Sensor Fabs
Revenue and Operating Margin of LG Display, 2009-2015E
Quarterly Revenue and Gross Margin of LG Display, 1Q2013-3Q2014
IFRS Statements of Financial Position of LG Display, 2012-2014
Shipments of LG Display by Application, 2009-2013
Revenue Breakdown of LG Display by Application, 2009-2013
Revenue Breakdown of LG Display by Region, 2011-2013
Quarterly Shipments and ASP of LG Display, 3Q2013-3Q2014
Quarterly Revenue of LG Display by Application, 3Q2013-3Q2014
Quarterly Revenue of LG Display by Area, 3Q2013-3Q2014
Fabs Capacity List of LG Display
Fabs Capacity of LG Display, 2011-2013
Footprint of LG Display
Manufacturing Base Footprint of LG Display
Organization Chart of Nanjing CEC Panda LCD Technology
Raw Material Purchases of Nanjing CEC Panda LCD Technology, 2013
Suppliers of Raw Material for Nanjing CEC Panda LCD Technology, 2013
Top5 Customers of Nanjing CEC Panda LCD Technology, 2013
Revenue and Operating Profit of BOE, 2008-2014
Milestone of BOE
Manufacturing Base Footprint of BOE
Quarterly Revenue of BOE, 1Q10-3Q14
Snapshot of Financial Position of BOE’s Main Subsidiaries, 2013
Revenue and Operating Margin of Sharp, FY2008-FY2015
Revenue Breakdown of Sharp by Business, FY2013-FY2015
Operating Margin of Sharp by Business, FY2013-FY2015
Resolution of Sharp Mobile Phone Panels, 2013-2014
Production Line List of Sharp
Revenue and Operating Margin of Samsung Display, 2010-2015E
Revenue Breakdown of Samsung Display by Product, 2010-2015E
Operating Profit Breakdown of Samsung Display by Product, 2012-2015E
Production Line List of Samsung
Revenue and Operating Margin of CPT, 2007-2014
Production Line List of CPT
Revenue and Operating Margin of Hannstar, 2006-2014
Distribution of Hannstar’s Production Bases
Revenue and Operating Margin of Tianma Micro-electronics, 2005-2014
Organization Chart of Tianma Micro-electronics
List of Tianma Micro-electronics’ Production Lines
Capacity, Output and Utilization of Tianma Micro-electronics’ Subsidiaries, 2012-2013
Customer Distribution of Tianma Micro-electronics, 2012-2013
Capacity of Tianma Micro-electronics
JDI Group in Transition
Quarterly Revenue Breakdown of JDI by Business, 2Q2013-2Q2014
Quarterly Operating Margin of JDI by Business, 2Q2013-2Q2014
Customer Distribution of JDI by Region, 1Q2013-4Q2014
Shipments of JDI by Resolution, 2014
Business Model of JDI
Monthly Revenue of STC, Oct. 2012-Oct. 2014
Revenue and Operating Margin of Truly International, 2005-2014
Quarterly Revenue and Gross Margin of Truly International, 1Q2013-4Q2014
LCD Business Revenue Breakdown of Truly International by Technology, 2006-2011
Revenue of Truly Semiconductors by Business, 2012-2015E
Shipments Breakdown of Truly Semiconductors by Product, 2012-2015
ASP of Truly Semiconductors by Product, 2012-2015
Main Customers of Truly’s Mobile Phone LCD
Main Customers of Truly’s Auto Display
Touch Screen Capacity of Truly
Customers of Truly’s CCM
Revenue and Gross Margin of Giantplus, 2005-2014
Monthly Revenue of Giantplus, Oct.2012-Oct.2014
如果这份报告不能满足您的要求,我们还可以为您定制报告,请 留言说明您的详细需求。
|