|
|
|
报告导航:研究报告—
TMT产业—电信
|
|
2014-2017年全球及同轴射频电缆行业研究报告 |
 |
字数:1.7万 |
页数:68 |
图表数:73 |
|
中文电子版:6000元 |
中文纸版:3000元 |
中文(电子+纸)版:6500元 |
|
英文电子版:1600美元 |
英文纸版:1700美元 |
英文(电子+纸)版:1900美元 |
|
编号:LT-028
|
发布日期:2014-12 |
附件:下载 |
 |
|
|
受发展中国家移动电话用户快速增长和3G、4G网络逐渐取代2G等利好因素影响,全球射频同轴电缆市场规模不断增长。2007-2013年全球射频同轴电缆市场规模年均增速达8.4%,2013年其规模为42.9亿美元。
在国家政策的强力带动下,宽带网络、新一代移动通信、云计算、高速率信息传导等新业务正在推动中国通信行业加速升级换代。目前中国已普及2G网络,2013年其射频同轴电缆市场规模达396.3亿元。
工信部于2010年发放了3G牌照,2013年又发放了TD-LTE制式的4G牌照和FDD-LTE制式的试验牌照,中国移动通信行业正逐步由2G向3G/4G过渡,预计2017年中国仅4G用户就将达到4.4亿。而这将促使三大运营商积极投入LTE基站建设,进而推动射频同轴电缆的需求增长。2014年中国移动通信用射频同轴电缆需求量在56万公里左右,同比增长8%。
目前中国的射频同轴电缆整体技术水平还较低,低端市场的同质化明显,价格战成为其主要竞争手段。但少数研发实力强的本土企业已在半柔、低损及轧纹等高端领域实现批量生产,产品进口替代率逐步增加。
金信诺是中国半柔电缆市场的领军企业,2013年占据近40%的市场份额;在低损电缆细分市场排名第二。除金信诺外,中国半柔电缆市场大部分份额仍被外资企业占据。
亨鑫科技是中国轧纹电缆市场最大的供应商,2013年其市场份额为36.4%;射频同轴电缆业务收入为9.33亿元,占其营收的3/4以上。目前公司移动通信用射频同轴电缆年产能为148770公里。
水清木华研究中心《2014-2017年全球及中国射频同轴电缆行业研究报告》着重研究了以下内容:
 全球射频同轴电缆市场规模、主要国家(包括巴西、印度、俄罗斯等)射频同轴电缆需求分析等;中国射频同轴电缆市场规模、需求、细分市场(包括半柔、低损、轧纹及稳相等)市场需求及竞争格局分析等; 全球射频同轴电缆市场规模、主要国家(包括巴西、印度、俄罗斯等)射频同轴电缆需求分析等;中国射频同轴电缆市场规模、需求、细分市场(包括半柔、低损、轧纹及稳相等)市场需求及竞争格局分析等;
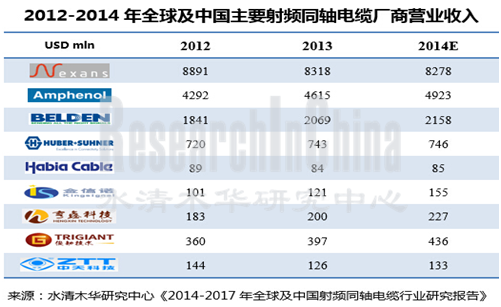
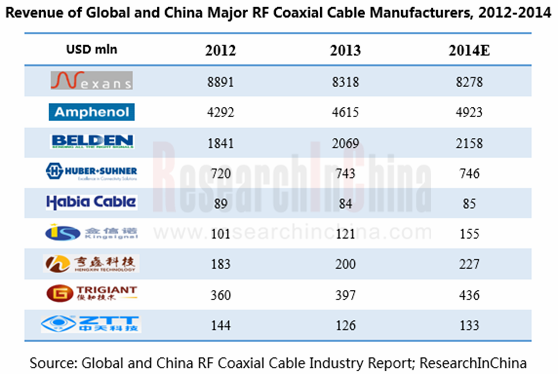
全球8家射频同轴电缆企业(包括百通、哈博、安费诺、耐克森等)运营情况及在华业务分析等;
中国8家射频同轴电缆企业(包括攀金信诺、亨鑫科技、俊知集团等)经营情况及射频同轴电缆业务分析等。
Benefiting from a surge in mobile phone users and gradual replacement of 2G by 3G and 4G in developing countries, global RF coaxial cable market size has been growing, registering an average annual growth rate of 8.4% during 2007-2013 and coming to USD 4.29 billion in 2013.
Powerfully driven by national policies, new businesses like broadband network, new generation mobile communications, cloud computing, and high-speed information transmission are accelerating the upgrading of China’s communications industry. 2G network has become very popular in China, and RF coaxial cable market in the country was worth RMB 39.63 billion in 2013.
The Ministry of Industry and Information Technology (MIIT) issued 3G licenses in 2010, TD-LTE 4G license and FDD-LTE trial license in 2013. China’s mobile communications industry is transiting from 2G to 3G/4G, and 4G subscribers in China are estimated to reach 440 million in 2017, which will push three major operators into building more LTE base stations, thus further promoting the demand for RF coaxial cable. In 2014, the demand for RF coaxial cable for mobile communications approximated 560,000 km, up 8% from the previous year.
At present, overall technological level of RF coaxial cable in China still desires to be much improved, highly homogenized in low end market and with price war as major means of competition. However, some local companies with strong R&D capabilities have achieved mass production in high-end fields, such as semi-flexible, low loss and corrugated, leading to a gradual increase in substitution for imported products.
Kingsignal Technology Co., Ltd. is a leader in the Chinese semi-flexible cable market, occupying nearly 40% market share and ranking second in low-loss cable market segment in 2013. Besides Kingsignal Technology, the Chinese semi-flexible cable market is largely dominated by foreign-funded companies.
Jiangsu Hengxin Technology Co., Ltd., the largest supplier in the Chinese corrugated cable market, took up 36.4% market share and posted revenue of RMB 933 million from RF coaxial cable business in 2013, over 3/4 of its total revenue. The company now has RF coaxial cable for mobile communications capacity of 148,770 km/a.
Global and China RF Coaxial Cable Industry Report, 2014-2017 by ResearchInChina focuses on the following:
 Global RF coaxial cable market size, demand for RF coaxial cable in main countries (including Brazil, India and Russia); Global RF coaxial cable market size, demand for RF coaxial cable in main countries (including Brazil, India and Russia);
Chinese RF coaxial cable market size, demand, market segments (including semi flexible, low loss, corrugated and phase-compensated) demand, and competitive landscape;
Operation and business in China of 8 global RF coaxial cable companies (covering Belden, Habia, Amphenol and Nexans);
Operation and RF coaxial cable business of 8 Chinese RF coaxial cable companies (including Kingsignal, Hengxin Technology and Trigiant Group).
第一章 行业概述
1.1 定义及分类
1.1.1 定义
1.1.2 分类
1.2 产业链
第二章 射频同轴电缆市场分析
2.1 全球市场概况
2.2 中国市场分析
2.2.1 市场概况
2.2.2 市场规模
2.2.3 需求
2.2.4 市场竞争特点
第三章 细分市场
3.1半柔电缆
3.1.1 市场需求
3.1.2 竞争格局
3.2低损电缆
3.2.1 市场需求
3.2.2 竞争格局
3.3 轧纹电缆
3.3.1 市场需求
3.3.2 竞争格局
3.4稳相电缆
3.4.1 市场需求
3.4.2 竞争格局
3.5微细同轴电缆
3.5.1 市场需求
3.5.2 竞争格局
第四章 全球主要射频同轴电缆企业
4.1百通
4.1.1 企业简介
4.1.2 企业经营
4.1.3 营收构成
4.1.4 在华业务
4.2戈尔
4.3哈博
4.3.1 企业简介
4.3.2 企业经营
4.3.3 营收构成
4.3.4 在华业务
4.4时代微波
4.5安费诺
4.5.1 企业简介
4.5.2 企业经营
4.5.3 营收构成
4.5.4 在华业务
4.6安德鲁
4.6.1 企业简介
4.6.2 在华业务
4.7耐克森
4.7.1 公司简介
4.7.2 企业经营
4.7.3 营收构成
4.7.4 在华业务
4.8灏讯
4.8.1 企业简介
4.8.2 企业经营
4.8.3 营收构成
4.8.3 在华业务
第五章 中国主要射频同轴电缆企业
5.1 金信诺
5.1.1 企业简介
5.1.2 企业经营
5.1.3 营收构成
5.1.4 毛利率
5.1.5 客户与供应商
5.1.6 射频同轴电缆业务
5.2 亨鑫科技
5.2.1 企业简介
5.2.2 企业经营
5.2.3 营收构成
5.2.4 毛利率
5.2.5 客户及供应商
5.2.6 射频同轴电缆业务
5.3 俊知集团
5.3.1 企业简介
5.3.2 企业经营
5.3.3 营收构成
5.3.4 毛利率
5.3.5 客户与供应商
5.3.6 射频同轴电缆业务
5.4 珠海汉胜科技股份有限公司
5.4.1 企业简介
5.4.2 企业经营
5.5 中天日立射频
5.5.1 企业简介
5.5.2 企业经营
5.5.3 射频同轴电缆业务
5.6 其他企业
5.6.1新泰爱克电缆有限公司
5.6.2成都中菱无线通信电缆有限公司
5.6.3天津609电缆有限公司
第六章 总结与预测
6.1 总结
6.2 预测
1. Industry Overview
1.1 Definition and Classification
1.1.1 Definition
1.1.2 Classification
1.2 Industry Chain
2. RF Coaxial Cable Market
2.1 Global
2.2 China
2.2.1 Market Overview
2.2.2 Market Size
2.2.3 Demand
2.2.4 Characteristics of Market Competition
3. Market Segments
3.1 Semi-flexible Cable
3.1.1 Market Demand
3.1.2 Competitive Landscape
3.2 Low Loss Cable
3.2.1 Market Demand
3.2.2 Competitive Landscape
3.3 Corrugated Cable
3.3.1 Market Demand
3.3.2 Competitive Landscape
3.4 Phase-compensated Cable
3.4.1 Market Demand
3.4.2 Competitive Landscape
3.5 Micro Coaxial Cable
3.5.1 Market Demand
3.5.2 Competitive Landscape
4. Major Global RF Coaxial Cable Companies
4.1 Belden
4.1.1 Profile
4.1.2 Operation
4.1.3 Revenue Structure
4.1.4 Business in China
4.2 Gore
4.3 Habia
4.3.1 Profile
4.3.2 Operation
4.3.3 Revenue Structure
4.3.4 Business in China
4.4 Times Microwave Systems
4.5 Amphenol
4.5.1 Profile
4.5.2 Operation
4.5.3 Revenue Structure
4.5.4 Business in China
4.6 Andrew
4.6.1 Profile
4.6.2 Business in China
4.7 Nexans
4.7.1 Profile
4.7.2 Operation
4.7.3 Revenue Structure
4.7.4 Business in China
4.8 HUBER+SUHNER
4.8.1 Profile
4.8.2 Operation
4.8.3 Revenue Structure
4.8.3 Business in China
5. Major Chinese RF Coaxial Cable Companies
5.1 Kingsignal Technology Co., Ltd.
5.1.1 Profile
5.1.2 Operation
5.1.3 Revenue Structure
5.1.4 Gross Margin
5.1.5 Customers and Suppliers
5.1.6 RF Coaxial Cable Business
5.2 Jiangsu Hengxin Technology Co., Ltd.
5.2.1 Profile
5.2.2 Operation
5.2.3 Revenue Structure
5.2.4 Gross Margin
5.2.5 Customers and Suppliers
5.2.6 RF Coaxial Cable Business
5.3 Trigiant Group
5.3.1 Profile
5.3.2 Operation
5.3.3 Revenue Structure
5.3.4 Gross Margin
5.3.5 Customers and Suppliers
5.3.6 RF Coaxial Cable Business
5.4 Zhuhai Hanseng Technology Co., Ltd.
5.4.1 Profile
5.4.2 Operation
5.5 Zhongtian Hitachi RF Cable Co., Ltd.
5.5.1 Profile
5.5.2 Operation
5.5.3 RF Coaxial Cable Business
5.6 Other Companies
5.6.1 Acome Xintai Cables Co., Ltd.
5.6.2 Chengdu Zhongling Radio Communications
5.6.3 Tianjin 609 Cable Co., Ltd.
6. Summary and Forecast
6.1 Summary
6.2 Forecast
图:射频同轴电缆结构图
表 :射频同轴电缆分类
图:2007-2014年全球射频同轴电缆市场规模
图:2006-2014年全球2G用射频同轴电缆市场规模
图:2006-2014年全球3G用射频同轴电缆市场规模
图:2006-2014年印度射频同轴电缆需求量
图:2006-2014年巴西射频同轴电缆需求量
图:2006-2014年俄罗斯射频同轴电缆需求量
图:2007-2014年中国射频同轴电缆市场规模
图:2011 -2015年中国移动通信用射频同轴电缆产量及需求量
图:2007-2013年中国手机及笔记本电脑产品射频同轴电缆需求规模
图:2007-2014年全球移动通信半柔电缆市场容量
图:2007-2014年中国移动通信半柔电缆市场容量
图:2013年中国半柔电缆市场主要企业市场份额
图 :2007-2014年全球低损电缆市场容量
图:2007-2014年中国低损电缆市场容量
表:2013年中国低损电缆主要企业市场份额
图 :2007-2014年全球轧纹电缆市场容量
图:2007-2013E年中国轧纹电缆市场容量
表:2013年中国轧纹电缆主要企业市场份额
图 :2007-2014年全球稳相电缆市场容量
图:2007-2014年中国稳相电缆市场容量
表:2013年全球稳相电缆主要企业市场份额
图:2007-2014年全球微细同轴传输器件市场容量
图:2007-2014年中国微细同轴电缆市场容量
表:2013年中国微细同轴电缆主要企业市场份额
图:2009-2014年百通营业收入及营业利润
图:2011-2013年百通(分产品)营收占比
图 :2011-2013年百通(分地区)营收占比
表:百通在华子公司
表 :戈尔公司在华机构
图:2009-2013年哈博净收入及净利润
图:2009-2013年哈博公司营业利润率
图 :2013年哈博电缆产品(分行业)营收占比
图 :2013年哈博(分地区)营收占比
图:2009-2014年安费诺净收入及净利润
图: 2011-2013年安费诺(分产品)营收占比
图:2011-2013年安费诺(分地区)营收占比
图:2009-2014年耐克森营业收入及净利润
图:2013年耐克森(分业务)营收占比
图 :2013年耐克森(分地区)营收占比
表:耐克森在中国发展历程
图:2009-2014年灏讯营业收入及净利润
图:2009-2014年灏讯在手订单
图 :2013年灏讯(分产品)营收占比
图 :2013年灏讯(分产品)在手订单占比
图 :2013年灏讯(分地区)营收占比
图:2009-2014年金信诺营业收入及净利润
图:2009-2014年金信诺(分地区)营收占比
图:2009-2013年金信诺(分产品)营收占比
图:2009-2013年金信诺(分产品)毛利率
图:2009-2014年金信诺前五名供应商合计采购金额及占比
图:2008-2014年金信诺前五名客户合计营业收入及占比
图:2009-2014年金信诺射频同轴电缆销量
图:2009-2013年金信诺主要射频同轴电缆产品收入
图:2009-2014年亨鑫科技营业收入及净利润
图:2009-2013年亨鑫科技(分产品)营收占比
图:2013年亨鑫科技(分地区)营收占比
图:2009-2013年金信诺毛利率及净利率
图:2009-2013年亨鑫科技前五名客户合计营收占比
图:2010-2013年亨鑫科技前五名供应商合计采购金额占比
图:2009-2014年俊知集团营业收入及净利润
图 :2010-2014年俊知集团(分产品)营收占比
图:2010-2014年俊知集团(分产品)毛利率
图:2010-2013年俊知集团前五名客户合计营收占比
图:2010-2013年俊知集团前五名供应商合计采购金额占比
表:2009-2014年俊知集团射频同轴电缆销量
表:2009-2013年俊知集团射频同轴电缆产能
图:2009-2014年中天日立射频营业收入及净利润
图:2012-2013年中天日立射频产品产销量
图:2009-2014年中天日立射频产品毛利率
图:2009-2013年全球及中国主要射频同轴电缆厂商毛利率
图:2013-2017年中国射频同轴电缆市场规模
Structure of RF Coaxial Cable
Classification of RF Coaxial Cable
Global RF Coaxial Cable Market Size, 2007-2014
Global Market Size of RF Coaxial Cable for 2G Network, 2006-2014
Global Market Size of RF Coaxial Cable for 3G Network, 2006-2014
Demand for RF Coaxial Cable in India, 2006-2014
Demand for RF Coaxial Cable in Brazil, 2006-2014
Demand for RF Coaxial Cable in Russia, 2006-2014
Chinese RF Coaxial Cable Market Size, 2007-2014
Output of and Demand for RF Coaxial Cable for Mobile Communications in China, 2011-2015
Demand for RF Coaxial Cable for Mobile Phone and Notebook PC in China, 2007-2013
Global Market Capacity of Semi-flexible Cable for Mobile Communications, 2007-2014
Market Capacity of Semi-flexible Cable for Mobile Communications in China, 2007-2014
Market Share of Major Semi-flexible Cable Companies in China, 2013
Global Market Capacity of Low Loss Cable, 2007-2014
Market Capacity of Low Loss Cable in China, 2007-2014
Market Share of Major Low Loss Cable Companies in China, 2013
Global Market Capacity of Corrugated Cable, 2007-2014
Market Capacity of Corrugated Cable in China, 2007-2013E
Market Share of Major Corrugated Cable Companies in China, 2013
Global Market Capacity of Phase-compensated Cable, 2007-2014
Market Capacity of Phase-compensated Cable in China, 2007-2014
Market Share of Major Global Phase-compensated Cable Companies, 2013
Global Market Capacity of Micro Coaxial Cable, 2007-2014
Market Capacity of Micro Coaxial Cable in China, 2007-2014
Market Share of Major Micro Coaxial Cable Companies in China, 2013
Revenue and Operating Income of Belden, 2009-2014
Revenue Structure of Belden by Product, 2011-2013
Revenue Structure of Belden by Region, 2011-2013
Subsidiaries of Belden in China
Organizations of Gore in China
Net Revenue and Net Income of Habia, 2009-2013
Operating Margin of Habia, 2009-2013
Structure of Habia’s Revenue from Cable Products (by Sector), 2013
Revenue Structure of Habia by Region, 2013
Net Revenue and Net Income of Amphenol, 2009-2014
Revenue Structure of Amphenol by Product, 2011-2013
Revenue Structure of Amphenol by Region, 2011-2013
Revenue and Net Income of Nexans, 2009-2014
Revenue Structure of Nexans by Business, 2013
Revenue Structure of Nexans by Region, 2013
Development History of Nexans in China
Revenue and Net Income of HUBER+SUHNER, 2009-2014
Backlog Orders of HUBER+SUHNER, 2009-2014
Revenue Structure of HUBER+SUHNER by Product, 2013
Structure of Backlog Orders of HUBER+SUHNER by Product, 2013
Revenue Structure of HUBER+SUHNER by Region, 2013
Revenue and Net Income of Kingsignal, 2009-2014
Revenue Structure of Kingsignal by Region, 2009-2014
Revenue Structure of Kingsignal by Product, 2009-2013
Gross Margin of Kingsignal by Product, 2009-2013
Kingsignal’s Procurement from Top 5 Suppliers and % of Total Procurement, 2009-2014
Kingsignal’s Revenue from Top 5 Customers and % of Total Revenue, 2008-2014
RF Coaxial Cable Sales Volume of Kingsignal, 2009-2014
Kingsignal’s Revenue from Main RF Coaxial Cable Products, 2009-2013
Revenue and Net Income of Hengxin Technology, 2009-2014
Revenue Structure of Hengxin Technology by Product, 2009-2013
Revenue Structure of Hengxin Technology by Region, 2013
Gross Margin and Net Profit Margin of Hengxin Technology, 2009-2013
Hengxin Technology’s Revenue from Top 5 Customers and % of Total Revenue, 2009-2013
Hengxin Technology’s Procurement from Top 5 Suppliers and % of Total Procurement, 2010-2013
Revenue and Net Income of Trigiant Group, 2009-2014
Revenue Structure of Trigiant Group by Product, 2010-2014
Gross Margin of Trigiant Group by Product, 2010-2014
Trigiant Group’s Revenue from Top 5 Customers and % of Total Revenue, 2010-2013
Trigiant Group’s Procurement from Top 5 Suppliers and % of Total Procurement, 2010-2013
RF Coaxial Cable Sales Volume of Trigiant Group, 2009-2014
RF Coaxial Cable Capacity of Trigiant Group, 2009-2013
Revenue and Net Income of Zhongtian Hitachi RF Cable, 2009-2014
Output and Sales Volume of Zhongtian Hitachi RF Cable, 2012-2013
Gross Margin of Zhongtian Hitachi RF Cable, 2009-2014
Gross Margin of Major Global and Chinese RF Coaxial Cable Companies, 2009-2013
Chinese RF Coaxial Cable Market Size, 2013-2017E
如果这份报告不能满足您的要求,我们还可以为您定制报告,请 留言说明您的详细需求。
|