|
|
|
报告导航:研究报告—
农业与食品—食品饮料
|
|
2014-2017年中国液态奶行业研究报告 |
 |
字数:3.1万 |
页数:110 |
图表数:139 |
|
中文电子版:7500元 |
中文纸版:3750元 |
中文(电子+纸)版:8000元 |
|
英文电子版:2350美元 |
英文纸版:2500美元 |
英文(电子+纸)版:2650美元 |
|
编号:ZLC-012
|
发布日期:2014-12 |
附件:下载 |
 |
|
|
受中国经济发展、人们生活水平提高及膳食结构改善等诸多利好因素带动,近年中国乳制品产需明显上升。2004-2013年,中国乳制品产量年均复合增长率达12.3%。中国乳制品以液态奶为主,2013年,国液态奶产量达2336万吨,占乳制品产量的86.6%,零售额达1503亿元。预计2017年,中国液态奶产量有望达到3546万吨,零售额达2199亿元。
中国液态奶分为高端液态奶和普通液态奶。高端液态奶包括蒙牛的特仑苏、伊利的金典系列和营养舒化奶、光明的优倍和优+系列、三元的极致系列和特供专用纯牛奶产品等。近年,中国高端液态奶需求增长明显高于普通奶。2013年,中国高端液态奶零售额为434亿元,同比增长25.4%,占液态奶零售总额的28.9%。预计到2017年,高端液态奶的零售额将达706亿元,所占比重将提升至32.1%。
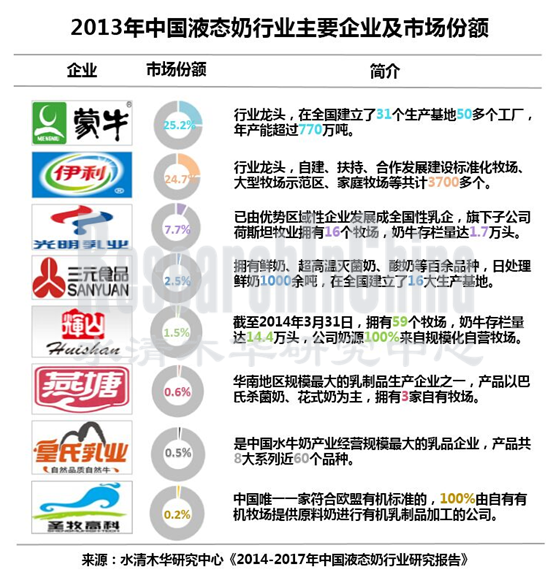
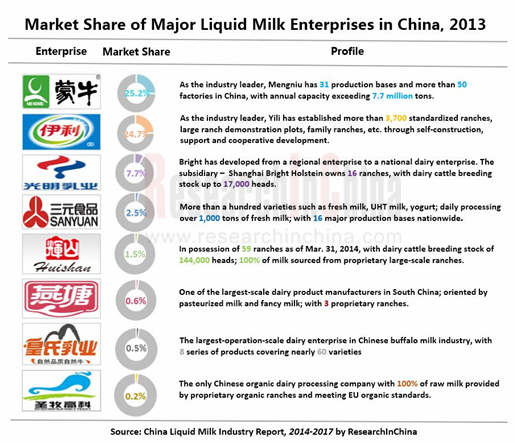
目前,中国液态奶行业已形成了寡头垄断局面,蒙牛和伊利占据着市场的半壁江山。2013年,蒙牛和伊利液态奶市场份额分别为25.2%和24.7%;光明乳业市场份额为7.7%,排名第三。而燕塘乳业、皇氏乳业、现代牧业和中国圣牧的市场占有率均低于1%。
并且,本土液态奶企业正尝试通过与国外乳企合作代工的方式,解决中国奶源缺乏的问题。
2013年底,伊利与意大利最大乳品生产商斯嘉达公司达成战略合作伙伴关系,后者将为伊利生产UHT乳制品,以扩充伊利的高端产品线。2014年4月,光明乳业与澳大利亚Pactum乳业集团签订产品代加工协议,由后者代为其加工UHT牛奶。
鉴于中国液态奶需求前景良好,一些跨国乳企开始抢滩中国液态奶市场。2013年8月,新西兰乳业巨头——恒天然集团在中国推出“安佳牌”常温奶;2013年11月,日本明治乳业在中国推出市售型低温牛奶、酸奶产品;2014年2月,意大利牛奶生产商——Centrale Latte Torino的超高温灭菌牛奶和以大豆为原料的饮料制品在华上市。
《2014-2017年中国液态奶行业研究报告》包括以下内容:
 中国液态奶行业发展现状、市场规模、竞争格局、主要企业经营对比、进出口分析等; 中国液态奶行业发展现状、市场规模、竞争格局、主要企业经营对比、进出口分析等;
中国液态奶行业相关政策、上下游情况分析及发展预测等;
13家中国液态奶主要企业的经营情况及液态奶业务介绍等;
Driven by China's economic development, the improvement of people's living standards, the adjustment of dietary structure and many other positive factors, China’s dairy product output and demand have increased significantly in recent years. In 2004-2013, China’s dairy product output grew at a CAGR of 12.3%. Chinese dairy products are represented by liquid milk, whose output and retail sales reached 23.36 million tons (accounting for 86.6% of China’s dairy product output) and RMB150.3 billion respectively in 2013. It is projected that China’s liquid milk output and retail sales will hit 35.46 million tons and RMB219.9 billion separately in 2017.
Chinese liquid milk falls into high-end and ordinary liquid milk. High-end liquid milk includes Mengniu’s Telunsu, Yili's Satine and Shuhua Milk, Bright Dairy & Food’s UBEST and U+, Sanyuan’s Extreme and special pure milk products. In recent years, China’s demand for high-end liquid milk has been growing faster than ordinary milk apparently. In 2013, Chinese high-end liquid milk triggered retail sales of RMB43.4 billion, rising 25.4% year on year and occupying 28.9% of the total. In 2017, the retail sales of high-end liquid milk will jump to RMB70.6 billion, equivalent to 32.1% of the total.
At present, China liquid milk industry has formed an oligopolistic pattern, wherein Mengniu and Yili dominate half of the market. In 2013, Mengniu and Yili seized the respective share of 25.2% and 24.7% in the liquid milk market, followed by the third-ranked Bright Dairy & Food with 7.7%. Each of Yantang Dairy, Royal Dairy, Modern Farming and China Shengmu only obtained less than 1%.
Also, Chinese local liquid milk companies are trying to cooperate with foreign counterparts to solve milk source problems.
At the end of 2013, Yili and Italy's largest dairy producer - Sterilgarda Alimenti entered into a strategic partnership. Under the agreement, Sterilgarda Alimenti produces UHT dairy products for Yili to help it expand high-end product lines. In April 2014, Bright Dairy & Food and Pactum Australia signed a processing agreement that the latter should process UHT milk for the former.
Given the favorable demand outlook for Chinese liquid milk, some multinational liquid milk companies have targeted at the Chinese market. In August 2013, New Zealand’s dairy giant - Fonterra launched "Anchor" UHT milk. In November 2013, Japan's Meiji Dairies unveiled pasteurized milk and yogurt products in China. In February 2014, Italy’s Centrale Latte Torino released UHT milk and soy-based beverage products in China.
The report includes the following aspects:
Status quo, market size, competition pattern, operation comparison among major enterprises, import and export of China liquid milk industry;
Policies, upstream, downstream and development forecast of China liquid milk industry;
Operation and liquid milk business of 13 Chinese liquid milk companies.
第一章 概述
1.1 定义
1.2 分类
1.3 产业链
第二章 中国液态奶行业发展概况
2.1 发展现状
2.2 相关政策
2.3 市场规模
2.4 竞争格局
2.5 进出口
2.5.1 进口
2.5.2 出口
2.6 发展趋势
2.6.1 利好政策和市场需求推动行业发展
2.6.2 全国性和区域性液态奶企业相互依存、共同发展
2.6.3 进口液态奶份额提升
第三章 中国液态奶行业上下游情况
3.1 上游
3.2 下游
第四章 主要企业
4.1 伊利
4.1.1 公司简介
4.1.2 经营情况
4.1.3 营收构成
4.1.4 毛利率
4.1.5 研发与投资
4.1.6 液态奶业务
4.1.7 预测与展望
4.2 蒙牛
4.2.1 公司简介
4.2.2 经营情况
4.2.3 营收构成
4.2.4 毛利率
4.2.5 研发与投资
4.2.6 液态奶业务
4.2.7 预测与展望
4.3 光明乳业
4.3.1 公司简介
4.3.2 经营情况
4.3.3 营收构成
4.3.4 毛利率
4.3.5 研发与投资
4.3.6 液态奶业务
4.3.7 预测与展望
4.4 三元股份
4.4.1 公司简介
4.4.2 经营情况
4.4.3 营收构成
4.4.4 毛利率
4.4.5 研发与投资
4.4.6 液态奶业务
4.4.7 预测与展望
4.5 皇氏乳业
4.5.1 公司简介
4.5.2 经营情况
4.5.3 营收构成
4.5.4 毛利率
4.5.5 研发与投资
4.5.6 液态奶业务
4.5.7 预测与展望
4.6 燕塘乳业
4.6.1 公司简介
4.6.2 经营情况
4.6.3 营收构成
4.6.4 毛利率
4.6.5 研发与投资
4.6.6 供销情况
4.7 辉山乳业
4.7.1 公司简介
4.7.2 经营情况
4.7.3 营收构成
4.7.4 毛利率
4.7.5 研发与投资
4.7.6 液态奶业务
4.7.7 预测与展望
4.8 新希望乳业
4.8.1 公司简介
4.8.2 经营情况
4.8.3 投资发展
4.9 现代牧业
4.9.1 公司简介
4.9.2 经营情况
4.9.3 营收构成
4.9.4 毛利率
4.9.5 投资发展
4.9.6 液态奶业务
4.9.7 预测与展望
4.10 中国圣牧
4.10.1 公司简介
4.10.2 经营情况
4.10.3 营收构成
4.10.4 毛利率
4.10.5 液态奶业务
4.10.6 研发与投资
4.10.7 预测与展望
4.11 其他企业
4.11.1 完达山
4.11.2 夏进乳业
4.11.3 佳宝乳业
第五章 预测与展望
5.1 液态奶行业预测
5.2 主要企业经营对比
5.2.1 营业收入
5.2.2 净利润
5.2.3 净利润率
5.2.4 毛利率
5.2.5 液态奶业务
1 Overview
1.1 Definition
1.2 Classification
1.3 Industry Chain
2 Development of China Liquid Milk Industry
2.1 Status Quo
2.2 Policy
2.3 Market Size
2.4 Competition Pattern
2.5 Import and Export
2.5.1 Import
2.5.2 Export
2.6 Development Trend
2.6.1 Favorable Policies and Market Demand Promote the Development of the Industry
2.6.2 National and Regional Liquid Milk Enterprises Depend on Each Other and Develop Together
2.6.3 The Share of Imported Liquid Milk Rises
3 Upstream and Downstream of China Liquid Milk Industry
3.1 Upstream
3.2 Downstream
4 Major Enterprises
4.1 Yili
4.1.1 Profile
4.1.2 Operation
4.1.3 Revenues Structure
4.1.4 Gross Margin
4.1.5 R&D and Investment
4.1.6 Liquid Milk Business
4.1.7 Forecast and Outlook
4.2 Mengniu
4.2.1 Profile
4.2.2 Operation
4.2.3 Revenues Structure
4.2.4 Gross Margin
4.2.5 R&D and Investment
4.2.6 Liquid Milk Business
4.2.7 Forecast and Outlook
4.3 Bright Dairy & Food
4.3.1 Profile
4.3.2 Operation
4.3.3 Revenues Structure
4.3.4 Gross Margin
4.3.5 R&D and Investment
4.3.6 Liquid Milk Business
4.3.7 Forecast and Outlook
4.4 Sanyuan
4.4.1 Profile
4.4.2 Operation
4.4.3 Revenues Structure
4.4.4 Gross Margin
4.4.5 R&D and Investment
4.4.6 Liquid Milk Business
4.4.7 Forecast and Outlook
4.5 Royal Dairy
4.5.1 Profile
4.5.2 Operation
4.5.3 Revenues Structure
4.5.4 Gross Margin
4.5.5 R&D and Investment
4.5.6 Liquid Milk Business
4.5.7 Forecast and Outlook
4.6 Yantang Dairy
4.6.1 Profile
4.6.2 Operation
4.6.3 Revenues Structure
4.6.4 Gross Margin
4.6.5 R&D and Investment
4.6.6 Supply and Marketing
4.7 Huishan Dairy
4.7.1 Profile
4.7.2 Operation
4.7.3 Revenues Structure
4.7.4 Gross Margin
4.7.5 R&D and Investment
4.7.6 Liquid Milk Business
4.7.7 Forecast and Outlook
4.8 New Hope Dairy
4.8.1 Profile
4.8.2 Operation
4.8.3 Investment and Development
4.9 Modern Farming
4.9.1 Profile
4.9.2 Operation
4.9.3 Revenues Structure
4.9.4 Gross Margin
4.9.5 Investment and Development
4.9.6 Liquid Milk Business
4.9.7 Forecast and Outlook
4.10 China Shengmu
4.10.1 Profile
4.10.2 Operation
4.10.3 Revenues Structure
4.10.4 Gross Margin
4.10.5 Liquid Milk Business
4.10.6 R&D and Investment
4.10.7 Forecast and Outlook
4.11 Others
4.11.1 Wondersun
4.11.2 Xiajin Milk
4.11.3 Jiabao Milk
5 Forecast and Outlook
5.1 Forecast for Liquid Milk Industry
5.2 Operation Comparison among Major Companies
5.2.1 Revenue
5.2.2 Net Income
5.2.3 Net Profit Margin
5.2.4 Gross Margin
5.2.5 Liquid Milk Business
表:液态奶分类(按成品组成成分)
表:液态奶分类(按杀菌方式)
表:液态奶分类(按原料)
图:中国乳制品行业产业链
图:2007-2013年中国乳制品产量及同比增长
表:2013年中国主要乳制品产区、产量及销售收入
图:2007-2013年中国液态奶产量及同比增长率
表:2012-2013年中国液态奶产量排名前十的省份、产量及产量占比
表:2008-2014年中国乳制品行业相关政策法规
图:2007-2014年中国液态奶零售额
图:2007-2014年中国液态奶零售额(分类型)
图:2007-2014年中国液态奶零售额构成(分类型)
表:中国液态奶主要生产企业经营范围
图:2014年中国液态奶品牌口碑总指数
图:2014年中国液态奶行业主要企业美誉度指数
图:2013年中国液态奶主要企业市场占有率
图:2008-2014年中国液态奶进口量及金额
表:2013年中国液态奶主要进口来源国家进口量及金额
表:2013年中国液态奶主要进口目的地区进口量及金额
图:2008-2014年中国酸奶进口量及金额
表:2013年中国酸奶主要进口目的地区进口量及金额
图:2008-2014年中国鲜奶进口量及金额
表:2013年中国鲜奶主要进口来源国家进口量及金额
表:2013年中国鲜奶主要进口目的地区进口量及金额
图:2008-2014年中国液态奶出口量及金额
表:2013年中国液态奶主要出口目的地区出口量及出口金额
图:2008-2014年中国酸奶出口量及金额
图:2008-2014年中国鲜奶出口量及金额
图:2007-2013年中国奶牛存栏量及同比增长
图:2004-2013年中国每万人占有乳牛数量
图:2007-2013年中国牛奶产量及同比增长
表:2012-2013年中国奶牛存栏量前十的省份奶牛存栏量及占比
图:2013年中国主要液态奶企业自有牧场个数及奶牛存栏量
图:1980-2013年中国城镇和农村家庭收入及收入比
表:2005-2013年中国城镇居民家庭年平均乳制品消费支出
图:2007-2012年中国城镇居民家庭人均全年酸奶和鲜奶购买量
表:2005-2012年中国北京、上海城镇居民对鲜乳品和酸奶的人均消费支出
图:2007-2013年中国人均牛奶占有量
图:2009-2014伊利营业收入及净利润
图:2009-2014年伊利营业收入(分产品)
图:2009-2014年伊利营业收入构成(分产品)
图:2009-2014伊利营业收入(分地区)
图:2009-2014年伊利营业收入构成(分地区)
图:2009-2014年伊利毛利率
图:2009-2014年伊利毛利率(分产品)
图:2011-2014年伊利研发支出及占总营业收入比
图:2009-2014伊利液态奶营业收入、同比增长率及占总营业收入比
图:2013-2017E伊利营业收入及净利润预测
图:蒙牛生产基地位置图
图:2009-2014年蒙牛营业收入及净利润
图:2009-2014年蒙牛营业收入(分产品)
图:2009-2014蒙牛营业收入构成(分产品)
图:2009-2014年蒙牛毛利率
图:2009-2014蒙牛液态奶营业收入、同比增长率及占总营业收入比
图:2010-2014年蒙牛液态奶营业收入(分产品)
图:2010-2014年蒙牛液态奶营业收入构成(分产品)
图:2013-2017E蒙牛营业收入及净利润预测
图:2009-2014年光明乳业营业收入及净利润
图:2009-2014年光明乳业营业收入(分产品)
图:2009-2014年光明乳业营业收入构成(分产品)
图:2009-2014年光明乳业营业收入(分地区)
图:2009-2014年光明乳业营业收入构成(分地区)
图:2009-2014年光明乳业毛利率
图:2009-2014年光明乳业毛利率(分产品)
图:2011-2014年光明乳业研发支出及占总营业收入比
图:2012-2014年光明乳业液态奶营业收入及占总营业收入比
图:2013-2017E光明乳业营业收入及净利润预测
图:2009-2014年三元股份营业收入及净利润
图:2009-2014年三元股份营业收入(分产品)
图:2009-2014年三元股份营业收入构成(分产品)
图:2009-2014年三元股份营业收入(分地区)
图:2009-2014年三元股份营业收入构成(分地区)
图:2009-2014年三元股份毛利率
图:2009-2014年三元股份毛利率(分产品)
图:2011-2014年三元股份研发支出及占总营业收入比
图:2009-2014年三元股份液态奶营业收入、同比增长率及占总营业收入比
图:2013-2017E三元股份营业收入及净利润预测
图:2009-2014年皇氏乳业营业收入及净利润
图:2009-2014年皇氏乳业营业收入(分业务)
图:2009-2014年皇氏乳业营业收入构成(分业务)
图:2009-2014年皇氏乳业毛利率
图:2009-2014年皇氏乳业毛利率(分业务)
图:2011-2014年皇氏乳业研发支出及占总营业收入比
表:2013年皇氏乳业募集资金承诺项目情况
图:2009-2014年皇氏乳业液态奶营业收入、同比增长率及占总营业收入比
图:2013-2017E皇氏乳业营业收入及净利润预测
图:2011-2014年燕塘乳业营业收入及净利润
图:2011-2014年燕塘乳业营业收入(分产品)
图:2011-2014年燕塘乳业营业收入构成(分产品)
图:2011-2014年燕塘乳业营业收入(分地区)
图:2011-2014年燕塘乳业营业收入构成(分地区)
图:2011-2014年燕塘乳业毛利率
图:2011-2014年燕塘乳业毛利率(分产品)
图:2011-2014年燕塘乳业研发支出及占总营业收入比
表:燕塘乳业在研主要项目及内容
表:燕塘乳业IPO募投项目及募集资金分配
表:燕塘乳业募投项目产能(分产品)
表:2012-2014年燕塘乳业前五名客户销售金额及占主营业务收入比例
表:2012-2014年燕塘乳业前五名供应商采购金额及占采购总额比例
表:2011-2013年燕塘乳业产量、销量及产销率
图:2011-2014财年辉山乳业营业收入及净利润
图:2011-2014财年辉山乳业营业收入(分业务)
图:2011-2014财年辉山乳业营业收入构成(分业务)
图:2011-2014财年辉山乳业毛利率
图:2011-2014财年辉山乳业毛利率(分业务)
表:2011-2014财年辉山乳业牧群规模
图:2011-2014年辉山乳业液态奶营业收入及占总营业收入比
图:2011-2014财年辉山乳业液态奶销量
图:FY2013-2017E辉山乳业营业收入及净利润预测
图:新希望品牌架构
图:2008-2014E新希望乳业营业收入
图:2014年现代牧业畜牧分布
图:现代牧业发展历程
图:FY2010-2014年现代牧业营业收入及净利润
图:2013-2014年现代牧业营业收入(分产品)
图:2013-2014年现代牧业毛利润及毛利率
图:2011-2014年现代牧业奶牛数量
图:2011-2014年现代牧业成年奶牛数量及占比
图:2012-2014年现代牧业液态奶业务销售额
表:现代牧业液态奶销售中心分布
图:2014年现代牧业液态奶KA铺货率(分地区)
图:2013-2017E现代牧业营业收入及净利润预测
图:中国圣牧产业链
图:2011-2014年中国圣牧营业收入及净利润
图:2011-2014年中国圣牧营业收入(分业务)
图:2011-2014年中国圣牧营业收入构成(分业务)
图:2012-2014年中国圣牧液态奶营业收入及占总营业收入比
图:2011-2013年中国圣牧研发支出
图:2011-2017E中国圣牧营业收入及净利润预测
图:2013-2017E中国液态奶零售额及同比增长预测
图:2013-2017E中国液态奶产量及同比增长预测
图:2013-2017E中国液态奶零售额预测(分产品)
图:2013-2017E中国液态奶零售额构成(分产品)
图:2009-2014年中国液态奶行业主要企业营业收入
图:2009-2014年中国液态奶行业主要企业净利润
图:2009-2014年中国液态奶行业主要企业净利润率
图:2009-2014年中国液态奶行业主要企业毛利率
图:2009-2014年中国液态奶行业主要企业液态奶业务营业收入
图:2009-2013年中国液态奶行业主要企业市场占有率
Classification of Liquid Milk (by Ingredient)
Classification of Liquid Milk (by Sterilization Method)
Classification of Liquid Milk (by Raw Material)
Chinese Dairy Product Industry Chain
China's Dairy Product Output and YoY Growth Rate, 2007-2013
China's Main Dairy Product Producing Areas, Output and Revenue, 2013
China's Liquid Milk Output and YoY Growth Rate, 2007-2013
Output and % of China's Top 10 Provinces by Liquid Milk Output, 2012-2013
Relevant Policies and Regulations of China's Dairy Product Industry, 2008-2014
China's Liquid Milk Retail Sales, 2007-2014
China's Liquid Milk Retail Sales (by Type), 2007-2014
China's Liquid Milk Retail Sales Structure (by Type), 2007-2014
Business Scope of Major Liquid Milk Producers in China
China's Liquid Milk Brand Reputation Index, 2014
Reputation Index of Major Companies in China Liquid Milk industry, 2014
Market Share of Major Liquid Milk Enterprises in China, 2013
China's Liquid Milk Import Volume and Value, 2008-2014
Import Volume and Value of China's Main Liquid Milk Import Sources, 2013
Import Volume and Value of China's Main Liquid Milk Importers, 2013
China's Yogurt Import Volume and Value, 2008-2014
Import Volume and Value of China's Main Yogurt Importers, 2013
China's Fresh Milk Import Volume and Value, 2008-2014
Import Volume and Value of China's Fresh Milk Import Sources, 2013
Import Volume and Value of China's Main Fresh Milk Importers, 2013
China's Liquid Milk Export Volume and Value, 2008-2014
Export Volume and Value of China’s Main Liquid Milk Export Destinations, 2013
China's Yogurt Export Volume and Value, 2008-2014
China's Fresh Milk Export Volume and Value, 2008-2014
China's Cow-on-feed Number and YoY Growth Rate, 2007-2013
China’s Cow Number per 10,000 People, 2004-2013
China’s Milk Output and YoY Growth Rate, 2007-2013
Cow-on-feed Number and % of China’s Top 10 Provinces by Cow-on-feed Number, 2012-2013
Number of Self-owned Rangelands and Cow-on-feed of Major Liquid Milk Enterprises in China, 2013
Urban & Rural Household Income and Ratio in China, 1980-2013
Annual Average Dairy Product Consumption Expenditure of Urban Households in China, 2005-2013
Per Capita Annual Consumption of Yogurt and Fresh Milk of Urban Households in China, 2007-2012
Per Capita Consumption Expenditure of Fresh Dairy Products and Yogurt of Urban Households in Beijing and Shanghai, 2005-2012
China’s Per Capita Milk Consumption, 2007-2013
Yili's Revenue and Net Income, 2009-2014
Yili's Revenue (by Product), 2009-2014
Yili's Revenue Structure (by Product), 2009-2014
Yili's Revenue (by Region), 2009-2014
Yili's Revenue Structure (by Region), 2009-2014
Yili's Gross Margin, 2009-2014
Yili's Gross Margin (by Product), 2009-2014
Yili's R&D Costs and% of Total Revenue, 2011-2014
Yili's Liquid Milk Revenue, YoY Growth Rate and % of Total Revenue, 2009-2014
Yili's Revenue and Net Income, 2013-2017E
Location of Mengniu’s Production Bases
Mengniu's Revenue and Net Income, 2009-2014
Mengniu's Revenue (by Product), 2009-2014
Mengniu's Revenue Structure (by Product), 2009-2014
Mengniu's Gross Margin, 2009-2014
Mengniu's Liquid Milk Revenue, YoY Growth Rate and % of Total Revenue, 2009-2014
Mengniu's Liquid Milk Revenue (by Product), 2010-2014
Mengniu's Liquid Milk Revenue Structure (by Product), 2010-2014
Mengniu's Revenue and Net Income, 2013-2017E
Revenue and Net Income of Bright Dairy & Food, 2009-2014
Revenue of Bright Dairy & Food (by Product), 2009-2014
Revenue Structure of Bright Dairy & Food (by Product), 2009-2014
Revenue of Bright Dairy & Food (by Region), 2009-2014
Revenue Structure of Bright Dairy & Food (by Region), 2009-2014
Gross Margin of Bright Dairy & Food, 2009-2014
Gross Margin of Bright Dairy & Food (by Product), 2009-2014
R&D Costs and % of Total Revenue of Bright Dairy & Food, 2011-2014
Liquid Milk Revenue and % of Total Revenue of Bright Dairy & Food, 2012-2014
Revenue and Net Income of Bright Dairy & Food, 2013-2017E
Sanyuan's Revenue and Net Income, 2009-2014
Sanyuan's Revenue (by Product), 2009-2014
Sanyuan's Revenue Structure (by Product), 2009-2014
Sanyuan's Revenue (by Region), 2009-2014
Sanyuan's Revenue Structure (by Region), 2009-2014
Sanyuan's Gross Margin, 2009-2014
Sanyuan's Gross Margin (by Product), 2009-2014
Sanyuan's R&D Costs and% of Total Revenue, 2011-2014
Sanyuan's Liquid Milk Revenue, YoY Growth Rate and % of Total Revenue, 2009-2014
Sanyuan’s Revenue and Net Income, 2013-2017E
Revenue and Net Income of Royal Dairy, 2009-2014
Revenue of Royal Dairy (by Business), 2009-2014
Revenue Structure of Royal Dairy (by Business), 2009-2014
Gross Margin of Royal Dairy, 2009-2014
Gross Margin of Royal Dairy (by Business), 2009-2014
R&D Costs and % of Total Revenue of Royal Dairy, 2011-2014
Committed Fund-raising Projects of Royal Dairy, 2013
Liquid Milk Revenue, YoY Growth Rate and % of Total Revenue of Royal Dairy, 2009-2014
Revenue and Net Income of Royal Dairy, 2013-2017E
Revenue and Net Income of Yantang Dairy, 2011-2014
Revenue of Yantang Dairy (by Product), 2011-2014
Revenue Structure of Yantang Dairy (by Product), 2011-2014
Revenue of Yantang Dairy (by Region), 2011-2014
Revenue Structure of Yantang Dairy (by Region), 2011-2014
Gross Margin of Yantang Dairy, 2011-2014
Gross Margin of Yantang Dairy (by Product), 2011-2014
R&D Costs and % of Total Revenue of Yantang Dairy, 2011-2014
Main Research Projects and Content of Yantang Dairy
IPO Fund-raising Investment Projects and Raised Fund Allocation of Yantang Dairy
Capacity of Fund-raising Investment Projects of Yantang Dairy (by Product), 2009-2014
Revenue of Yantang Dairy from Top 5 Clients and % of Total Revenue, 2012-2014
Procurement of Yantang Dairy from Top 5 Suppliers and % of Total Procurement, 2012-2014
Output, Sales Volume and Sales-output Ratio of Yantang Dairy, 2011-2013
Revenue and Net Income of Huishan Dairy, FY2011-2014
Revenue of Huishan Dairy (by Business), FY2011-2014
Revenue Structure of Huishan Dairy (by Business), FY2011-2014
Gross Margin of Huishan Dairy, FY2011-2014
Gross Margin of Huishan Dairy (by Business), FY2011-2014
Herd Scale of Huishan Dairy, FY2011-2014
Liquid Milk Revenue and % of Total Revenue of Huishan Dairy, 2011-2014
Liquid Milk Sales Volume of Huishan Dairy, FY2011-2014
Revenue and Net Income of Huishan Dairy, FY2013-2017E
Brand Structure of New Hope Dairy
Revenue of New Hope Dairy, 2008-2014E
Animal Husbandry Distribution of Modern Farming, 2014
Development Course of Modern Farming
Revenue and Net Income of Modern Farming, FY2010-2014
Revenue of Modern Farming (by Product), 2013-2014
Gross Profit and Gross Margin of Modern Farming, 2013-2014
Number of Cows of Modern Farming, 2011-2014
Number of Adult Cows and % of Total Cows of Modern Farming, 2011-2014
Liquid Milk Revenue of Modern Farming, 2012-2014
Distribution of Liquid Milk Sales Centers of Modern Farming
Liquid Milk KA Distribution Rate of Modern Farming (by Region), 2014
Revenue and Net Income of Modern Farming, 2013-2017E
Industry Chain of China Shengmu
Revenue and Net Income of China Shengmu, 2011-2014
Revenue of China Shengmu (by Business), 2011-2014
Revenue Structure of China Shengmu (by Business), 2011-2014
Liquid Milk Revenue and % of Total Revenue of China Shengmu, 2012-2014
R&D Costs of China Shengmu, 2011-2013
Revenue and Net Income of China Shengmu, 2011-2017E
China's Liquid Milk Retail Sales and YoY Growth Rate, 2013-2017E
China's Liquid Milk Output and YoY Growth Rate, 2013-2017E
China's Liquid Milk Retail Sales (by Product), 2013-2017E
China's Liquid Milk Retail Sales Structure (by Product), 2013-2017E
Revenue of Major Companies in China Liquid Milk industry, 2009-2014
Net Income of Major Companies in China Liquid Milk industry, 2009-2014
Net Profit Margin of Major Companies in China Liquid Milk industry, 2009-2014
Gross Margin of Major Companies in China Liquid Milk industry, 2009-2014
Liquid Milk Revenue of Major Companies in China Liquid Milk industry, 2009-2014
Market Share of Major Companies in China Liquid Milk industry, 2009-2013
如果这份报告不能满足您的要求,我们还可以为您定制报告,请 留言说明您的详细需求。
|