|
|
|
报告导航:研究报告—
制造业—能源矿产
|
|
2014-2017年中国锑行业研究报告 |
 |
字数:1.6万 |
页数:64 |
图表数:68 |
|
中文电子版:6000元 |
中文纸版:3000元 |
中文(电子+纸)版:6500元 |
|
英文电子版:1500美元 |
英文纸版:1600美元 |
英文(电子+纸)版:1800美元 |
|
编号:LMX059
|
发布日期:2014-12 |
附件:下载 |
 |
|
|
2014年以来,中国锑行业主要呈现以下几个发展特点:
第一,中国锑生产大国地位保持稳定。
据USGS统计,2013年,全球共生产锑矿16.3万吨,其中中国产量最大,达到13万吨,占全球总产量的79.75%;
第二,中国锑精矿及锑品产量下滑,产业集中度高。
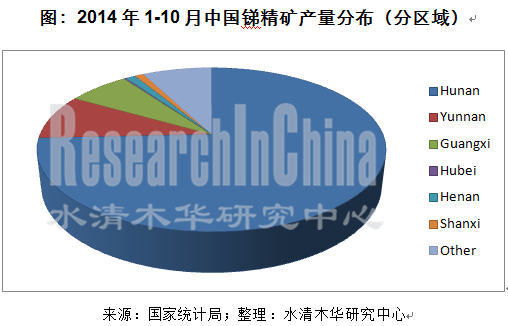
2014年以来,由于下游需求疲软以及国内供应充足,锑品生产商开工率降低,1-10月中国锑品产量下降至212263吨,同比下滑15.23%。受此影响,中国锑精矿产量也微幅下滑,1-10月产量为101193吨,同比下滑5.03%。2014年1-10月,中国锑精矿产量排名前三位的省份是湖南、云南、以及广西,产量合计占全国的比例为90%;
第三,锑在汽车领域的需求保持快速增长。
从中国锑消费来看,最大的应用领域是阻燃剂,约占锑总消费量的50%。近年来,阻燃剂在汽车配件领域的需求保持快速增长,汽车塑料配件在汽车总重量份额中的比例已经达到10%左右。预计未来5年内,随着汽车工业的发展,中国阻燃剂消费量年均增长率可达到5%。
《2014-2017年中国锑行业研究报告》主要涉及以下内容:
 全球锑资源储量、锑矿产量及需求量; 全球锑资源储量、锑矿产量及需求量;
中国锑行业政策环境,主要包括开采总量控制政策以及出口配额政策;
中国锑资源储量及分布、锑精矿、锑品产量及分布、锑需求量、需求结构及主要应用领域分析、主要锑品价格走势及市场竞争格局;
中国锑精矿及锑品进出口量分析;
中国十家主要锑相关企业分析。
Since 2014, China’s antimony industry has been characterized by the following:
First, China holds a stable position as a major antimony producer.
According to the statistics by USGS, in 2013, up to 163,000 tons of antimony ores were produced globally, of which China contributed 130,000 tons, a figure that took a lion’s share of 79.75%.
Second, China saw a decline in the output of antimony concentrates and antimony products, with a higher degree of industrial concentration.
Starting from 2014, owing to weak downstream demand, domestic adequate supply, and lower operating rate of antimony product producers, China's antimony product output for Jan.-Oct. 2014 fell to 212,263 tons, down 15.23% year on year. As a result, China’s antimony concentrate output showed a slight drop, to 101,193 tons over the same period, a year-on-year decrease of 5.03%. Also in the first 10 months of 2014, China’s top 3 provinces by antimony concentrate output were Hunan, Yunnan, and Guangxi, whose combined output occupied 90% of the national total.
Output of Antimony Concentrates in China by Region, Jan.-Oct. 2014
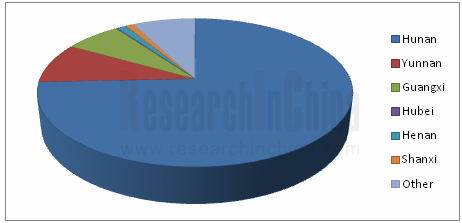
Source: National Bureau of Statistics; ResearchInChina
Third, antimony demand from automobile industry maintained rapid growth.
In terms of antimony consumption in China, the biggest application is flame retardant, which represented roughly 50% of the total consumption. In recent years, the demand for flame retardant from auto parts industry has kept rapid growth, with automotive plastic parts accounting for approximately 10% of the total auto weight. In the coming 5 years, as automobile industry grows, China’s flame retardant consumption will see an AAGR of 5%.
China Antimony Industry Report, 2014-2017 is primarily concerned with the following:
Global antimony reserves, output, and demand;
Policies about antimony industry in China, mainly including these on exploitation cap and export quotas;
China’s antimony reserves and distribution, antimony concentrates, output and distribution of antimony products, antimony demand, demand structure and major antimony applications, main antimony price trends and market competition pattern;
China’s import & export volume of antimony concentrates antimony products;
10 major antimony related enterprises in China.
第一章 锑概述
1.1 锑金属特点及应用
1.2 锑行业产业链
第二章 全球锑行业发展概况
2.1资源储量及分布
2.2供给情况
2.3需求情况
第三章 中国锑行业发展状况
3.1发展政策环境
3.1.1 资源开发政策
3.1.2 开采总量控制政策
3.1.3 出口配额政策
3.2 资源储量及分布
3.3 供应
3.3.1 供给规模
3.3.2 供给结构
3.4 需求
3.4.1 需求结构
3.4.2 应用领域
3.4.3 需求量
3.5 价格走势
3.6 竞争格局
第四章 中国锑行业进出口状况
4.1 进口
4.2 出口
5 重点企业分析
5.1 湖南辰州矿业股份有限公司
5.1.1公司简介
5.1.2 经营状况
5.1.3 营收构成
5.1.4 毛利率
5.1.5 资源量
5.1.6 锑业务
5.1.7 业绩预测
5.2 湖南有色金属股份有限公司
5.2.1公司简介
5.2.2 经营状况
5.2.3 营收构成
5.2.4 锡矿山闪星锑业有限公司
5.3 五矿有色金属股份有限公司
5.3.1公司简介
5.3.2 广西华锑化工有限公司
5.3.3 广西华锑科技有限公司
5.3.4 锑业务
5.4 广西华锡集团
5.4.1公司简介
5.4.2 经营状况
5.4.3 锑业务
5.5 广西日星金属化工有限公司
5.6 贵州东峰矿业集团有限公司
5.6.1公司简介
5.6.2东莞市杰夫阻燃材料有限公司
5.6.3独山独峰杰夫锑业有限公司
5.6.4贵州省五金矿产进出口有限公司
5.7 云南木利锑业有限公司
5.7.1公司简介
5.7.2 新项目
5.7.3 云南联合锑业股份有限公司
5.8 河池市南方有色冶炼有限责任公司
5.9 广西广田冶炼有限公司
5.10 河池五吉有限责任公司
5.10.1 公司简介
5.10.2 最新项目
第六章 市场总结与发展预测
6.1 市场总结
6.2 发展预测
1. Overview of Antimony
1.1 Features & Applications of Antimony Metal
1.2 Industry Chain
2. Development of Antimony Industry Worldwide
2.1 Reserves and Distribution
2.2 Supply
2.3 Demand
3. Development of Antimony Industry in China
3.1 Policy Environment
3.1.1 Policy on Resource Exploitation
3.1.2 Policy on Control of Total Exploitation
3.1.3 Policy on Export Quota
3.2 Reserves and Distribution
3.3 Supply
3.3.1 Scale
3.3.2 Structure
3.4 Demand
3.4.1 Demand Structure
3.4.2 Application Field
3.4.3 Demand
3.5 Price Trend
3.6 Competition Structure
4. Import & Export of China Antimony Industry
4.1 Import
4.2 Export
5. Key Enterprises
5.1 Chenzhou Mining Group Co., Ltd.
5.1.1 Profile
5.1.2 Operation
5.1.3 Revenue Structure
5.1.4 Gross Margin
5.1.5 Reserves
5.1.6 Antimony Business
5.1.7 Performance Forecast
5.2 Hunan Nonferrous Metals Corporation Limited
5.2.1 Profile
5.2.2 Operation
5.2.3 Revenue Structure
5.2.4 Hsikwangshan Twinkling Star
5.3 China Minmetals Nonferrous Metals Company
5.3.1 Profile
5.3.2 China Antimony Chemicals
5.3.3 China Antimony Technology Co., Ltd.
5.3.4 Antimony Business
5.4 Guangxi China Tin Group
5.4.1 Profile
5.4.2 Operation
5.4.3 Antimony Business
5.5 Guangxi YoungSun Chemicals
5.6 Guizhou Dongfeng Mining Group Co., Ltd.
5.6.1 Profile
5.6.2 Dongguan Jiefu Flame-Retarded Material Co., Ltd
5.6.3 Dushan Dufeng Jiefu Antimony Industry Co.
5.6.4 Guizhou Provincial Metals & Minerals Imp & Exp. Co., Ltd
5.7 Yunnan Muli Antimony Industry
5.7.1 Profile
5.7.2 New Project
5.7.3 Yunnan Union Antimony Industry Co., Ltd.
5.8 Hechi Nanfang Non-ferrous Metal Smelt
5.9 Guangxi Guangtian Smelting Co., Ltd.
5.10 Hechi Wuji Co., Ltd.
5.10.1 Profile
5.10.2 Latest Project
6. Market Summary and Development Forecast
6.1 Market Summary
6.2 Development Forecast
表:锑产品的用途
图:锑行业产业链
图:锑产业链及应用领域
图:2013年全球锑储量分布
表:2013年全球及中国锑静态储采比
图:1994-2013年全球锑矿产量
图:1994-2013年中国锑矿产量占全球的比重
图:2013年全球锑矿产量分布
图:2013年全球锑消费结构
图:1996年和2012年美国锑消费结构对比
图:2013年全球锑消费量预测(分区域)
表:1991-2014年中国锑行业相关政策、法规及标准
图:2009-2013年中国锑开采总量控制指标
表:2013年度中国省(区)锑矿开采总量控制指标
表:2014年中国前两批锑及其制品出口配额
表:2014年中国前两批氧化锑出口配额
图:2012-2014年中国锑及其制品出口配额对比
图:2012-2014年中国氧化锑出口配额对比
表:2006-2013年中国锑基础储量与探明储量
图:2013年中国锑矿储量分布
图:2009-2014年中国锑精矿产量
图:2002-2014年中国锑品产量
图:2014年1-8月中国锑品产量区域分布
图:2014年1-10月中国锑精矿产量分布
图:2013年中国锑消费结构
表:锑的主要应用领域
图:阻燃剂在汽车中的应用
图:2008-2014年中国铅酸蓄电池产量
图:2001-2014年中国锑消费量
图:2007-2014年中国锑品价格走势
图:2009-2014年中国市场三氧化二锑价格(99.8%品位)走势
图:2009-2014年中国锑相关产品进口量
图:2009-2014年中国锑相关产品进口额
图:2009-2014年中国锑相关产品出口量
图:2009-2014年中国锑相关产品出口额
图:2009-2014年中国三氧化二锑出口价格
图:2009-2014年辰州矿业营业收入及同比增长
图:2009-2014年辰州矿业净利润及同比增长
图:2009-2014年辰州矿业营业收入(分产品)构成
图:2009-2014年辰州矿业营业收入(分区域)构成
图:2009-2014年辰州矿业毛利率(分产品)
图:2009-2014年辰州矿业毛利率(分区域)
表:2009-2013年辰州矿业可采资源储量
表:2009-2014年辰州矿业锑制品产量
表:2012-2013年辰州矿业从事锑业务的子公司营业收入及净利润
图:2011-2014年湖南省中南锑钨工业贸易有限公司锑产品出口配额
图:2014-2017年辰州矿业营业收入与净利润预测
图:2009-2014年湖南有色营业收入及同比增长
图:2009-2014年湖南有色毛利及毛利率
图:2009-2014年湖南有色净利润及同比增长
图:2009-2014年湖南有色营收构成(分业务)
图:2009-2014年闪星锑矿锑产品营业收入及同比增长
图:2009-2014年闪星锑矿锑产品销量及平均售价
图:2011-2014年闪星锑矿锑产品出口配额
图:2011-2014年五矿有色锑产品出口配额
图:2009-2014年华锡集团营业收入及同比增长
表:2009-2013年华锡集团精锑产量、销量、平均销售价格
图:2009-2014年华锡集团锑产品出口配额
图:华锡集团产品主要国内销售目的省市
图:华锡集团产品主要出口目的国家
图:2011-2014年广西日星金属化工有限公司锑产品出口配额
图:贵州省五金矿产进出口有限公司锑产品出口配额
图:2011-2014年云南联合锑业股份有限公司锑产品出口配额
图:2009-2014年中国锑精矿产量及进口量
表:2009-2014年中国锑品产量、出口量及需求量
图:2014-2017年中国锑精矿产量预测
图:2014-2017年中国锑品产量预测
图:2014-2017年中国锑消费量预测
Applications of Antimony-based Products
Antimony Industry Chain
Antimony Industry Chain and Application Fields
Distribution of Antimony Reserves Worldwide, 2013
Antimony Reserves-to-Production Ratio (Static) in China and the World, 2013
Worldwide Antimony Ore Production, 1994-2013
Proportion of China’s Antimony Ore Production to the World’s Total, 1994-2013
Worldwide Antimony Ore Production by Country, 2013
Worldwide Antimony Consumption Structure, 2013
Structure of Antimony Consumption in United States, 1996 VS 2012
Estimated Consumption of Antimony by Region, 2013
Policies, Regulations and Standards on China Antimony Industry, 1991-2014
Indexes of Gross Exploitation Amount in China, 2009-2013
China’s Control Index for Total Antimony Ore Mining by Province/Autonomous Region, 2013
China’s First Two Batches of Export Quotas for Antimony and Its Products, 2014
China’s First Two Batches of Export Quotas for Antimony Oxide, 2014
China’s Export Quotas for Antimony and Its Products, 2012-2014
China’s Export Quotas for Antimony Oxide, 2012-2014
Basic Reserves and Proven Reserves of Antimony in China
Distribution of Antimony Ore Reserves in China, 2013
Output of Antimony Concentrates of China, 2009-2014
Antimony Products Output of China, 2002-2014
Output Distribution of Antimony Products in China by Region, Jan.-Aug., 2014
Output Distribution of Antimony Concentrates in China by Region, Jan.-Oct., 2014
Antimony Consumption Structure in China in 2013
Major Application Fields of Antimony
Application of Flame Retardant in Automobile
Output of Lead-acid Storage Battery in China, 2008-2014
Consumption Amount of Antimony in China, 2001-2014
Price Trend of Antimony Products in China, 2007-2014, 2007-2014
Price Trend of Sb?O? (Grade 99.8%) in Chinese Market, 2009-2014
Import Volume of Antimony-based Products in China, 2009-2014
Import Value of Antimony-based Products in China, 2009-2014
Export Volume of Antimony-based Products in China, 2009-2014
Export Value of Antimony-based Products in China, 2009-2014
Export Price of Sb?O? in China, 2009-2014
Revenue and YoY Growth of Chenzhou Mining Group, 2009-2014
Net Income and YoY Growth of Chenzhou Mining Group, 2009-2014
Revenue Structure of Chenzhou Mining Group by Product, 2009-2014
Revenue Structure of Chenzhou Mining Group by Region, 2009-2014
Gross Margin of Chenzhou Mining Group by Product, 2009-2014
Gross Margin of Chenzhou Mining Group by Region, 2009-2014
Recoverable Resource Reserves of Chenzhou Mining Group by Product, 2009-2013
Output of Chenzhou Mining Group’s Antimony Products, 2009-2014
Revenue and Net Income of Chenzhou Mining Group’s Subsidiaries Engaged in Antimony Business
Antimony Products Export Quotas of Hunan Zhongnan Antimony-Tungsten Industry Trading Company, 2011-2014
Revenue and Net Income of Chenzhou Mining Group, 2012-2015E
Revenue and YoY Growth of Hunan Nonferrous Metals Corporation, 2009-2014
Gross Profit and Gross Margin of Hunan Nonferrous Metals Corporation, 2009-2014
Net Income and YoY Growth of Hunan Nonferrous Metals Corporation, 2009-2014
Revenue Structure of Hunan Nonferrous Metals Corporation by Business, 2009-2014
Revenue from Antimony Products of Hsikwangshan Twinkling Star,2009-2014
Sales Volume and Average Selling Price of Antimony Products of Hsikwangshan Twinkling Star, 2009-2014
Antimony Products Export Quota of Hsikwangshan Twinkling Star, 2011-2014
Antimony Products Export Quota of China Minmetals Nonferrous Metals Company Ltd, 2011-2014
Revenue and YoY Growth of Guangxi China Tin Group, 2009-2014
Refined Antimony Output, Sales Volume and Average Selling Price of Guangxi China Tin Group, 2009-2013
Antimony Products Export Quota of Guangxi China Tin Group, 2009-2014
Main Domestic Sales Provinces and Municipalities of Guangxi China Tin Group
Main Export Destinations of Guangxi China Tin Group
Antimony Products Export Quota of Guangxi YoungSun Chemicals, 2011-2014
Antimony Products Export Quota of Guizhou Provincial Metals & Minerals Imp & Exp., 2011-2014
Antimony Product Export Quota of Yunnan United Antimony Industries, 2011-2014
China’s Antimony Concentrate Output and Import Volume, 2009-2014
China’s Antimony Products Output, Export Volume and Demand, 2009-2014
China’s Antimony Concentrate Output, 2014-2017E
China’s Antimony Output, 2014-2017E
China’s Antimony Consumption, 2014-2017E
如果这份报告不能满足您的要求,我们还可以为您定制报告,请 留言说明您的详细需求。
|