|
|
|
报告导航:研究报告—
TMT产业—电子半导体
|
|
2014-2015年全球及中国触控屏行业研究报告 |
 |
字数:3.0万 |
页数:165 |
图表数:210 |
|
中文电子版:8000元 |
中文纸版:4000元 |
中文(电子+纸)版:8500元 |
|
英文电子版:2400美元 |
英文纸版:2600美元 |
英文(电子+纸)版:2700美元 |
|
编号:ZYW193
|
发布日期:2014-12 |
附件:下载 |
 |
|
|
《2014-2015年全球及中国触控屏行业研究报告》包含以下内容:
1、触控屏技术发展趋势
2、触控屏市场趋势
3、触控屏产业分析
4、22家主要触控屏厂家研究
5、5家触控屏相关玻璃厂家研究
触控屏最核心的市场是智能手机和平板电脑,在未来3年内,这两个市场都将陷入困境。智能手机市场已经明显出现饱和,增速放缓。智能手机普及率最高的地区不是美国而是中国,中国有很多人是一人拥有两部智能手机。而中国市场也最先衰退,2014年1-10月中国智能手机市场出货量为3.12亿部,同比下降10.4%。衰退的另一个原因是中国经济继续低迷。
而平板电脑市场也出现了饱和,平板电脑功能单一,受手机屏幕越来越大的冲击,平板电脑市场在2014年停止增加,转为下跌。同时平板电脑主要是成年人买给小孩玩耍用,换机频率低。未来数年,平板电脑市场都将处于轻微衰退之中,即便苹果推出12.9寸的平板电脑也无力挽救市场颓势。
而触控笔记本电脑则可能完全消失,尤其是掀盖式(Clam Shell)笔记本电脑,其主要用于办公,触控功能毫无意义。而2in1型笔记本电脑性能远落后于掀盖式(Clam Shell)笔记本电脑,价格又远高于平板电脑和掀盖式(Clam Shell)笔记本电脑,市场空间会越来越窄。
对Out-Cell型触控屏厂家来说,一方面市场受到来自In-Cell和On-Cell的侵蚀,另一方面,下游市场也止步不前,而Out-Cell型触控屏产能严重过剩。于是2014年Out-Cell型触控屏爆发激烈价格战,市场规模大幅度缩水16.2%,而韩国和台湾厂家尤其惨烈,部分厂家收入减少50%,小厂家则破产倒闭。
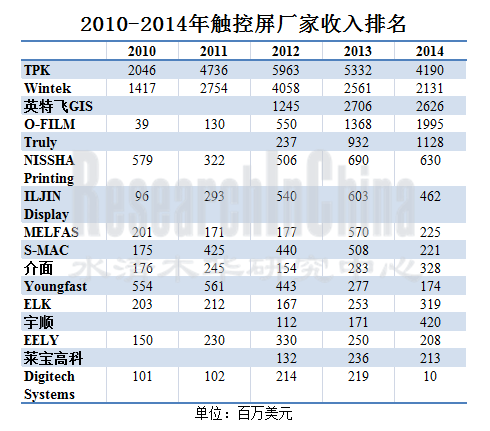
尽管2014年有大批Out-Cell型触控屏厂家破产,其中包括年收入超过20亿美元的胜华和年收入超过2亿美元的韩国Digitech Systems,但2015年市场仍然明显供过于求,尤其是平板电脑和笔记本电脑用触控屏领域。预计2015年Out-Cell型触控屏市场继续衰退,衰退幅度为10.3%。
In-Cell和On-Cell厂家则高歌猛进,随着其技术越来越成熟,产量越来越大,其价格劣势将逐步消失。2016年将有50%的触控屏采用In-Cell或On-Cell。而2014年只有31%的触控屏采用In-Cell或On-Cell。
The report covers the followings:
1, Development trends of touch screen technology
2, Trends of touch screen market
3, Analysis on the touch screen industry
4, Study on 22 major touch screen vendors
5, Research on 5 touch screen glass vendors
The core of the touch screen market is reflected in smartphones and Tablet PCs, both of which will be in trouble in the next three years. The smartphone market has obviously been saturated and slowed down. China exceeds the United States to see the highest smartphone penetration rate. However, the Chinese smartphone market where a person often holds two smartphones is the first one that suffers recession in the world. From January to October of 2014, China's smartphone shipment dropped down 10.4% year on year to 312 million. China's sluggish economy is also a reason for the decline.
The Tablet PC market witnesses saturation as well. Impacted by bigger and bigger mobile phone screens, the market of Tablet PCs featured with simple functions stopped growth to descend in 2014. In terms of willingness-to-buy, adults would like to buy Tablet PCs for children, marking low replacement frequency. In the next few years, the Tablet PC market will be in a mild recession, which even can not be reversed by Apple’s upcoming 12.9-inch Tablet PCs.
Touch laptops may disappear completely, especially clamshell ones which are mainly used in offices with meaningless touch function. 2in1 laptops are inferior to clamshell laptops in performance, but are much expensive than Tablet PCs and clamshell laptops, so the 2in1 laptop market will shrink.
For Out-Cell touch screen vendors, In-Cell and On-Cell threaten their market, the downstream market halted, and the Out-Cell touch screen capacity is excess dramatically. In 2014, the Out-Cell touch screen market witnessed a fierce price war, the market size shrunk by 16.2%, especially South Korean and Taiwanese vendors suffered the hugest losses and some of them lost the revenue by 50%, let alone bankrupt small vendors.
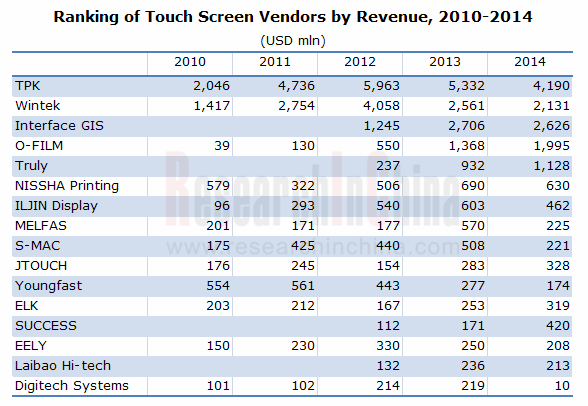
Wintek (annual revenue: more than USD2 billion) and Digitech Systems (annual revenue: over USD200 million) were also listed in the considerable collapsed Out-Cell touch screen vendors in 2014. In 2015, the Out-Cell touch screen market will still see significant oversupply, particularly the field of touch screens used for Tablet PCs and laptops; meanwhile, the market will decline by 10.3%.
In-Cell and On-Cell vendors will triumph. Their price disadvantage will gradually vanish with more mature technology and high output. 50% of touch screens will adopt In-Cell or On-Cell in 2016, much higher than 31% in 2014.
第一章、触控屏简介
1.1、触控屏结构
1.2、Glass-to-glass (G/G)
1.3、Glass-to-film-to-film (G/F/F)
1.4、G1F
1.5、TOC
1.6、ON-CELL
1.7、IN-CELL
1.8、中尺寸触控屏发展趋势
1.9、笔记本电脑触控屏发展趋势
1.10、AIO PC触控屏
1.11、Metal Mesh 优势
1.12、Metal Mesh供应链
1.13、Silver NanofibersWires纳米银线
第二章、触控屏市场与产业
2.1、全球手机市场
2.2、全球智能手机市场
2.3、中国手机市场
2.4、平板电脑市场
2.5、全球手机显示屏发展趋势
2.6、中国手机显示屏发展趋势
2.7、全球手机显示屏产业分析
2.8、手机显示屏厂家与手机品牌厂家配套关系
第三章、触控屏产业
3.1、触控屏市场规模
3.2、ITO Film市场规模
3.3、ITO Film供应链
3.4、ITO Film行业分析
3.5、触控屏厂家排名
3.6、触控屏厂家与客户配套关系
第四章、触控屏厂家研究
4.1、群创
4.2、Truly信利国际
4.3、LG Display
4.4、三星显示器件
4.5、夏普
4.6、胜华
4.7、洋华
4.8、介面
4.9、SMAC
4.10、ILJIN Display
4.11、Melfas
4.12、ELK
4.13、Digitech Systems
4.14、和鑫光电(Sintek Photronic)
4.15、达鸿科技(Cando)
4.16、TPK (宸鸿光电科技)
4.17、牧东光电(Mutto Optronics)
4.18、莱宝高科(Laibao Hi-tech)
4.19、欧菲光 SHENZHEN O-FILM TECH
4.20、业成集团(GIS)
4.21、宇顺电子
4.22、NISSHA Printing
第五章、触控屏关联玻璃厂家研究
5.1、安可(Aimcore)
5.2、长信科技(Token)
5.3、正达(G-tech Optoelectroncis)
5.4、蓝思科技(Shenzhen Lens)
5.5、伯尔尼光学
1. Overview of Touch Screen
1.1 Touch Screen Structure
1.2 Glass-to-glass (G/G)
1.3 Glass-to-film-to-film (G/F/F)
1.4 G1F
1.5 TOC
1.6 ON-CELL
1.7 IN-CELL
1.8 Development Trends of Medium-sized Touch Screen
1.9 Development Trends of Laptop Touch Screen
1.10 AIO PC Touch Screen
1.11 Advantages of Metal Mesh
1.12 Metal Mesh Supply Chain
1.13 Silver Nanofiber Wire
2 Touch Screen Market and Industry
2.1 Global Mobile Phone Market
2.2 Global Smartphone Market
2.3 Chinese Mobile Phone Market
2.4 Tablet PC Market
2.5 Development Trends of Global Mobile Phone Display
2.6 Development Trends of Chinese Mobile Phone Display
2.7 Global Mobile Phone Display Industry
2.8 Supply Relationship between Mobile Phone Display Vendors and Mobile Phone Brand Vendors
3 Touch Screen Industry
3.1 Touch Screen Market Size
3.2 ITO Film Market Size
3.3 ITO Film Supply Chain
3.4 ITO Film Industry
3.5 Ranking of Touch Screen Vendors
3.6 Supply Relationship between Touch Screen Vendors and Clients
4. Major Touch Screen Vendors
4.1 Innolux
4.2 Truly
4.3 LG Display
4.4 Samsung Display
4.5 Sharp
4.6 Wintek
4.7 Young Fast
4.8 JTOUCH
4.9 SMAC
4.10 ILJIN Display
4.11 Melfas
4.12 ELK
4.13 Digitech Systems
4.14 Sintek Photronic
4.15 Cando
4.16 TPK
4.17 Mutto Optronics
4.18 Laibao Hi-tech
4.19 Shenzhen O-Film Tech
4.20 GIS
4.21 Success Electronics
4.22 NISSHA Printing
5 Touch Screen Glass Vendors
5.1 Aimcore
5.2 Token
5.3 G-tech Optoelectronics
5.4 Shenzhen Lens
5.5 Boerni
Glass-to-glass (G/G)型投射式电容触控屏(P-cap Touch)
Glass-to-film-to-film (G/F/F)投射式电容触控屏
G1F触控
TOC触控屏
Sheet型TOC
Piece型TOC
2011-2015年中尺寸触控屏技术分布
2012-2016年笔记本电脑触控屏出货量技术分布
2012-2016年AIO PC触控屏出货量技术分布
纳米银Silver NanofibersWires供应链
2007-2015年全球手机出货量
2011-2014年全球3G/4G手机出货量地域分布
Worldwide Mobile Phone Sales to End Users by Vendor in 2013 (Thousands of Units)
Worldwide Smartphone Sales to End Users by Vendor in 2013 (Thousands of Units)
Worldwide Smartphone Sales to End Users by Operating System in 2013 (Thousands of Units)
2013-2015年全球Top 13智能手机厂家出货量
2014年1-10月中国手机月度出货量
2014年中国智能手机市场主要厂家市场占有率
2014年中国4G手机市场主要厂家市场占有率
2011-2016年全球平板电脑出货量
2013年平板电脑主要品牌市场占有率
2012、2013年全球平板电脑制造厂家产量
2013-2017年全球智能手机显示屏尺寸发展趋势
2013-2017年全球智能手机触控技术发展趋势
2013-2017年全球智能手机显示屏技术发展趋势
2013-2017年全球智能手机显示屏分辨率发展趋势
2014年中国手机市场尺寸分布
2013-2017年中国智能手机显示屏尺寸发展趋势
2014年中国智能手机市场分辨率分布
2013-2017年中国智能手机显示屏分辨率发展趋势
2014年中国手机市场PPI分布
2013-2017年中国智能手机显示屏技术发展趋势
2013-2014年全球主要中小尺寸显示屏厂家出货量
2014年中国手机显示屏主要供应厂家市场占有率
2014年三星手机屏主要供应商份额
2014年APPLE手机屏主要供应商份额
2014年HUAWEI手机屏主要供应商份额
2014年LENOVO手机屏主要供应商份额
2014年ZTE手机屏主要供应商份额
2014年COOLPAD手机屏主要供应商份额
2014年OPPO手机屏主要供应商份额
2014年XIAOMI手机屏主要供应商份额
2014年Vivo手机屏主要供应商份额
触控屏产业链
2010-2016年全球触控屏市场规模
2010-2016年全球触控屏市场规模(出货量)
2012-2017年触控屏材料市场规模
2011-2016年ITO FILM市场出货量
2011-2016年ITO FILM市场规模
ITO Film结构
ITO Film供应链
ITO Film主要厂家性能对比
2013年全球主要ITO FILM厂家市场占有率
2010-2014年触控屏厂家收入排名
2012-2013年触控屏厂家营业利润率
三星2012-2013年手机触控屏供应商市场占有率
三星2012-2013年TabletPC触控屏供应商市场占有率
2014年诺基亚触控屏主要供应厂家所占比例
2012年LG触控屏主要供应厂家所占比例
2012年HTC触控屏主要供应厂家所占比例
INNOLUX组织结构
2010-2014年INNOLUX收入与营业利润率
4Q12-3Q14 INNOLUX Revenue, Gross Margin, EBITDA Margin
4Q12-3Q14 INNOLUX Total Debt and Debt Ratios
4Q12-3Q14 INNOLUX Inventory Trend
4Q12-3Q14 INNOLUX Area Shipments and TFT LCD ASP Trends
4Q12-3Q14 INNOLUX Small & Medium Size Unit Shipments and Sales Trends
4Q12-3Q14 INNOLUX Sales Breakdown by Application
4Q12-3Q14 INNOLUX Sales Breakdown by Size
INNOLUX TFT-LCD Fabs Profile
Touch Sensor Fabs Profile
2005-2014年信利国际收入与运营利润率
2013年1季度-2014年4季度信利国际季度收入与毛利率
2006-2011年信利国际LCD业务收入技术分布
2012-2015年信利半导体收入业务分布
2012-2015年信利半导体各项产品出货量
2012-2015年信利半导体各项产品ASP
信利手机LCD主要客户
信利汽车显示器主要客户
信利触摸屏产能
信利CCM主要客户
2009-2015年LG Display收入与营业利润率
1Q13-3Q14 LG Display季度收入与毛利率
2012-2014 LG DISPLAY IFRS Statements of Financial Position
2009-2013 LG DISPLAY 出货量下游分布
2009-2013 LG DISPLAY 收入下游分布
2011-2013 LG DISPLAY 收入地域分布
Q3/13-Q3/14 LG Display Quarterly Shipments and ASP
Q3/13-Q3/14 LG Display Quarterly Revenue by Application
Q3/13-Q3/14 LG Display Quarterly producible by area
LG Display Fabs Capacity List
2011-2013 LG Display Fabs Capacity
LG Display Footprint
LG Display Manufacturing Base Footprint
2010-2015年三星DP事业部收入与营业利润率
2012-2015年三星Dp事业部收入产品分布
2012-2015年三星Dp事业部收入营业利润分布
三星生产线一览
FY2008-FY2015 SHARP 收入与营业利润率
FY2013-FY2015 SHARP收入业务分布
FY2013-FY2015 SHARP 各项业务营业利润率
2013-2014夏普手机面板分辨率
夏普生产线一览
2003-2013年胜华收入与毛利率
2003-2013年胜华收入与运营利润率
2012年11月-2014年11月胜华月度收入
胜华全球分布
2006-2011年胜华收入技术分布
2009-2012年胜华收入客户分布
2010-2011年胜华销量、销售额、ASP
2012-2013年胜华产能产量销量
胜华电容触控屏产能
胜华触控屏COVER GLASS产能
胜华ATT结构
胜华ATT工艺流程
胜华ATT与传统电容G/G触控屏对比
2005-2014年洋华收入与运营利润率
2011年11月-2014年11月洋华月度收入与增幅
2010-2013年洋华收入客户分布
2008-2013年洋华产能\产量\销量
2006-2014年界面收入与运营利润率
2012年11月-2014年11月界面月度收入与增幅
2008-2013年界面产能\产量\销量
2008-2011年界面收入地域分布
2005-2014年SMAC收入与营业利润率
S-MAC生产流程
2013年1季度-2014年4季度S-MAC季度收入与运营利润率
2013年1季度-2014年S-MAC季度收入业务分布
ILJIN Display组织结构
2008-2014年ILJIN Display收入与运营利润率
2012年1季度-2014年4季度ILJIN Display季度收入与运营利润率
2011年1季度-2013年4季度ILJIN Display收入业务分布
2010年1季度-2013年4季度ILJIN Display 7英寸TSP产量
2007-2014年Melfas收入与运营利润率
2007-2014年Melfas收入产品分布
2013年1季度-2014年4季度Melfas季度收入与运营利润率
2006-2014年ELK收入与运营利润率
2012年 -2013年 ELK 收入下游应用分布
2012年 -2013年 ELK 收入客户分布
2007-2013年Digitech Systems收入与运营利润率
2009-2012年Digitech Systems收入产品分布
和鑫组织结构
2004—2014年和鑫收入与运营利润率
2012年11月-2014年11月和鑫月度收入与增幅
2004-2014年达鸿科技收入与运营利润率
2012年11月-2014年11月达鸿月度收入与增幅
TPK Organizational Chart
2007-2014年TPK收入、毛利率、运营利润率
2012年1季度-2014年3季度TPK季度收入与运营利润率
2011年1季度-2014年3季度TPK季度收入与毛利率
2013年1季度-2014年3季度TPK季度收入尺寸分布
2012年11月-2014年11月TPK月度收入与增幅
2008-2013年 TPK Holding触摸屏 产能、产量、销量
2011-2013年TPK收入下游应用分布
TPK Holding公司与关联公司关系图
2010年5月-2012年5月牧东光电收入与增幅
2008-2013年牧东光电收入与运营利润率
2012年牧东光电收入客户分布
2005-2014年莱宝高科收入与净利润
2012-2014上半年来宝高科收入业务分布
2007-2015年欧菲光收入与运营利润率
2009-2015年欧菲光收入产品分布
2009年1季度-2014年3季度欧菲光季度收入
2009年1季度-2014年3季度欧菲光季度毛利率
2012-2014年欧菲光客户结构
业成集团结构
2011-2016年GIS收入与营业利润率
2011-2016年GIS收入与毛利率
2013年GIS产能、产量、产能利用率
2012-2013年GIS销量
2012-2014年GIS手机触控占总收入比例与毛利率
2012-2014年GIS平板电脑触控占总收入比例与毛利率
2014年9月30日GIS员工数量
2014年9月30日GIS员工学历分布
2014年9月30日GIS员工地域分布
GIS研发处组织结构
GIS生产处组织结构
2012-2014年手机触控业务成本结构
2012-2014年平板电脑触控业务成本结构
2013、2014年GIS子公司简明财务
2008-2014年宇顺电子收入与营业利润
2012-2014年宇顺电子收入产品分布
2005-2015财年NISSHA收入与运营利润率
FY2009-FY2015 NISSHA收入业务分布
FY2009-FY2015 NISSHA Touch Panel业务收入下游分布
2012年4季度-2014年3季度NISSHA 季度收入与营业利润率
2012年1季度-2014年3季度NISSHA Touch Panel业务季度收入与营业利润率
安可光电组织结构
安可光电各部门简介
2006-2014年安可光电收入与毛利率
2012年11月-2014年11月安可收入与增幅
长信科技组织结构
2007-2014年长信科技收入与运营利润率
2007-2014年正达国际光电收入与运营利润率
2012年11月-2014年11月正达国际光电月度收入与增幅
2010-2013年正达国际光电收入产品分布
正达国际光电全球分布
正达国际光电业务模式
正达国际光电主要产品
正达国际光电主要客户
2013年蓝思科技客户分布
2011-2014年蓝思科技收入、营业利润、净利润
蓝思科技2011-2013年资产与负债
2011-2013年蓝思科技现金流
2011-2013年蓝思科技主要财务指标
蓝思科技股东机构
蓝思科技组织结构
蓝思科技2013年主要子公司收入与净利润
蓝思科技2013年主要供应商供应比例
Glass-to-glass (G/G) Projected Capacitive Touch Screen (P-cap Touch)
Glass-to-film-to-film (G/F/F) Projected Capacitive Touch Screen
G1F Touch
TOC Touch Screen
Sheet-based TOC
Piece-based TOC
Medium-sized Touch Screen by Technology, 2011-2015E
Laptop Touch Screen Shipment by Technology, 2012-2016E
AIO PC Touch Screen Shipment by Technology, 2012-2016E
Silver Nanofiber Wire Supply Chain
Global Mobile Phone Shipment, 2007-2015E
Global 3G/4G Mobile Phone Shipment by Region, 2011-2014
Worldwide Mobile Phone Sales to End Users by Vendor in 2013 (Thousands of Units)
Worldwide Smartphone Sales to End Users by Vendor in 2013 (Thousands of Units)
Worldwide Smartphone Sales to End Users by Operating System in 2013 (Thousands of Units)
Shipment of Global Top 13 Smartphone Vendors, 2013-2015E
China’s Mobile Phone Monthly Shipment, Jan-Oct 2014
Share of Major Vendors in Chinese Smartphone Market, 2014
Share of Major Vendors in Chinese 4G Mobile Phone Market, 2014
Global Tablet PC Shipment, 2011-2016E
Market Share of Main Tablet PC Brands, 2013
Output of Global Tablet PC Vendors, 2012-2013
Development Trends of Global Smartphone Display Size, 2013-2017E
Development Trends of Global Smartphone Touch Technology, 2013-2017E
Development Trends of Global Smartphone Display Technology, 2013-2017E
Development Trends of Global Smartphone Display Resolution, 2013-2017E
Chinese Mobile Phone Market by Size, 2014
Development Trends of China's Smartphone Display Size, 2013-2017E
Chinese Smartphone Market by Resolution, 2014
Development Trends of China's Smartphone Display Resolution, 2013-2017E
Chinese Mobile Phone Market by PPI, 2014
Development Trends of China's Smartphone Display Technology, 2013-2017E
Shipment of Major Global Small and Medium-Sized Display Vendors, 2013-2014
Market Share of Major Mobile Phone Display Vendors in China, 2014
Share of Major Suppliers of Samsung's Mobile Phone Display, 2014
Share of Major Suppliers of APPLE's Mobile Phone Display, 2014
Share of Major Suppliers of HUAWEI's Mobile Phone Display, 2014
Share of Major Suppliers of LENOVO's Mobile Phone Display, 2014
Share of Major Suppliers of ZTE's Mobile Phone Display, 2014
Share of Major Suppliers of COOLPAD's Mobile Phone Display, 2014
Share of Major Suppliers of OPPO's Mobile Phone Display, 2014
Share of Major Suppliers of XIAOMI's Mobile Phone Display, 2014
Share of Major Suppliers of Vivo's Mobile Phone Display, 2014
Touch Screen Industry Chain
Global Touch Screen Market Size, 2010-2016E
Global Touch Screen Market Size (Shipment), 2010-2016E
Touch Screen Material Market Size, 2012-2017E
Shipment of ITO FILM Market, 2011-2016E
ITO FILM Market Size, 2011-2016E
ITO Film Structure
ITO Film Supply Chain
Comparison between Major ITO Film Vendors in Performance
Market Share of Major Global ITO Film Vendors, 2013
Ranking of Touch Screen Vendors by Revenue, 2010-2014
Operating Profit Margin of Touch Screen Vendors, 2012-2013
Market Share of Samsung's Mobile Phone Touch Screen Suppliers, 2012-2013
Market Share of Samsung's Tablet PC Touch Screen Suppliers, 2012-2013
Share of Nokia's Major Touch Screen Suppliers, 2014
Share of LG's Major Touch Screen Suppliers, 2012
Share of HTC's Major Touch Screen Suppliers, 2012
INNOLUX's Organizational Structure
INNOLUX's Revenue and Operating Margin, 2010-2014
INNOLUX's Revenue, Gross Margin and EBITDA Margin, Q4 2012-Q3 2014
INNOLUX's Total Debt and Debt Ratio, Q4 2012-Q3 2014
INNOLUX's Inventory, Q4 2012-Q3 2014
INNOLUX's Area Shipment and TFT- LCD ASP Trends, Q4 2012-Q3 2014
INNOLUX's Small & Medium Size Unit Shipment and Sales, Q4 2012-Q3 2014
INNOLUX's Sales Breakdown by Application, Q4 2012-Q3 2014
INNOLUX's Sales Breakdown by Size, Q4 2012-Q3 2014
Profile of INNOLUX's TFT-LCD Fabs
Profile of Touch Sensor Fabs
Truly's Revenue and Operating Margin, 2005-2014
Truly's Quarterly Revenue and Gross Margin, Q1 2013-Q4 2014
Truly's LCD Revenue by Technology, 2006-2011
Truly's Semiconductor Revenue by Business, 2012-2015E
Truly's Semiconductor Shipment by Product, 2012-2015E
Truly's Semiconductor ASP by Product, 2012-2015E
Truly's Mobile Phone LCD Major Customers
Major Customers of Truly's Automotive Displays
Truly's Touch Screen Capacity
Truly's Major CCM Customers
Revenue and Operating Margin of LG Display, 2009-2015E
Quarterly Revenue and Gross Margin of LG Display, Q1 2013-Q3 2014
Statements of Financial Position of LG DISPLAY IFRS, 2012-2014
Shipment of LG Display by Application, 2009-2013
Revenue of LG Display by Application, 2009-2013
Revenue of LG Display by Region, 2011-2013
Quarterly Shipment and ASP of LG Display, Q3 2013-Q3 2014
Quarterly Revenue of LG Display by Application, Q3 2013-Q3 2014
Quarterly Producible of LG Display by Area, Q3 2013-Q3 2014
Capacity of LG Display's Fabs
Capacity of LG Display's Fabs, 2011-2013
Footprint of LG Display
Manufacturing Base Footprint of LG Display
Revenue and Operating Margin of Samsung's DP Division, 2010-2015E
Revenue of Samsung's DP Division by Product, 2012-2015E
Revenue and Operating Profit of Samsung's DP Division, 2012-2015E
Samsung's Production Lines
Sharp's Revenue and Operating Margin, FY2008-FY2015
Sharp's Revenue by Business, FY2013-FY2015
Sharp's Operating Margin by Business, FY2013-FY2015
Sharp's Mobile Phone Panel Resolution, 2013-2014
Sharp’s Production Lines
Wintek's Revenue and Gross Margin, 2003-2013
Wintek's Revenue and Operating Margin, 2003-2013
Wintek's Monthly Revenue, Nov 2012-Nov 2014
Wintek's Global Distribution
Wintek's Revenue by Technology, 2006-2011
Wintek's Revenue by Customer, 2009-2012
Wintek's Sales Volume, Revenue and ASP, 2010-2011
Wintek's Capacity, Output and Sales Volume, 2012-2013
Wintek's Capacitive Touch Screen Capacity
Wintek's Touch Screen Cover Glass Capacity
Wintek's ATT Structure
Wintek's ATT Process
Comparison between Wintek's ATT and Traditional Capacitive G / G Touch Screen
Revenue and Operating Margin of Young Fast, 2005-2014
Monthly Revenue and Growth Rate of Young Fast, Nov 2011- Nov 2014
Revenue of Young Fast by Customer, 2010-2013
Capacity \ Output \ Sales Volume of Young Fast, 2008-2013
JTOUCH's Revenue and Operating Margin, 2006-2014
JTOUCH's Monthly Revenue and Growth Rate, Nov 2012-Nov 2014
JTOUCH's Capacity \ Output \ Sales Volume, 2008-2013
JTOUCH's Revenue by Region, 2008-2011
S-MAC's Revenue and Operating Margin, 2005-2014
S-MAC's Production Process
S-MAC's Quarterly Revenue and Operating Margin, Q1 2013-Q4 2014
S-MAC's Quarterly Revenue by Business, Q1 2013-2014
Organizational Structure of ILJIN Display
Revenue and Operating Margin of ILJIN Display, 2008-2014
Quarterly Revenue and Operating Margin of ILJIN Display, Q1 2012-Q4 2014
Revenue of ILJIN Display by Business, Q1 2011-Q4 2013
7-inch TSP Output of ILJIN Display, Q1 2010-Q4 2013
Revenue and Operating Margin of Melfas, 2007-2014
Revenue of Melfas by Product, 2007-2014
Quarterly Revenue and Operating Margin of Melfas, Q1 2013-Q4 2014
ELK's Revenue and Operating Margin, 2006-2014
ELK's Revenue by Application, 2012-2013
ELK's Revenue Customer Distribution, 2012-2013
Revenue and Operating Margin of Digitech Systems, 2007-2013
Revenue of Digitech Systems by Product, 2009-2012
Organizational Structure of Sintek Photronic
Revenue and Operating Margin of Sintek Photronic, 2004-2014
Monthly Revenue and Growth Rate of Sintek Photronic, Nov 2012-Nov 2014
Cando's Revenue and Operating Margin, 2004-2014
Cando's Monthly Revenue and Growth Rate, Nov 2012-Nov 2014
TPK's Organizational Chart
TPK's Revenue, Gross Margin and Operating Margin, 2007-2014
TPK's Quarterly Revenue and Operating Margin, Q1 2012-Q3 2014
TPK's Quarterly Revenue and Gross Margin, Q1 2011-Q3 2014
TPK's Quarterly Revenue by Size, Q1 2013-Q3 2014
TPK's Monthly Revenue and Growth Rate, Nov 2012-Nov 2014
Touch Screen Capacity, Output and Sales Volume of TPK Holding, 2008-2013
TPK's Revenue by Application, 2011-2013
Relationship between TPK Holding and Affiliated Companies
Revenue and Growth Rate of Mutto Optronics, May 2010-May 2012
Revenue and Operating Margin of Mutto Optronics, 2008-2013
Revenue of Mutto Optronics by Customer, 2012
Revenue and Net Income of Laibao Hi-tech, 2005-2014
Revenue by Business of Laibao Hi-tech, 2012-H1 2014
Revenue and Operating Margin of Shenzhen O-Film Tech, 2007-2015E
Revenue of Shenzhen O-Film Tech by Product, 2009-2015E
Quarterly Revenue of Shenzhen O-Film Tech, Q1 2009-Q3 2014
Quarterly Gross Margin of Shenzhen O-Film Tech, Q1 2009-Q3 2014
Customer Structure of Shenzhen O-Film Tech, 2012-2014
Structure of GIS
Revenue and Operating Margin of GIS, 2011-2016E
Revenue and Gross Margin of GIS, 2011-2016E
Capacity, Output and Capacity Utilization Rate of GIS, 2013
Sales Volume of GIS, 2012-2013
% of Mobile Phone Touch in Total Revenue of GIS and Gross Margin, 2012-2014
% of Tablet PC Touch in Total Revenue of GIS and Gross Margin, 2012-2014
Number of Employees of GIS, Sep 30, 2014
Employees of GIS by Educational Background, Sep 30, 2014
Employees of GIS by Region, Sep 30, 2014
R & D Organizational Structure of GIS
Production Organizational Structure of GIS
Mobile Phone Touch Cost Structure, 2012-2014
Tablet PC Touch Cost Structure, 2012-2014
Financial Summary of Subsidiaries of GIS, 2013-2014
Revenue and Operating Profit of Success Electronics, 2008-2014
Revenue of Success Electronics by Product, 2012-2014
NISSHA's Revenue and Operating Margin, FY2005-2015
NISSHA's Revenue by Business, FY2009-FY2015
NISSHA's Touch Panel Revenue by Application, FY2009-FY2015
Quarterly Revenue and Operating Margin of NISSHA, Q4 2012-Q3 2014
Quarterly Revenue and Operating Margin of NISSHA’s Touch Panel Business, Q1 2012-Q3 2014
Aimcore's Organizational Structure
Profile of Aimcore's Departments
Aimcore's Revenue and Gross Margin, 2006-2014
Aimcore's Revenue and Growth Rate, Nov 2012-Nov 2014
Token's Organizational Structure
Token's Revenue and Operating Margin, 2007-2014
Revenue and Operating Margin of G-tech Optoelectronics, 2007-2014
Monthly Revenue and Growth Rate of G-tech Optoelectronics, Nov 2012-Nov 2014
Revenue of G-tech Optoelectronics by Product, 2010-2013
Global Distribution of G-tech Optoelectronics
Business Models of G-tech Optoelectronics
Main Products of G-tech Optoelectronics
Major Customers of G-tech Optoelectronics
Customer Distribution of Shenzhen Lens, 2013
Revenue, Operating Profit and Net Income of Shenzhen Lens, 2011-2014
Assets and Liabilities of Shenzhen Lens, 2011-2013
Cash Flow of Shenzhen Lens, 2011-2013
Key Financial Indicators of Shenzhen Lens, 2011-2013
Shareholder Structure of Shenzhen Lens
Organizational Structure of Shenzhen Lens
Revenue and Net Income of Major Subsidiaries of Shenzhen Lens, 2013
Supply Structure of Major Suppliers of Shenzhen Lens, 2013
如果这份报告不能满足您的要求,我们还可以为您定制报告,请 留言说明您的详细需求。
|