|
|
|
报告导航:研究报告—
制造业—化工
|
|
2014-2017年全球及中国聚氨酯产业链研究报 |
 |
字数:3.5万 |
页数:113 |
图表数:134 |
|
中文电子版:8000元 |
中文纸版:4000元 |
中文(电子+纸)版:8500元 |
|
英文电子版:2300美元 |
英文纸版:2500美元 |
英文(电子+纸)版:2600美元 |
|
编号:HK053
|
发布日期:2014-12 |
附件:下载 |
 |
|
|
聚氨酯(Polyurethane)制品包括聚氨酯硬泡、软泡、弹性体、涂料、胶黏剂、纤维等,广泛应用于建筑、汽车、冷藏、鞋类、合成革、织物等众多领域。
2014年,全球聚氨酯制品需求量约达2030万吨,新增需求主要来源于亚太、南美等新兴市场。全球聚氨酯制品需求以硬泡和软泡为主,约占总需求量的60%。
中国是全球最大的聚氨酯制品生产国和消费国。2014年,中国聚氨酯制品需求量约占全球总需求量的45%,而且未来几年仍有望保持10%左右的增长速度,预计到2017年中国聚氨酯制品需求量占全球总需求量的比例将增长至55%。
聚氨酯硬泡和软泡是中国聚氨酯制品中需求增速较快的两类产品,2014年二者需求量占比合计46%。其中硬泡主要应用于冷藏、建筑节能、太阳能保温等领域,软泡主要应用于汽车、家具等领域,预计未来3年二者增长速度分别将达15%和12%左右。
聚氨酯上游原料包括异氰酸酯、多元醇和助剂三大类,异氰酸酯类主要为MDI、TDI,多元醇类主要为PPG、PTMEG、BDO、AA,助剂类主要为DMF。
1、MDI
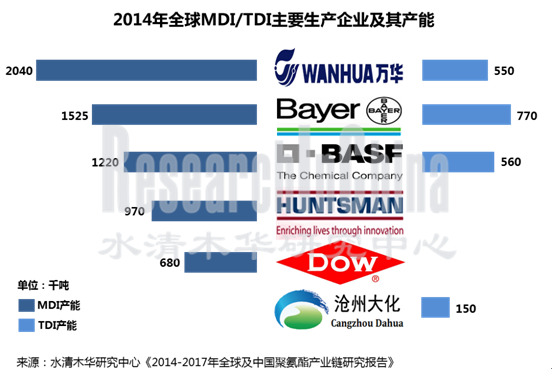
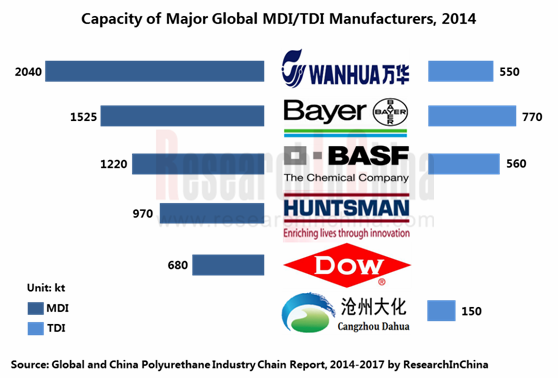
2014年,全球MDI产能约为709.5万吨,新增产能主要为万华化学的60万吨和拜耳(上海)扩建的15万吨。全球MDI行业高度集中,万华化学、拜耳和巴斯夫为产能前三的企业,产能之和占全球总产能的67.5%。
2015-2018年,全球新增MDI产能约达176万吨,且大部分位于中国。主要项目包括拜耳在上海新建的50万吨产能、巴斯夫在重庆新建的40万吨产能等。
2、TDI
2014年,全球新增TDI产能主要为万华化学30万吨和拜耳在德国的30万吨;而巴斯夫在德国新建的30万吨TDI装置将于2015年第二季度投产。
截止2014年底,全球TDI产能前三的企业为拜耳、巴斯夫和万华化学,其产能之和约占全球TDI总产能的64.8%。
3、PPG
2014年,全球聚醚多元醇总产能约达到950万吨,产能明显过剩,行业开工率仅70%左右。全球聚醚多元醇行业集中度较高,主要集中在拜耳、巴斯夫、陶氏、壳牌等跨国公司手中。
2014年,中国聚醚多元醇生产企业约有40多家,但是拥有10万吨级生产装置以上的企业仅10余家,主要企业包括高桥石化、中海壳牌、山东蓝星东大、红宝丽等。
水清木华研究中心《2014-2017年全球及中国聚氨酯产业链研究报告》主要包括以下几个内容:
 全球聚氨酯行业供需分析及预测; 全球聚氨酯行业供需分析及预测;
中国聚氨酯行业产业政策、供需分析、进出口分析、发展趋势及预测等;
全球及中国聚氨酯硬泡、软泡、弹性体、涂料等细分市场需求分析等;
全球及中国MDI、TDI、PPG等行业供需分析、竞争格局、进出口、价格分析及预测等;
中国建筑节能、冷藏、热水器、汽车等行业对聚氨酯的需求分析及预测等;
全球及中国10家聚氨酯及其原料生产企业的运营状况、聚氨酯业务分析及发展情况等。
Polyurethane products, consisting mainly of polyurethane rigid foam, flexible foam, elastomer, coatings, adhesives and fiber, find widespread application in fields like construction, automobile, refrigeration, footwear, synthetic leather and fabric.
Global demand for polyurethane products approximated 20.30 million tons in 2014, with new demand largely coming from emerging markets including Asia Pacific and South America. Rigid foam and flexible foam hold the lion’s share of demand for polyurethane products in the world, accounting for about 60% of total amount.
China is the world’s largest producer and consumer of polyurethane products. China’s demand for polyurethane products took up about 45% of global total demand, and is expected to maintain a growth rate of 10% or so over the next couple years, with the share in global demand for polyurethane products rising to 55% by 2017.
Polyurethane rigid foam and flexible foam are the two kinds of products that see fairly rapid growth in demand in China, together accounting for 46% in 2014. Rigid foam is mainly used in refrigeration, building energy conservation, solar thermal insulation, etc.; flexible foam is chiefly applied to automobile, furniture, etc. It is expected the demand for these two products will grow by about 15% and 12% over the next three years, respectively.
The upstream materials of polyurethane include three categories, namely, isocyanates (mainly MDI and TDI), polyatomic alcohols (chiefly PPG, PTMEG, BDO and AA) and auxiliaries (principally DMF).
1. MDI
Global MDI capacity was about 7.095 million tons in 2014, with new capacity mainly being 600,000 tons of Wanhua Chemical and 150,000 tons of Bayer Shanghai. Global MDI industry is highly concentrated, with Wanhua Chemical, Bayer and BASF being the top three companies in terms of capacity, together accounting for 67.5% of total global capacity.
Global new MDI capacity will stand at around 1.76 million tons during 2015-2018, mostly in China. Main projects include 500,000 tons built by Bayer in Shanghai and 400,000 tons of BASF in Chongqing.
2. TDI
In 2014, global new TDI capacities mainly cover 300,000 tons of Wanhua Chemical and 300,000 tons of Bayer in Germany. Newly-built 300,000 tons plants of BASF in Germany will go into production in the second quarter of 2015.
As of the end of 2014, global top 3 three companies in terms of TDI capacity were Bayer, BASF and Wanhua Chemical, occupying a combined 64.8% share of total global TDI capacity,
3. PPG
In 2014, global polyether polyol capacity totaled about 9.50 million tons, leading to obvious overcapacity and with a capacity utilization rate of just around 70%. Global polyether polyol industry is highly concentrated, dominated by several multinational companies such as Bayer, BASF, Dow Chemical and Shell.
In 2014, there were over 40 polyether polyol producers in China, of which only more than 10 ones boasted 100,000 tons and above plants, including mainly Sinopec Shanghai Gaoqiao Company, CNOOC and Shell Petrochemicals, Shandong Bluestar Dongda Chemical, Nanjing Hongbaoli, etc.
Global and China Polyurethane Industry Chain Report, 2014-2017 by ResearchInChina focuses on the following:
 Supply & demand and forecast in global polyurethane industry; Supply & demand and forecast in global polyurethane industry;
Industrial policies, supply & demand, import & export, development trend and forecast in China polyurethane industry;
Global and China polyurethane rigid foam, flexible foam, elastomer, coatings demand;
Supply & demand, competitive landscape, import & export, price and forecast in global and China MDI, TDI, PPG industries;
Demand for polyurethane from building energy efficiency, refrigeration, water heater and automobile industries in China and forecast;
Operation, polyurethane business and development of 10 global and Chinese polyurethane and raw materials producers.
第一章 聚氨酯行业概述
1.1 聚氨酯概述
1.2 聚氨酯原料
1.3 聚氨酯制品
1.4 产业链
第二章 聚氨酯市场总体分析
2.1 全球市场
2.2 中国市场
2.2.1 发展现状
2.2.2 政策
2.2.3 供需分析
2.2.4 进出口分析
2.2.5 发展趋势
第三章 聚氨酯细分市场分析
3.1 聚氨酯硬泡
3.1.1 概述
3.1.2 全球市场
3.1.3 中国市场
3.2 聚氨酯软泡
3.3 CASE体系
3.3.1 合成革浆料
3.3.2 涂料
3.3.3 聚氨酯弹性体
3.3.4 聚氨酯纤维
3.3.5 其他
第四章 聚氨酯上游原料分析
4.1 MDI
4.1.1 全球市场
4.1.2 中国市场
4.1.3 进出口
4.1.4 价格
4.2 TDI
4.2.1 全球市场
4.2.2 中国市场
4.2.3 进出口
4.2.4 价格
4.3 PPG
4.3.1 全球市场
4.3.2 中国市场
4.3.3 价格
4.4 其他
4.4.1 AA
4.4.2 BDO
4.4.3 PTMEG
4.4.4 DMF
4.4.5 PO
第五章 聚氨酯下游需求分析
5.1 建筑节能行业需求
5.2 冷藏行业需求
5.3 热水器行业需求
5.4 汽车行业需求
第六章 全球重点企业分析
6.1 巴斯夫
6.1.1 公司简介
6.1.2 经营情况
6.1.3 功能材料及解决方案部门经营情况
6.1.4 聚氨酯业务
6.1.5 在华业务
6.2 拜耳
6.2.1 公司简介
6.2.2 经营情况
6.2.3 拜耳材料科技经营情况
6.2.4 聚氨酯业务
6.2.5 在华发展
6.3 亨斯迈
6.3.1 公司简介
6.3.2 经营情况
6.3.3 营收构成
6.3.4 聚氨酯业务
6.3.5 在华发展
6.4 美国陶氏化学
6.4.1 公司简介
6.4.2 经营情况
6.4.3 高性能材料部门经营情况
6.4.4 聚氨酯业务
6.4.5 在华发展
6.5 日本聚氨酯工业株式会社
第七章 中国重点企业分析
7.1 万华化学
7.1.1 公司简介
7.1.2 经营情况
7.1.3 营收构成
7.1.4 毛利率
7.1.5 研发
7.1.6 聚氨酯业务
7.1.7 预测与展望
7.2 沧州大化
7.2.1 公司简介
7.2.2 经营情况
7.2.3 营收构成
7.2.4 毛利率
7.2.5 研发
7.2.6 TDI业务
7.2.7 预测与展望
7.3 烟台巨力
7.3.1 公司简介
7.3.2 TDI业务
7.4 红宝丽
7.4.1 公司简介
7.4.2 经营情况
7.4.3 营收构成
7.4.4 毛利率
7.4.5 研发
7.4.6 聚氨酯业务
7.4.7 预测与展望
7.5 联创节能
7.5.1 公司简介
7.5.2 经营情况
7.5.3 营收构成
7.5.4 毛利率
7.5.5 研发
7.5.6 客户及供应商
7.5.7 硬泡组合聚醚业务
7.5.8 预测与展望
第八章 总结与预测
8.1 总结
8.2 预测
1. Overview of Polyurethane Industry
1.1 Overview of Polyurethane
1.2 Raw Materials for Polyurethane
1.3 Polyurethane Products
1.4 Industry Chain
2. Overall Polyurethane Market
2.1 Global
2.2 China
2.2.1 Development Status Quo
2.2.2 Policy
2.2.3 Supply and Demand
2.2.4 Import and Export
2.2.5 Development Trend
3. Polyurethane Market Segments
3.1 Polyurethane Rigid Foam
3.1.1 Overview
3.1.2 Global
3.1.3 China
3.2 Polyurethane Flexible Foam
3.3 CASE System
3.3.1 Synthetic Leather Slurry
3.3.2 Coatings
3.3.3 Polyurethane Elastomer
3.3.4 Polyurethane Fiber
3.3.5 Others
4. Upstream Raw Materials of Polyurethane
4.1 MDI
4.1.1 Global
4.1.2 China
4.1.3 Import and Export
4.1.4 Price
4.2 TDI
4.2.1 Global
4.2.2 China
4.2.3 Import and Export
4.2.4 Price
4.3 PPG
4.3.1 Global
4.3.2 China
4.3.3 Price
4.4 Others
4.4.1 AA
4.4.2 BDO
4.4.3 PTMEG
4.4.4 DMF
4.4.5 PO
5. Downstream Demand for Polyurethane
5.1 Building Energy Efficiency
5.2 Refrigeration
5.3 Water Heater
5.4 Automobile
6. Major Global Companies
6.1 BASF
6.1.1 Profile
6.1.2 Operation
6.1.3 Operation of Functional Materials & Solutions
6.1.4 Polyurethane Business
6.1.5 Business in China
6.2 Bayer
6.2.1 Profile
6.2.2 Operation
6.2.3 Operation of Bayer MaterialScience
6.2.4 Polyurethane Business
6.2.5 Development in China
6.3 Huntsman
6.3.1 Profile
6.3.2 Operation
6.3.3 Revenue Structure
6.3.4 Polyurethane Business
6.3.5 Development in China
6.4 Dow Chemical
6.4.1 Profile
6.4.2 Operation
6.4.3 Operation of Performance Material Division
6.4.4 Polyurethane Business
6.4.5 Development in China
6.5 Nippon Polyurethane Industry
7. Major Chinese Companies
7.1 Wanhua Chemical
7.1.1 Profile
7.1.2 Operation
7.1.3 Revenue Structure
7.1.4 Gross Margin
7.1.5 R&D
7.1.6 Polyurethane Business
7.1.7 Prediction and Outlook
7.2 Cangzhou Dahua
7.2.1 Profile
7.2.2 Operation
7.2.3 Revenue Structure
7.2.4 Gross Margin
7.2.5 R&D
7.2.6 TDI Business
7.2.7 Prediction and Outlook
7.3 Yantai Juli Fine Chemical
7.3.1 Profile
7.3.2 TDI Business
7.4 Hongbaoli
7.4.1 Profile
7.4.2 Operation
7.4.3 Revenue Structure
7.4.4 Gross Margin
7.4.5 R&D
7.4.6 Polyurethane Business
7.4.7 Prediction and Outlook
7.5 Lecron Energy Saving Materials
7.5.1 Profile
7.5.2 Operation
7.5.3 Revenue Structure
7.5.4 Gross Margin
7.5.5 R&D
7.5.6 Customer and Supplier
7.5.7 Rigid-foam Formulated Polyol Business
7.5.8 Prediction and Outlook
8. Summary and Forecast
8.1 Summary
8.2 Forecast
表:聚氨酯材料与传统材料性能比较
表:聚氨酯原料分类
表:聚氨酯制品以及其原料和应用领域
图:聚氨酯产业链
图:2010-2014全球聚氨酯制品需求量
图:2014年全球聚氨酯制品产品结构(按需求量)
图:2014年全球聚氨酯制品地区分布(按需求量)
表:2011-2015年中国聚氨酯行业相关政策
图:2006-2014年中国聚氨酯制品需求量及同比增长
图:2014年中国聚氨酯制品产品结构(按需求量)
图:2010-2014年中国聚氨酯树脂进出口量
图:2010-2014年中国聚氨酯树脂进出口平均价格
图:2014年1-10月中国聚氨酯树脂进口来源(按进口量)
图:2014年1-10月中国聚氨酯树脂出口地区分布(按出口量)
图:中国聚氨酯产业地区分布
表:聚氨酯硬泡原料及其作用
图:2006-2014年全球聚氨酯硬泡需求量及增长率
图:2014年美国聚氨酯硬泡消费结构
图:2006-2014年中国聚氨酯硬泡需求量及增长率
图:2014年中国聚氨酯硬泡消费结构
图:2006-2014年中国聚氨酯软泡需求量及增长率
表:2014年全球MDI主要生产企业及其产能(不含精制装置)
表:2015-2018年全球主要拟/在建MDI项目
图:2014年全球MDI产能地区分布
图:2014年全球MDI主要企业产能占比
表:2010-2014年中国MDI生产企业产能
图:2010-2014年中国纯MDI进出口量
图:2010-2014年中国纯MDI进出口平均价格
图:2014年1-10月中国纯MDI进口来源分布(按进口量)
图:2014年1-10月中国纯MDI出口地区分布(按出口量)
图:2010-2014年中国聚合MDI进出口量
图:2010-2014年中国聚合MDI进出口平均价格
图:2014年1-10月中国聚合MDI进口来源分布(按进口量)
图:2014年1-10月中国聚合MDI出口地区分布(按出口量)
图:2009-2014年中国MDI月平均价格
表:2014年全球TDI主要生产商及产能
表:2015年全球部分拟/在建TDI项目
图:2014年全球TDI产能地区分布
图:2014年全球TDI主要生产企业产能占比
表:2010-2014年中国TDI生产企业产能
表:2015年中国主要拟/在建TDI项目
图:2010-2014年中国TDI进出口量
图:2010-2014年中国TDI进出口平均价格
图:2014年1-10月中国TDI进口来源(按进口量)
图:2014年1-10月中国TDI出口目的地分布(按出口量)
图:2006-2014年中国TDI月平均价格
图:2014年全球聚醚产能地区分布
表:2014年中国聚醚多元醇主要生产企业及其产能
图:2007-2014年中国聚醚多元醇产量及增长率
图:2006-2014年中国聚醚(5613)月平均价格
表:主要建筑保温材料性能比较
图:2010-2017年中国建筑节能行业对聚氨酯硬泡的需求量
表:2010-2017年中国冰箱和冰柜产量及预测
表:2010-2017年中国冰箱、冰柜对聚氨酯硬泡的需求量
图:2011-2015E中国太阳能热水器行业对聚氨酯硬泡的需求量
图:2010-2017年中国汽车产量及增长率
表:巴斯夫事业部门及其主营业务
图:2010-2014年巴斯夫销售收入及净利润
图:2014年前三季度巴斯夫(分部门)销售收入占比
图:2012-2014年巴斯夫功能材料及解决方案部门销售收入及EBITDA
图:2012-2014年巴斯夫功能材料及解决方案部门(分产品)销售收入
图:2012-2014年巴斯夫功能材料及解决方案部门(分产品)销售收入占比
图:2013年巴斯夫高性能材料业务(分地区)销售收入占比
表:巴斯夫聚氨酯产品
表:2014年巴斯夫MDI产能分布及拟/在建项目
表:2014年巴斯夫TDI产能分布及拟/在建项目
图:2010-2014年拜耳销售收入和净利润
图:2012-2014年拜耳(分部门)销售收入占比
图:2010-2014年拜耳材料科技销售收入和EBITDA
表:2012-2014年拜耳材料科技(分产品)销售收入
图:2012-2014年拜耳材料科技(分产品)销售收入占比
表:2012-2014年拜耳材料科技(分地区)销售收入
图:2012-2014年拜耳材料科技(分地区)销售收入占比
表:2014年拜耳MDI产能分布及拟/在建项目
表:2014年拜耳TDI产能分布及拟/在建项目
表:亨斯迈业务部门及主要产品
图:2010-2014年亨斯迈营业收入和净利润
表:2012-2014年亨斯迈(分部门)营业收入
图:2012-2014年亨斯迈(分部门)营业收入占比
表:2011-2013年亨斯迈(分地区)营业收入
图:2011-2013年亨斯迈(分地区)营业收入占比
图:2010-2014年亨斯迈聚氨酯部门营业收入及EBITDA
表:2013年亨斯迈MDI产能分布及拟/在建项目
图:2009-2013年陶氏化学净销售额和净利润
图:2013年陶氏化学(分部门)营业收入占比
图:2009-2013年美国陶氏化学高性能材料部门销售额及EBITDA
图:2013年陶氏化学高性能材料部门(分产品)销售额占比
表:2014年陶氏化学MDI产能分布
图:2010-2014年万华化学营业收入及净利润
表:2012-2014年万华化学(分产品)营业收入
图:2012-2014年万华化学(分产品)营业收入占比
表:2012-2014年万华化学(分地区)营业收入
图:2012-2014年万华化学(分地区)营业收入占比
表:2011-2014年万华化学主营产品毛利率
图:2011-2014年万华化学研发支出及占营业收入比例
表:万华化学主要产品
表:2011-2014年万华化学MDI产能扩张情况
图:2010-2014年万华容威营业收入及净利润
图:2013-2017年万华化学营业收入和净利润预测
图:2010-2014年沧州大化营业收入及净利润
表:2012-2014年沧州大化(分产品)营业收入
图:2012-2014年沧州大化(分产品)营业收入占比
图:2011-2014年沧州大化主营产品毛利率
图:2011-2013年沧州大化研发支出及占营业收入比例
图:2010-2014年沧州大化TDI产能、产量及开工率
图:2010-2014年沧州大化(分公司)TDI产量
图:2013-2017年沧州大化营业收入和净利润预测
图:2010-2014年红宝丽营业收入及净利润
表:2012-2014年红宝丽(分产品)营业收入
图:2012-2014年红宝丽(分产品)营业收入占比
表:2012-2014年红宝丽(分地区)营业收入
图:2012-2014年红宝丽(分地区)营业收入占比
图:2011-2014年红宝丽主营产品毛利率
图:2011-2013年红宝丽研发支出及占营业收入比例
图:2009-2014年红宝丽硬泡组合聚醚产能
图:2013-2017年红宝丽营业收入和净利润预测
图:2010-2014年联创节能营业收入及净利润
表:2012-2014年联创节能(分产品)营业收入
表:2012-2014年联创节能(分产品)营业收入占比
表:2012-2014年联创节能(分地区)营业收入
表:2012-2014年联创节能(分地区)营业收入占比
图:2011-2014年联创节能主营产品毛利率
图:2011-2013年联创节能研发支出及占营业收入比例
图:2012-2014年联创节能前五名客户贡献收入及占比
表:2013年联创节能前五名客户名称、贡献收入及占比
图:2012-2014年联创节能前五名供应商采购金额及占比
表:2014H1联创节能前五名供应商名称、采购金额及占比
图:2009-2013年联创节能硬泡组合聚醚产销量
图:2012-2013年联创节能聚氨酯板材产销量
图:2013-2017年联创节能营业收入和净利润预测
表:2013年全球及中国主要企业聚氨酯业务经营情况
图:2013-2017年全球及中国聚氨酯制品消费量预测
图:2013-2017年全球及中国MDI产能预测
图:2013-2017年全球及中国TDI产能预测
Performance Comparison of Polyurethane Materials and Traditional Materials
Classification of Polyurethane Materials
Polyurethane Products and Their Raw Materials and Application Fields
Polyurethane Industry Chain
Global Polyurethane Products Demand, 2010-2014
Global Polyurethane Products Structure by Demand, 2014
Regional Distribution of Global Polyurethane Products by Demand, 2014
Policies Concerning Polyurethane Industry in China, 2011-2015
China’s Polyurethane Products Demand and YoY Growth, 2006-2014
Structure of Polyurethane Products in China by Demand, 2014
Import and Export Volume of Polyurethane Resin in China, 2010-2014
Average Import and Export Prices of Polyurethane Resin in China, 2010-2014
Sources of Imported Polyurethane Resin in China by Import Volume, Jan.-Oct. 2014
Destinations of Exported Polyurethane Resin from China by Export Volume, Jan.-Oct. 2014
Regional Distribution of Polyurethane Industry in China
Raw Materials for Polyurethane Rigid Foam and Functions
Global Polyurethane Rigid Foam Demand and Growth Rate, 2006-2014
Polyurethane Rigid Foam Consumption Structure in the United States, 2014
China’s Polyurethane Rigid Foam Demand and Growth Rate, 2006-2014
Polyurethane Rigid Foam Consumption Structure in China, 2014
China’s Polyurethane Flexible Foam Demand and Growth Rate, 2006-2014
Major Global MDI Producers and Their Capacities (Excluding Refining Plants), 2014
Main MDI Projects Proposed/Under Construction Globally, 2015E-2018E
Regional Distribution of Global MDI Capacity, 2014
Percentage of Major Global MDI Producers’ Capacity, 2014
Capacity of Chinese MDI Producers, 2010-2014
Import and Export Volume of Pure MDI in China, 2010-2014
Average Import and Export Prices of Pure MDI in China, 2010-2014
Sources of Imported Pure MDI into China by Import Volume, Jan.-Oct. 2014
Destinations of Exported Pure MDI from China by Export Volume, Jan.-Oct. 2014
Import and Export Volume of Polymeric MDI in China, 2010-2014
Average Import and Export Prices of Polymeric MDI in China, 2010-2014
Distribution of Sources of Imported Polymeric MDI in China by Import Volume, Jan.-Oct. 2014
Distribution of Destinations of Exported Polymeric MDI from China by Export Volume, Jan.-Oct. 2014
Average Monthly Price of MDI in China, 2009-2014
Major Global TDI Producers and Their Capacities, 2014
Some TDI Projects Proposed/Under Construction, 2014
Regional Distribution of Global TDI Capacity, 2014
Percentage of Major Global TDI Producers’ Capacity, 2014
Capacity of Chinese TDI Producers, 2010-2014
Main TDI Projects Proposed/Under Construction in China, 2015
Import and Export Volume of TDI in China, 2010-2014
Average Import and Export Prices of TDI in China, 2010-2014
Sources of Imported TDI into China by Import Volume, Jan.-Oct. 2014
Destinations of Exported TDI from China by Export Volume, Jan.-Oct. 2014
Average Monthly Price of TDI in China, 2006-2014
Regional Distribution of Global Polyether Capacity, 2014
Major Chinese Polyether Polyol Producers and Their Capacities, 2014
China’s Polyether Polyol Output and Growth Rate, 2007-2014
Average Monthly Price of Polyether (5613) in China, 2006-2014
Performance Comparison of Main Building Thermal Insulation Materials
Demand for Polyurethane Rigid Foam from Building Energy Efficiency Industry, 2010-2017E
China’s Refrigerator and Freezer Output, 2010-2017E
Demand for Polyurethane Rigid Foam from Refrigerator and Freezer in China, 2010-2017E
Demand for Polyurethane Rigid Foam from Solar Water Heater Industry, 2011-2015E
China’s Automobile Output and Growth Rate, 2010-2017E
Business Segments and Primary Businesses of BASF
Revenue and Net Income of BASF, 2010-2014
Revenue Structure of BASF by Business Segment in the First Three Quarters of 2014
Revenue and EBITDA of Functional Materials & Solutions of BASF, 2012-2014
Revenue Breakdown of Functional Materials & Solutions of BASF by Product, 2012-2014
Revenue Structure of Functional Materials & Solutions of BASF by Product, 2012-2014
Percentage of Revenue from Performance Materials Business of BASF by Region, 2013
Polyurethane Products of BASF
Distribution of BASF’s MDI Capacity and Projects Proposed/Under Construction, 2014
Distribution of BASF’s TDI Capacity and Projects Proposed/Under Construction, 2014
Revenue and Net Income of Bayer, 2010-2014
Revenue Structure of Bayer by Subgroup, 2012-2014
Revenue and EBITDA of Bayer MaterialScience, 2010-2014
Revenue Breakdown of Bayer MaterialScience by Product, 2012-2014
Revenue Structure of Bayer MaterialScience by Product, 2012-2014
Revenue Breakdown of Bayer MaterialScience by Region, 2012-2014
Revenue Structure of Bayer MaterialScience by Region, 2012-2014
Distribution of Bayer’s MDI Capacity and Projects Proposed/Under Construction, 2014
Distribution of Bayer’s TDI Capacity and Projects Proposed/Under Construction, 2014
Business Segments and Main Products of Huntsman
Revenue and Net Income of Huntsman, 2010-2014
Revenue Breakdown of Huntsman by Business Segment, 2012-2014
Revenue Structure of Huntsman by Business Segment, 2012-2014
Revenue Breakdown of Huntsman by Region, 2011-2013
Revenue Structure of Huntsman by Region, 2011-2013
Huntsman’s Revenue and EBITDA from Polyurethane Segment, 2010-2014
Distribution of Huntsman’s MDI Capacity and Projects Proposed/Under Construction, 2013
Net Sales and Net Income of Dow Chemical, 2009-2013
Revenue Structure of Dow Chemical by Segment, 2013
Dow Chemical’s Revenue and EBITDA from Performance Material Segment, 2009-2013
Revenue Structure of Dow Chemical’s Performance Material Segment by Product, 2013
Distribution of Dow Chemical’s Capacity, 2014
Revenue and Net Income of Wanhua Chemical, 2010-2014
Revenue Breakdown of Wanhua Chemical by Product, 2012-2014
Revenue Structure of Wanhua Chemical by Product, 2012-2014
Revenue Breakdown of Wanhua Chemical by Region, 2012-2014
Revenue Structure of Wanhua Chemical by Region, 2012-2014
Gross Margin of Wanhua Chemical’s Main Products, 2011-2014
R&D Costs and % of Total Revenue of Wanhua Chemical, 2011-2014
Main Products of Wanhua Chemical
MDI Capacity Expansion of Wanhua Chemical, 2011-2014
Revenue and Net Income of Wanhua Rongwei Polyurethane, 2010-2014
Revenue and Net Income of Wanhua Chemical, 2013-2017E
Revenue and Net Income of Cangzhou Dahua, 2010-2014
Revenue Breakdown of Cangzhou Dahua by Product, 2012-2014
Revenue Structure of Cangzhou Dahua by Product, 2012-2014
Gross Margin of Cangzhou Dahua’s Main Products, 2011-2014
R&D Costs and % of Total Revenue of Cangzhou Dahua, 2011-2013
TDI Capacity, Output and Utilization of Cangzhou Dahua, 2010-2014
TDI Output of Cangzhou Dahua by Company, 2010-2014
Revenue and Net Income of Cangzhou Dahua, 2013-2017E
Revenue and Net Income of Hongbaoli, 2010-2014
Revenue Breakdown of Hongbaoli by Product, 2012-2014
Revenue Structure of Hongbaoli by Product, 2012-2014
Revenue Breakdown of Hongbaoli by Region, 2012-2014
Revenue Structure of Hongbaoli by Region, 2012-2014
Gross Margin of Hongbaoli’s Main Products, 2011-2014
R&D Costs and % of Total Revenue of Hongbaoli, 2011-2013
Rigid-foam Formulated Polyether Capacity of Hongbaoli, 2009-2014
Revenue and Net Income of Hongbaoli, 2013-2017E
Revenue and Net Income of Lecron Energy Saving Materials, 2010-2014
Revenue Breakdown of Lecron Energy Saving Materials by Product, 2012-2014
Revenue Structure of Lecron Energy Saving Materials by Product, 2012-2014
Revenue Breakdown of Lecron Energy Saving Materials by Region, 2012-2014
Revenue Structure of Lecron Energy Saving Materials by Region, 2012-2014
Gross Margin of Lecron Energy Saving Materials’ Main Products, 2011-2014
R&D Costs and % of Total Revenue of Lecron Energy Saving Materials, 2011-2013
Lecron Energy Saving Materials’ Revenue from Top 5 Customers and % of Total Revenue, 2012-2014
Name List and Revenue Contribution of Lecron Energy Saving Materials’ Top 5 Customers, 2013
Lecron Energy Saving Materials’ Procurement from Top 5 Suppliers and % of Total Procurement, 2012-2014
Name List and Procurement of Lecron Energy Saving Materials’ Top 5 Suppliers, 2014H1
Rigid-foam Formulated Polyether Output and Sales Volume of Lecron Energy Saving Materials, 2009-2013
Polyurethane Sheet Output and Sales Volume of Lecron Energy Saving Materials, 2012-2013
Revenue and Net Income of Lecron Energy Saving Materials, 2013-2017E
Operation of Major Global and Chinese Companies’ Polyurethane Business, 2013
Global and China Polyurethane Products Consumption, 2013-2017E
Global and China MDI Capacity, 2013-2017E
Global and China TDI Capacity, 2013-2017E
如果这份报告不能满足您的要求,我们还可以为您定制报告,请 留言说明您的详细需求。
|