|
|
|
报告导航:研究报告—
TMT产业—电子半导体
|
|
2014-2015年全球及中国CMOS摄像模组行业研究报告 |
 |
字数:3.6万 |
页数:210 |
图表数:224 |
|
中文电子版:9000元 |
中文纸版:4500元 |
中文(电子+纸)版:9500元 |
|
英文电子版:2600美元 |
英文纸版:2800美元 |
英文(电子+纸)版:2900美元 |
|
编号:ZYW195
|
发布日期:2015-01 |
附件:下载 |
 |
|
|
《2014-2015年全球及中国CCM(CMOS摄像模组)行业研究报告》包含以下内容:
1、CIS(CMOS Image Sensor)市场与产业
2、镜头(Lens)产业
3、CCM产业与市场
4、OIS\双镜头发展趋势
5、CIS下游市场
6、7家CIS厂家研究
7、15家Lens厂家研究
8、22家CCM厂家研究
2014年全球CCM市场规模大约为164.02亿美元,比2013年增长13.4%,主要增长动力来自手机更高的拍照像素以及OIS。预计2015年OIS会急速扩张,带动CCM市场增长15.9%,达到190.18亿美元。当然手机的拍照像素也将继续提高,也是市场增长的动力之一。
2014年采用OIS的手机以苹果的iphone 6plus为最大份额,大约占25%,出货量1820万部,其次是三星的Galaxy Note4 ,出货量大约为600万部。预计2015年三星的S6和中国大多数旗舰手机都会采用OIS,苹果新一代手机也将全面采用OIS,预计2015年采用OIS的手机出货量将达到1.78亿部,比2014年增长145%。而到2017年可以达到3.61亿部。
手机OIS摄像模块有两个技术路线:分别为基于平移式(Pure shift)OIS Motor以及基于移轴式(Tilt-shift)AF Motor。Pure shift目前优势明显,因为其标准早已确立,系统成熟度非常好,且性能也最好,供应链也最成熟,且绝大多数是日本供应商。目前大多数厂家如苹果和诺基亚OIS都选择了Pure shift,即便摄像头不得不凸出,但苹果还是坚持使用Pure shift,足见Pure shift的竞争力很强大。Tilt-shift则主要是大陆厂家和HTC在做,缺乏统一的标准,CCM厂家有很多工作要做,虽然其理论上成本低,但产量低,加上标准不统一,导致其成本低的优势不存在。市场可能不会给Tilt-shift留下成长空间,Pure shift会迅速占领市场。
高通与联发科准备把双镜头软件功能整合到芯片组与公板,可大幅提高高阶主流机种采用双镜头的比例。不过双镜头只是提供更多特效,并未提高照相性能,从HTC的M8配置来看,该手机的双摄像头均为4MP,离主流的800万像素以上高端手机有差距,显然其定位为中档手机。
如果双镜头都采用高像素CCM,那么成本会大增,可能会超过OIS,而消费者对双镜头的认同感远不如OIS,毕竟苹果、三星、诺基亚、LG都有主流机型使用了OIS,而双镜头则只有两款非主流手机使用。因此双镜头可能只在中档手机上出现,并且也不会有太多厂家采用。
CIS领域,索尼继续一枝独秀,引领高端市场。OVT紧追不舍,三星已经有些力不从心。镜头领域,大立光横扫全球,几乎拿走了镜头领域90%的利润,试图进军高端的韩国厂家收入锐减,部分出现亏损。CCM领域夏普得益于OIS,收入大增。
SEMCO本身是三星第一大供应商,为了分散对大客户三星的依赖,又觊觎大陆手机快速崛起。2014年SEMCO全力以赴开拓大陆市场,不过成效不佳,不仅大陆市场未打开,也丧失了大客户三星,2014年收入下滑明显。SEMCO的位置被台湾光宝迅速填补,并且光宝是仅次于夏普的第二大OIS供应者,2014年收入大增。
LG INNOTEK仍然是苹果第一大供应商,收入小幅增长。大陆舜宇得益于大客户小米、联想、OPPO出货量大增,收入也大增。此外索尼也加入CCM领域,并且雄心勃勃,要在2017年做到10亿美元以上的收入。毫无疑问,CCM领域竞争会愈发激烈,毛利率下滑不可避免。
Global and China CCM (CMOS Camera Module) Industry Report, 2014-2015 covers the following:
1. CIS (CMOS Image Sensor) market and industry
2. Lens industry
3. CCM industry and market
4. Development trend of OIS/dual lens
5. CIS downstream market
6. Study into 7 CIS vendors
7. Research on 15 Lens vendors
8. Analysis of 22 CCM vendors
In 2014, global CCM market size was worth about USD16.402 billion, growing by 13.4% from 2013, mainly stimulated by higher camera pixel of mobile phone and OIS. It is expected that OIS will expand rapidly in 2015, spurring CCM market to rise by 15.9% to USD19.018 billion. Also, the camera pixel of mobile phone will continue to be improved, being one of stimuli for market growth.
In 2014, iPhone 6Plus took up the largest share of mobile phones which adopt OIS with shipments of 18.20 million (about 25%), followed by Samsung Galaxy Note4 with shipments of about 6 million. It is projected that Samsung S6 and most of flagship phones in China will use OIS, and new generation Apple phone will also fully adopt OIS. It is estimated that shipments of mobile phones adopting OIS will amount to 178 million in 2015, surging by 145% against 2014, and will reach 361 million in 2017.
There are two technological routes for OIS camera module of mobile phone: one is based on Pure shift OIS Motor and the other Tilt-shift AF Motor. Pure shift has significant advantage over Tilt-shift, as the standard has long been established, system maturity is excellent, performance is the best, and supply chain is the most mature with majority of suppliers being Japanese ones. The bulk of vendors like Apple and Nokia adopt Pure shift. Even though the camera has to protrude, Apple insists on using Pure shift, showing powerful competitiveness of Pure shift. Vendors in Mainland China and HTC adopt Tilt-shift without a universally accepted standard. Moreover, there are lots of work to be done by CCM vendors. Low output and lack of unified standard cause the loss of its theoretically low cost advantage. The market may leave no growth room for Tilt-shift, and be swiftly captured by Pure shift.
Qualcomm and MediaTek planned to integrate dual lens software function into chipset and CRB (Customer Reference Board), thus greatly boosting percentage of high-end mainstream mobile phones using dual lens. However, dual lens provide only more special effects, but can’t enhance camera performance. Seen from configuration of HTC M8, the mobile phone has 4MP dual cameras, still a gap with mainstream 8 million pixel high-end mobile phones, obvious positioned as a middle-range phone.
If dual cameras both adopt high-pixel CCM, the cost will surge and may surpass that of OIS. Consumers has very low acceptance of dual lens compared with OIS. After all, Apple, Samsung, Nokia and LG have mainstream models using OIS, in contrast to two non-mainstream mobile phones adopting dual lens. Hence, dual lens may appear on middle-range mobile phones, and are unlikely to be utilized by a large number of vendors.
In CIS field, Sony continues to outshine rivals, leading high-end market and chased by OVT, but Samsung is falling short of its desires. With regard to lens, Largan sweeps over the world, grasping almost 90% of profit in the field and leading to sharp decline in revenue and partly operating loss of South Korean vendors which seek to advance into high-end segment. In CCM field, Sharp benefited from OIS and its revenue surged.
SEMCO is the largest supplier for Samsung. In order to reduce its dependence on Samsung and enter the burgeoning mobile phone market in Chinese Mainland, the company spared no effort to exploit the mainland market, but achieved poor results, not only failing to open up the market, but also loosing major customer- Samsung, with revenue declining distinctly. LITEON filled the position of SEMCO quickly, and became the second largest supplier of OIS for Samsung, behind Sharp. LITEON saw a surge in revenue in 2014.
LG INNOTEK is still the largest supplier for Apple, with slight rise in revenue. Thanks to big increase in shipments from major customers including Xiaomi, Lenovo and OPPO, Sunny Optical Technology also saw a substantial rise in revenue. In addition, Sony also entered CCM field with ambition, aiming to earn revenue of over USD1 billion in 2017. Undoubtedly, the competition in CCM field will prick up, and the gross margin will inevitably slide.

第一章、CMOS相机模组产业
1.1、CMOS相机模组产业链
1.2、CMOS图像传感器行业
1.3、CIS图像传感器市场
1.4、CMOS IMAGE SENSOR厂家市场占有率
1.5、中国CIS市场
1.6、光学镜头行业
1.7、CMOS相机模组行业
1.8、CMOS相机模组与品牌厂家供应关系
1.9、AFA(VCM)简介
1.10、AFA行业格局
1.11、OIS简介
1.12、手机OIS现状
1.13、VCM驱动IC
1.14、汽车摄像模组Automotive Camera 市场
1.15、主要汽车摄像模组厂家市场占有率
1.16、双镜头
第二章、CMOS相机模组市场
2.1、全球手机市场
2.2、全球智能手机市场
2.3、中国手机市场
2.4、平板电脑市场
第三章、CMOS图像传感器厂家研究
3.1、三星电子
3.2、Omnivision
3.3、APTINA
3.4、索尼
3.5、东芝
3.6、格科微电子
3.7、思比科微电子
第四章、光学镜头厂家研究
4.1、大立光电
4.2、玉晶光电
4.3、亚洲光学
4.4、新钜科技
4.5、先进光电
4.6、KANTATSU
4.7、日立万胜
4.8、DIOSTECH
4.9、SEKONIX
4.10、高丽光学
4.11、FUJINON
4.12、光耀光电GLORY
4.13、和光光学HOKUGANG
4.14、KMOT
4.15、Digital Optics
第五章、相机模组厂家研究
5.1、群光
5.2、Vista Point Technologies
5.3、鸿海
5.3.1、全亿大科技
5.3.2、佛山普立华
5.3.3、富晋精密工业(晋城)
5.4、LG INNOTEK
5.5、三美电机
5.6、信利光电
5.7、比亚迪光电
5.8、光宝科技LITEON
5.9、致伸科技
5.10、SEMCO
5.11、Partron
5.12、Sunny Optical
5.13、CAMMSYS
5.14、Powerlogic
5.15、MCNEX
5.16、Cowell
5.17、欧菲光
5.18、昆山丘钛微电子Q-TECH
5.19、Globaloptics
5.20、深圳盛泰光电Shine Tech
5.21、夏普
5.22、STMicroelectronics
5.23、其他
5.23.1、深圳市金康光电KingCome
5.23.2、广州大凌实业Darling
第六章、AFA厂家研究
6.1、HYSONIC
6.2、韩国磁化电子JAHWA
1. CMOS Camera Module Industry
1.1 CMOS Camera Module Industry Chain
1.2 CMOS Image Sensor Industry
1.3 CMOS Image Sensor Market
1.4 Market Share of Image Sensor Vendors
1.5 China CMOS Image Sensor Market
1.6 Optical Lens Industry
1.7 CMOS Camera Module Industry
1.8 Relationship between CMOS Camera Modules and Brand Vendors
1.9 Brief Introduction to AFA (VCM)
1.10 AFA Industry Pattern
1.11 Brief Introduction to OIS
1.12 Status Quo of Mobile Phone OIS
1.13 VCM Driver IC
1.14 Automotive Camera Module Market
1.15 Market Share of Major Automotive Camera Module Vendors
1.16 Dual Lens
2. CMOS Camera Module Market
2.1 Global Mobile Phone Market
2.2 Global Smartphone Market
2.3 Chinese Mobile Phone Market
2.4 Tablet PC Market
3. CMOS Image Sensor Vendors
3.1 Samsung Electronics
3.2 Omnivision
3.3 APTINA
3.4 Sony
3.5 Toshiba
3.6 Galaxycore
3.7 Superpix Micro Technology
4. Optical Lens Vendors
4.1 Largan
4.2 GSEO
4.3 Asia Optical
4.4 Newmax
4.5 Ability Opto-Electronics Technology
4.6 KANTATSU
4.7 Hitachi Maxell
4.8 DIOSTECH
4.9 SEKONIX
4.10 Korea Optical
4.11 FUJINON
4.12 GLORY
4.13 HOKUGANG
4.14 KMOT
4.15 Digital Optics
5. Camera Module Vendors
5.1 Chicony
5.2 Vista Point Technologies
5.3 Hon Hai
5.3.1 Champ Tech Optical
5.3.2 Foshan Pulihua
5.3.3 Fu Jin Precision Industry Jincheng
5.4 LG INNOTEK
5.5 Mitsumi Electric
5.6 Truly Opto-Electronics
5.7 BYD Optical
5.8 LITEON Technology
5.9 Primax
5.10 SEMCO
5.11 Partron
5.12 Sunny Optical
5.13 CAMMSYS
5.14 Powerlogic
5.15 MCNEX
5.16 Cowell
5.17 O-film
5.18 Q-TECH
5.19 Globaloptics
5.20 Shine Tech
5.21 Sharp
5.22 STMicroelectronics
5.23 Others
5.23.1 KingCome
5.23.2 Darling
6. AFA Vendors
6.1 HYSONIC
6.2 JAHWA Electronics
CMOS相机模组产业链
2009-2013年8MP CCM成本结构
2012-2013年13MP CCM成本结构
Image Sensor厂家供应链
2011-2013年主要CIS厂家出货量像素分布
2010-2016年CIS(CMOS IMAGE SENSOR)市场规模
2010-2016年CIS(CMOS IMAGE SENSOR)出货量
2010-2016年CIS(CMOS IMAGE SENSOR)出货量下游分布
2005-2018年手机用Camera Pixel分布
2013-2014年Global CIS Vendor Market share by volume
2013-2014年Global CIS Vendor Market share by Revenue
2010年全球主要CMOS IMAGE SENSOR厂家市场占有率
2011年全球主要CMOS IMAGE SENSOR厂家市场占有率
2012年全球主要CMOS IMAGE SENSOR厂家市场占有率
2012年全球主要CMOS IMAGE SENSOR厂家市场占有率(量)
2012年PC领域全球主要CMOS IMAGE SENSOR厂家市场占有率(量)
2010-2018 Global and china CIS Market Volume for Mobile Phone
2010-2018 Global and china CIS Market by Pixel Count
2010-2013 China CIS Vendor Market Share by volume
2010-2013 China CIS Vendor Market Share by Revenue
2011-2014年全球主要CMOS相机光学镜头厂家收入排名
2010-2016年全球CMOS相机模组市场规模
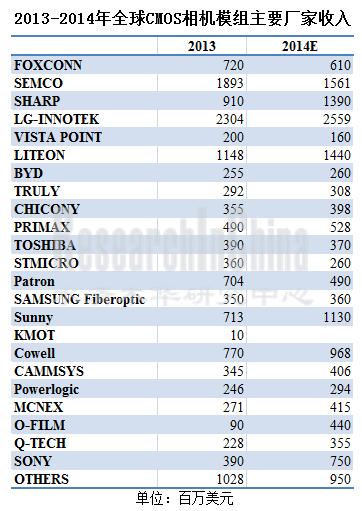
2010-2014年全球CMOS相机模组主要厂家收入排名
2014年10月中国十大CCM厂家出货量
2013年诺基亚相机模组供应商分布
2013-2014年三星相机模组供应商分布
2013-2014年苹果相机模组供应商分布
2012年LG相机模组供应商分布
2013年ZTE相机模组供应商分布
2013-2014年华为相机模组供应商分布
2013-2014年联想相机模组供应商分布
2014年小米相机模组供应商分布
VCM直观图
VCM剖面图
AFA与相机模组厂家之间供应关系
2012年全球主要AFA厂家市场占有率
OIS结构图
2012-2017年采用OIS的手机出货量
光宝8M OIS模块
光宝的13M OIS模块
2009-2016年全球Automotive Camera Module 出货量
2012年主要汽车摄像模组厂家市场占有率
2007-2015年全球手机出货量
2011-2014年全球3G/4G手机出货量地域分布
Worldwide Mobile Phone Sales to End Users by Vendor in 2013 (Thousands of Units)
2014年3季度全球十大手机厂家出货量
Worldwide Smartphone Sales to End Users by Vendor in 2013 (Thousands of Units)
Worldwide Smartphone Sales to End Users by Operating System in 2013 (Thousands of Units)
2013-2015年全球Top 13智能手机厂家出货量
2014年3季度主要智能手机厂家出货量
2014年1-10月中国手机月度出货量
2014年中国智能手机市场主要厂家市场占有率
2014年中国4G手机市场主要厂家市场占有率
2011-2016年全球平板电脑出货量
2013年平板电脑主要品牌市场占有率
2012、2013年全球平板电脑制造厂家产量
FY2009-FY2015 Omnivision收入与毛利率
FY2009-FY2015 Omnivision收入与运营利润率
FY2009-FY2015 Omnivision出货量
FY2009-FY2014 Omnivision收入地域分布
FY2009-FY2014 Omnivision资产地域分布
FY2011-FY2014 Omnivision收入下游应用分布
FY2013-FY2014 Omnivision收入Resolution分布
OVT各领域市场占有率
Omninvision 供应链
Aptina收入下游分布
索尼半导体事业部组织结构
索尼图像传感器产能扩展计划
image sensor应用分布
2011-2014年Galaxycore收入与毛利率
2011-2014年Galaxycore收入产品分布
2011-2014年Galaxycore收入像素分布by pixel
2011-2014年Galaxycore产品出货量
2011-2014年Galaxycore资产、负债与现金流
2006-2015年大立光收入与毛利率
2006-2015年大立光收入与运营利润率
2012年1季度-2014年4季度大立光季度收入与净利率
2012年11月-2014年11月大立光月度收入
2011年1季度-2013年1季度大立光季度收入像素分布
2010-2014年大立光收入客户分布
大立光电大陆子公司2013年财务数据
2005-2015年玉晶光电收入与毛利率
2005-2015年玉晶光电收入与运营利润率
2012年11月-2014年11月玉晶光月度收入
2007-2015年亚光收入与毛利率
2007-2014年亚光收入与运营利润率
2012年11月-2014年11月亚洲光学月度收入
2007-2012年亚光收入产品分布
2007-2014年新钜科技收入与毛利率
2012年11月-2014年11月新钜科技月度收入
2006-2014年先进光电收入与毛利率
2012年11月-2014年11月先进光电每月收入
KANTATSU手机相机模组产品一览
2013年DIOSTECH收入业务分布
2013年DIOSTECH产能、产量、产能利用率
DIOSTECH组织结构
DIOSTECH生产线
DIOSTECH客户
2012年DIOSTECH收入像素分布
2002-2015年SEKONIX收入与运营利润率
2009-2014年SEKONIX收入产品分布
2009-2014年Sekonix Handset Lens业务收入像素分布
2009-2014年Sekonix Handset Lens出货量收入像素分布
2007-2015年高丽光学收入与运营利润率
高丽光学路线图
2006-2014年光耀科技收入与运营利润率
2012年11月-2014年11月光耀科技每月收入
2006-2014年和光光学收入毛利率
2012年11月-2014年11月和光光学每月收入
2011-2012财年 KMOT Optical Units for Cell Phones 收入
2007-2015年Digital Optics收入与运营利润率
2010-2013年Digital Optics收入像素分布
2009-2013年Digital Optics出货量像素分布
2009-2013年Digital Optics CAPEX
2009-2013年Digital Optics产能
2011-2014年Digital Optics原材料成本分布
2011-2013年主要相机模组厂家出货量像素分布
2005-2015年群光收入与毛利率
2005-2015年群光收入与运营利润率
2012年11月-2014年11月群光月度收入
2011-2014年群光收入产品分布
2012年群光主要大陆子公司财务数据
鸿海光学领域主要子公司2013年财务数据
2006-2015年LG INNOTEK收入与运营利润率
2012年1季度-2014年4季度LG INNOTEK收入与运营利润率
2011-2015年LG INNOTEK 收入业务分布
2011-2015年LG INNOTEK 运营利润业务分布
2011年1季度-2014年4季度LG INNOTEK Optical季度收入
2012年3季度-2014年3季度LG INNOTEK CCM像素分布
2006-2015财年三美电机收入与运营利润率
2006-2014财年三美电机收入产品分布
Q3/2014 三美电机Backlog部门分布
2005-2014年信利国际收入与运营利润率
2013年1季度-2014年4季度信利国际季度收入与毛利率
2006-2011年信利国际LCD业务收入技术分布
2012-2015年信利半导体收入业务分布
2012-2015年信利半导体各项产品出货量
2012-2015年信利半导体各项产品ASP
信利手机LCD主要客户
信利汽车显示器主要客户
信利触摸屏产能
信利CCM主要客户
比亚迪相机模组产品一览
2013年1季度-2014年3季度光宝季度收入部门分布
2003-2013年光宝CCM出货量
2011年3季度-2013年4季度光宝CCM产能扩展计划
光宝 AF /FF CCM比例
光宝CCM技术路线图
光宝的OIS Concept
2005-2015年光宝收入与运营利润率
致伸科技Key Milestone
2008-2015年致伸科技收入与营业利润率
2007-2012年致伸科技收入部门分布
2012年11月-2014年11月致伸科技每月收入
致伸全球分布
致伸科技产品范围
2011-2015年SEMCO收入与营业利润
2010-2015年SEMCO收入部门分布
2010-2015年SEMCO运营利润部门分布
2011年1季度-2013年4季度SEMCO CCM业务运营利润率
2010-2014年SEMCO相机模组业务收入像素分布
2013-2015年SEMCO相机模组业务三星客户供应比例
2010年1季度-2013年4季度SEMCO相机模组ASP
2007-2015年Partron收入与运营利润率
2012年1季度-2014年4季度Patron收入产品分布
2013-2015年Partron CCM收入像素分布
2004-2015年舜宇收入与毛利率
2009-2013年5年财务概要Five-year Financial Summary
舜宇主要客户
2014年1月-2014年11月舜宇各项产品月度出货量
2010-2014年舜宇收入部门分布
2010-2014年舜宇收入下游分布
Sunny Optical camera module shipment breakdown by pixel 2012-2014
2010-2014年舜宇各部门毛利率
2012-2016年Sunny Optical毛利产品分布
2012-2016 年Sunny Optical Handset Lens Shipment
2012-2016 年Sunny Optical Automotive Lens Revenue
舜宇工厂分布
CAMMSYS组织结构图
2009-2015年CAMMSYS收入与营业利润率
2011-2014年CAMMSYS原材料价格
2009-2015年Powerlogic收入与营业利润
2012-2014年Powerlogic CCM ASP
2012-2014年Powerlogic CCM Component ASP
2012-2014年Powerlogic CCM产能
2012-2014年Powerlogic CCM产量
2009-2015年MCNEX收入与营业利润
2013年MCNEX收入客户分布
2010-2014年MCNEX收入应用分布
2009-2011年MCNEX收入像素分布
MCNEX 产能地域分布
东莞高伟2005-2014年收入与员工数
2007-2015年欧菲光收入与运营利润率
2009-2015年欧菲光收入产品分布
2009年1季度-2014年3季度欧菲光季度收入
2009年1季度-2014年3季度欧菲光季度毛利率
2012-2014年欧菲光客户结构
2011-2014年Q-TECH收入与毛利率
2011-2014年Q-TECH财务数据
2011-2014年Q-TECH现金流
2011-2014 Q-TECH出货量
2011-2014 Q-TECH收入by pixel
2011-2014 Q-TECH出货量by pixel
2011-2014 Q-TECH 产品 ASP
2011-2014 Q-TECH 产品毛利率
2014年Q-TECH客户分布
2009-2014年GAI收入与营业利润
2009-2014年GAI收入与毛利润
FY2008-FY2015 SHARP 收入与营业利润率
FY2013-FY2015 SHARP收入业务分布
FY2013-FY2015 SHARP 各项业务营业利润率
夏普OIS路线图
STMicro组织结构
2012年4季度-2014年3季度STMicro季度营业利润率
2014年3季度STMicro收入部门分布
HYSONIC结构
2006-2014年HYSONIC收入与运营利润
2014年3月底Personnel organization of Hysonic
HYSONIC 主要产品
2012-2013年Hysonic收入最终客户分布
2012-2013年HYSONIC收入客户分布
2005-2015年Jahwa收入与运营利润率
1Q13-4Q15 JAHWA季度收入产品分布
磁化电子海外子公司一览
CMOS Camera Module Industry Chain
Cost Structure of 8MP CCM, 2009-2013
Cost Structure of 13MP CCM, 2012-2013
Supply Chain of Image Sensor Vendors
Shipment of Global Leading CMOS Image Sensor Vendors by Pixel, 2011-2013
Market Size of CMOS Image Sensor, 2010-2016E
Shipment of CMOS Image Sensor, 2010-2016E
Shipment of CMOS Image Sensor by Application, 2010-2016E
Global Shipment of Mobile Phone-used CMOS Camera Module by Pixel, 2005-2018E
Global CMOS Image Sensor Vendors Market Share by Volume, 2013-2014
Global CMOS Image Sensor Vendors Market Share by Revenue, 2013-2014
Market Share of Major Global CMOS Image Sensor Vendors, 2010
Market Share of Major Global CMOS Image Sensor Vendors, 2011
Market Share of Major Global CMOS Image Sensor Vendors, 2012
Market Share of Major Global CMOS Image Sensor Vendors by Volume, 2012
Market Share of Major Global CMOS Image Sensor Vendors in PC Field by Volume, 2012
Global and China CMOS Image Sensor Market Volume for Mobile Phone, 2010-2018E
Global and China CMOS Image Sensor Market by Pixel Count, 2010-2018E
China CMOS Image Sensor Vendor Market Share by Volume, 2010-2013
China CMOS Image Sensor Vendor Market Share by Revenue, 2010-2013
Ranking of Major Global CMOS Camera Optical Lens Vendors by Revenue, 2011-2014
Market Size of Global CMOS Camera Modules, 2010-2016E
Revenue of World’s Leading CMOS Camera Module Vendors, 2010-2014
Shipment of Top Ten CMOS Camera Module Vendors in China, Oct.2014
Distribution of Nokia Camera Module Suppliers, 2013
Distribution of Samsung Camera Module Suppliers, 2013-2014
Distribution of Apple Camera Module Suppliers, 2013-2014
Distribution of LG Camera Module Suppliers, 2012
Distribution of ZTE Camera Module Suppliers, 2013
Distribution of Huawei Camera Module Suppliers, 2013-2014
Distribution of Lenovo Camera Module Suppliers, 2013-2014
Distribution of Xiaomi Camera Module Suppliers, 2014
VCM Illustrative Diagram
VCM Profile Map
Supply Relationship between AFA and Camera Module Vendor
Market Share of Global Leading AFA Companies, 2012
OIS Structural Chart
Shipment of Mobile Phone with OIS, 2012-2017E
LITE-ON 8M OIS Module
LITE-ON 13M OIS Module
Global Shipment of Automotive Camera Modules, 2009-2016E
Market Share of Major Automotive Camera Module Vendors, 2012
Global Mobile Phone Shipments, 2007-2015E
Global 3G/4G Mobile Phone Shipments by Region, 2011-2014
Worldwide Mobile Phone Sales to End Users by Vendor in 2013
Shipment of Global Top Ten Mobile Phone Vendors, 2014Q3
Worldwide Smartphone Sales to End Users by Vendor in 2013
Worldwide Smartphone Sales to End Users by Operating System in 2013
Shipments of Global Top 13 Smartphone Vendors, 2013-2015E
Shipment of Major Smart Phone Vendors, 2014Q3
Monthly Shipment of Mobile Phone in China, Jan.-Oct.2014
Market Share of Major Vendors in Chinese Smart Phone Market, 2014
Market Share of Major Vendors in Chinese 4G Mobile Phone Market, 2014
Global Tablet PC Shipments, 2011-2016E
Market Share of Major Tablet PC Brands, 2013
Output of Global Tablet PC Vendors, 2012-2013
OMNINVISION's Revenue and Gross Margin, FY2005-FY2015
OMNINVISION's Revenue and Operating Margin, FY2005-FY2015
OMNINVISION's Shipment, FY2003-FY2015
OMNINVISION's Revenue by Region, FY2009-FY2014
OMNINVISION's Assets by Region, FY2009-FY2014
OMNINVISION's Revenue by Application, FY2011-FY2014
OMNINVISION's Revenue by Resolution, FY2013-FY2014
Market Share of OVT by Application
OMNINVISION's Supply Chain
Aptina’s Revenue by Application, FY2013
Organizational Structure of Sony's Semiconductor Division
Sony's Image Sensor Capacity Expansion Plan
Application Distribution of Sony Image Sensor
Revenue and Gross Margin of Galaxycore, 2011-2014
Revenue of Galaxycore by Product, 2011-2014
Revenue of Galaxycore by Pixel, 2011-2014
Shipment of Galaxycore, 2011-2014
Assets, Liabilities and Cash Flow of Galaxycore, 2011-2014
Largan’s Revenue and Gross Margin, 2006-2015
Largan’s Revenue and Operating Margin, 2006-2015
Largan’s Quarterly Revenue and Net Profit Margin, Q1 2012-Q4 2014
Largan’s Monthly Revenue, Nov. 2012-Nov 2014
Largan’s Quarterly Revenue by Pixel, Q1 2011-Q1 2013
Largan’s Revenue by Client, 2010-2014
Financial Data of Largan’s Subsidiaries in Mainland China, 2013
GSEO’s Revenue and Gross Margin, 2005-2015
GSEO’s Revenue and Operating Margin, 2005-2015
GSEO’s Monthly Revenue, Nov.2012-Nov.2014
Revenue and Gross Margin of Asia Optical, 2007-2015
Revenue and Operating Margin of Asia Optical, 2007-2015
Monthly Revenue of Asia Optical, Nov.2012-Nov.2014
Revenue of Asia Optical by Product, 2007-2012
Newmax’s Revenue and Gross Margin, 2007-2014
Monthly Revenue of Newmax, Nov.2012-Nov.2014
Revenue and Gross Margin of Ability Opto-Electronics Technology, 2006-2014
Monthly Revenue of Ability Opto-Electronics Technology, Nov. 2012-Nov. 2014
KANTATSU’s Mobile Phone Camera Module
DIOSTECH’s Revenue by Business, 2013
Capacity, Output and Capacity Utilization of DIOSTECH, 2013
DIOSTECH’s Organizational Structure
DIOSTECH’s Production Lines
DIOSTECH’s Clients
DIOSTECH’s Revenue by Pixel, 2012
SEKONIX’s Revenue and Operating Margin, 2002-2015
SEKONIX’s Revenue by Product, 2009-2014
SEKONIX’s Handset Lens Revenue by Pixel, 2009-2014
SEKONIX’s Handset Lens Shipment by Pixel, 2009-2014
Revenue and Operating Margin of Korea Optical, 2007-2015
Roadmap of Korea Optical
Revenue and Operating Margin of GloryTek, 2006-2014
Monthly Revenue of GloryTek, Nov. 2012-Nov. 2014
Hokuang’s Revenue and Gross Margin, 2006-2014
Hokuang’s Monthly Revenue, Nov.2012-Nov. 2014
Revenue of KMOT’s Mobile Phone-used Optical Units, FY2011-FY2012
Revenue and Operating Margin of DIGITAL OPTICS, 2007-2015
Revenue of DIGITAL OPTICS by Pixel, 2010-2013
Shipment of DIGITAL OPTICS by Pixel, 2009-2013
Digital Optics CAPEX, 2009-2013
Capacity of DIGITAL OPTICS, 2009-2013
Raw Materials Cost Structure of Digital Optics, 2011-2014
Shipment of Major Camera Module Vendors by Pixel, 2011-2013
Chicony’s Revenue and Gross Margin, 2005-2015
Chicony’s Revenue and Operating Margin, 2005-2015
Chicony’s Monthly Revenue, Nov. 2012-Nov. 2014
Chicony’s Revenue by Product, 2011-2014
Financial Data of Chicony’s Major Subsidiaries in Mainland China, 2012
Financial Data of Foxconn's Major Optical Subsidiaries, 2013
Revenue and Operating Margin of LG INNOTEK, 2006-2015
Revenue and Operating Margin of LG INNOTEK, Q1 2012-Q4 2014
Revenue of LG INNOTEK by Business, 2011-2015
Operating Income of LG INNOTEK by Business, 2011-2015
Quarterly Revenue of LG INNOTEK OPTICAL, Q1 2011-Q4 2014
CCM of LG INNOTEK by Pixel, Q3 2012-Q3 2014
Revenue and Operating Margin of Mitsumi Electric, FY2006-FY2015
Revenue of Mitsumi Electric by Product, FY2006-FY2014
Backlog of Mitsumi Electric by Product, Q3 2014
Revenue and Operating Margin of Truly International, 2005-2014
Quarterly Revenue and Gross Margin of Truly International, Q1 2013-Q4 2014
Revenue of LCD Business of Truly International by Technology, 2006-2011
Revenue of Truly Semiconductors by Business, 2012-2015
Shipment Breakdown of Truly Semiconductors by Product, 2012-2015
ASP of Truly Semiconductors by Product, 2012-2015
Main Customers of Truly’s Mobile Phone LCD
Main Customers of Truly’s Auto Display
Touch Screen Capacity of Truly
CCM Capacity of Truly
Customers of Truly’s CCM
Capacity of Truly Automotive Display
BYD’s Camera Module Products
LiteOn Group
Quarterly Revenue of LiteOn by Busines, Q1 2013-Q3 2014
LiteOn’s Guangzhou Science and Technology Park
LiteOn’s CCM Shipment, 2003-2013
LiteOn’s CCM Capacity Expansion Plan, Q3 2011-Q4 2013
LiteOn’s AF /FF CCM Proportion
LiteOn’s AF CCM
LiteOn’s CCM Technology Roadmap
LiteOn’s OIS Concept
LiteOn’s Revenue and Operating Margin, 2005-2015
Primax’s KEY Milestone
Primax’s Revenue and Operating Margin, 2008-2015
Primax’s Revenue by Division, 2007-2012
Primax’s Monthly Revenue, Nov. 2012-Nov. 2014
Primax's Global Distribution
Primax's Product Range
Profile of PRIMAX’s Plant
Revenue and Operating Income of SEMCO, 2011-2015
SEMCO’s Revenue by Division, 2010-2015
SEMCO’s Operating Income by Division, 2010-2015
SEMCO’s CCM Operating Margin, Q1 2011-Q4 2014
SEMCO’s Camera Module Revenue by Pixel, 2010-2014
SEMCO’s Camera Module Supply Ratio for Samsung, 2013-2015
SEMCO’s Camera Module ASP, Q1 2010-Q4 2013
Patron Organization
PARTRON's Revenue and Operating Margin, 2007-2015
Quarterly Revenue of PARTRON by Product, Q1 2012-Q4 2014
PARTRON's CCM Shipment by Pixel, 2013-2015
Revenue and Gross Margin of Sunny Optical, 2004-2015
Financial Summary of Sunny, 2009-2013
Sunny's Major Clients
Sunny's Shipment by Product, Jan.-Nov.2014
Sunny's Revenue by Division, 2010-2014
Downstream Distribution of Sunny's Revenue, 2010-2014
Sunny Optical’s Camera Module Shipment Breakdown by Pixel, 2012-2014
Sunny's Gross Margin by Division, 2010-2014
Sunny's Gross Margin by Product, 2012-2016
Handset Lens Shipment of Sunny Optical, 2012-2016
Automotive Lens Revenue of Sunny Optical, 2012-2016
Sunny's Factory Distribution
Organizational Structure of CAMMSYS
Revenue and Operating Margin of CAMMSYS, 2009-2015
Raw Materials Price of CAMMSYS, 2011-2014
Revenue and Operating Income of POWERLOGIC, 2009-2015
ASP of Powerlogic CCM, 2012-2014
ASP of Powerlogic CCM Component, 2012-2014
Capacity of Powerlogic CCM, 2012-2014
Output of Powerlogic CCM, 2012-2014
MCNEX Organization
MCNEX’s Revenue and Operating Income, 2009-2015
MCNEX’s Revenue by Client, 2013
MCNEX’s Revenue by Application, 2010-2014
MCNEX’s Revenue by Pixel, 2009-2011
MCNEX’s Capacity by Region
Revenue and Number of Employees of Dongguan COWELL, 2005-2014
Revenue and Operating Margin of O-film, 2007-2015
Revenue of O-film by Product, 2009-2015
Quarterly Revenue of O-film, Q1 2009-Q3 2014
Quarterly Gross Margin of O-film, Q1 2009-Q3 2014
Client Structure of O-film, 2012-2014
Revenue and Gross Margin of Q-TECH, 2011-2014
Financial Statement of Q-TECH, 2011-2014
Cash Flow of Q-TECH, 2011-2014
Revenue of Q-TECH by Pixel, 2011-2014
Shipment of Q-TECH, 2011-2014
Revenue of Q-TECH by Pixel, 2011-2014
Shipment of Q-TECH by Pixel, 2011-2014
ASP of Q-TECH’s Products, 2011-2014
Gross Margin of Q-TECH’s Products, 2011-2014
Clients Distribution of Q-TECH, 2014
Revenue and Operating Income of GAI, 2009-2014
Revenue and Gross Profit of GAI, 2009-2014
Sharp’s Revenue and Operating Margin, FY2008-FY2015
Sharp’s Revenue by Business, FY2013-FY2015
Sharp’s Operating Margin by Business, FY2013-FY2015
OIS Roadmap of Sharp
Organization Structure of STMicro
Operating Margin of STMicro, Q24 2012-Q3 2014
Revenue of STMicro by Division, Q3 2014
HYSONIC’s Structure
HYSONIC’s Revenue and Operating Income, 2006-2014
Personnel Organization of Hysonic, as of Mar. 2014
Major Products of HYSONIC
HYSONIC’s Revenue by End Client, 2012-2013
HYSONIC’s Revenue by Client, 2012-2013
JAHWA’s Revenue and Operating Margin, 2005-2015
Quarterly Revenue of JAHWA by Product, Q1 2013- Q3 2015
JAHWA’s Overseas Subsidiaries
如果这份报告不能满足您的要求,我们还可以为您定制报告,请 留言说明您的详细需求。
|