|
|
|
报告导航:研究报告—
制造业—材料
|
|
2014-2017年全球及中国碳纤维行业研究报告 |
 |
字数:4.5万 |
页数:117 |
图表数:121 |
|
中文电子版:8000元 |
中文纸版:4000元 |
中文(电子+纸)版:8500元 |
|
英文电子版:2350美元 |
英文纸版:2500美元 |
英文(电子+纸)版:2650美元 |
|
编号:HK054
|
发布日期:2015-01 |
附件:下载 |
 |
|
|
碳纤维是新一代增强纤维,主要应用于航空航天、工业、体育休闲等领域,2014年全球汽车、风电、天然气等工业应用对碳纤维的需求量最大,达64%左右。
2014年,全球碳纤维总产能约为13万吨,主要集中于日本、美国和欧洲企业。全球排名前五的企业分别为日本东丽、日本帝人、日本三菱丽阳、德国西格里和台湾台塑,其碳纤维产能之和约占全球总产能的60%。
由于碳纤维性能优异,其市场需求一直较为强劲,2014年全球碳纤维需求量达7万吨以上。其中汽车轻量化对碳纤维的需求增长较快,多家企业涉足该领域。如西格里和宝马合作在宝马i3电动和i8混合动力的车身架构中使用碳纤维材料;丰田将采用东丽碳纤维用于Mirai燃料电池车等。
2014年,中国碳纤维产业已经初具规模,T300级碳纤维已经部分替代了进口, T700、T800关键技术也实现了突破。但是国内碳纤维生产企业总体技术水平偏低、生产成本高,而近3年国际碳纤维价格不断下滑,导致中国碳纤维生产企业普遍经营困难,装置开工率极低。2014年,中国碳纤维产量仅3000吨左右,自给率不足20%。
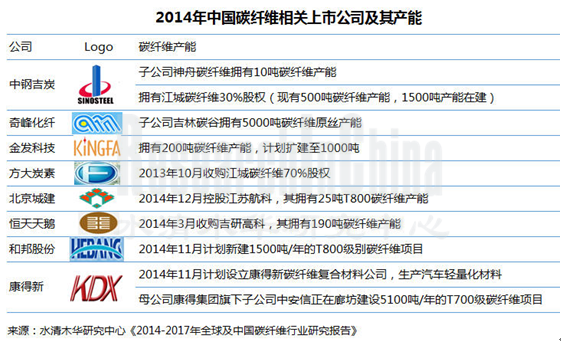
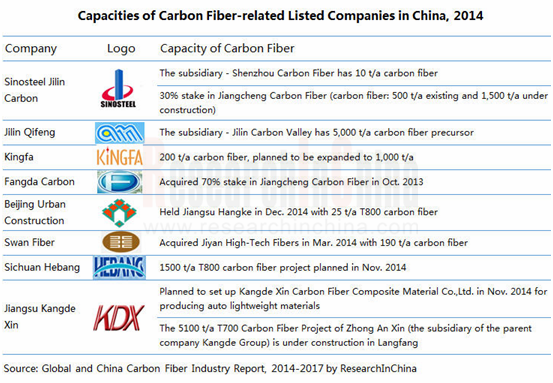
2014年,中国碳纤维生产企业有30余家,但是产量达千吨以上的仅有江苏恒神和中复神鹰两家,部分企业碳纤维装置一直处于停产状态。目前,中国拟/在建碳纤维产能达3万吨以上,但是由于国外产品竞争致使中国碳纤维企业盈利压力增加,部分项目将被搁置或取消。
虽然中国碳纤维产量增长缓慢,但是需求增长却较为迅速,预计2015-2017年,中国碳纤维需求量将保持20%以上的增长速度。而国家政策对碳纤维产业的扶持以及其巨大的市场潜力,促使多家上市公司开始涉足碳纤维领域,如金发科技、方大炭素、北京城建、和邦股份、康得新等。
水清木华研究中心《2014-2017年全球及中国碳纤维行业研究报告》主要包括以下几个内容:
  全球碳纤维行业供需分析、竞争格局、价格分析、发展预测等; 全球碳纤维行业供需分析、竞争格局、价格分析、发展预测等;
中国碳纤维行业供需分析、进出口分析、竞争格局、价格分析、发展预测等;
海外9家碳纤维生产企业经营状况、碳纤维业务分析等;
中国大陆8家碳纤维生产企业经营状况、碳纤维业务分析、发展预测以及28家碳纤维生产商发展动态等;
Carbon fiber is the new-generation reinforced fiber, mainly used in the fields of aerospace, industry, sports and leisure. In 2014, the global industrial applications like natural gas, wind power and automobiles showed the largest demand for carbon fiber, 64% or so.
In 2014, the global carbon fiber capacity totaled approximately 130,000 tons, mainly contributed by Japan, Europe and the U.S.. The world's top five companies -- Toray, Teijin, Mitsubishi Rayon, Germany SGL and Formosa Plastics shared 60% of the global carbon fiber capacity together.
Due to excellent performance, the market demand for carbon fiber has been strong. The global carbon fiber demand amounted to 70,000 tons or more in 2014. Specifically, the demand from automotive lightweight grows faster, which attracts many companies to get involved in this field. SGL and BMW cooperate to make use of carbon fiber materials in the body structure of BMW i3 and i8. Toyota will use Toray’s carbon fiber for Mirai fuel cell vehicles.
In 2014, China carbon fiber industry took shape, the T300 carbon fiber made in China partially replaced the imported one, and T700 and T800 technologies made breakthroughs. However, the Chinese producers hold backward technologies and pay high production costs; coupled with the declining international carbon fiber price in recent three years, Chinese carbon fiber enterprises are confronted with operating difficulties with a low operating rate. In 2014, China's output of carbon fiber only reached about 3,000 tons, and the self-sufficiency rate was less than 20%.
In 2014, there were more than 30 Chinese carbon fiber manufacturers, but only Jiangsu Hengshen Fiber Material and Zhongfu Shenying Carbon Fiber achieved the respective output of above 1,000 tons, while the carbon fiber devices of some enterprises were in a shutdown state. At present, China’s planned / ongoing carbon fiber capacity hits 30,000 tons or more, but Chinese carbon fiber companies will delay or cancel some projects under greater pressure incurred by foreign competitors.
Despite China's low output growth rate, the demand for carbon fiber grows quickly and may ascend at the expected growth rate of more than 20% during 2015-2017. The favorable national policies and huge market potentials have prompted a number of listed companies to step in the field of carbon fiber, such as Kingfa, Fangda Carbon, Beijing Urban Construction, Hebang, Kangdexin and so forth.
The report mainly covers the followings:
 Supply and demand, competition pattern, price analysis and development trend of the global carbon fiber industry; Supply and demand, competition pattern, price analysis and development trend of the global carbon fiber industry;
Supply and demand, competition pattern, import and export, price analysis and development trend of Chinese carbon fiber industry;
Operation and carbon fiber business of nine overseas carbon fiber manufacturers;
Operation, carbon fiber business and development trend of eight carbon fiber manufacturers as well as the developments of 28 carbon fiber producers in Mainland China.
第一章 碳纤维概述
1.1 定义及性质
1.2 工艺流程
1.3 分类
1.4 应用
第二章 全球碳纤维市场
2.1 发展现状
2.2 供需分析
2.2.1 供给
2.2.2 需求
2.3 竞争格局
2.4 价格分析
第三章 中国碳纤维市场
3.1 发展现状
3.2 供需分析
3.2.1 供给
3.2.2 需求
3.3 进出口分析
3.3.1 碳纤维
3.3.2 其他碳纤维制品
3.4 价格分析
第四章 海外重点企业
4.1 日本东丽
4.1.1 公司简介
4.1.2 经营情况
4.1.3 碳纤维部门经营情况
4.1.4 碳纤维业务
4.1.5 在华业务
4.2 美国卓尔泰克
4.2.1 公司简介
4.2.2 经营状况
4.2.3 碳纤维业务
4.2.4 碳纤维业务发展情况
4.3 日本帝人
4.3.1 公司简介
4.3.2 经营情况
4.3.3 碳纤维业务
4.3.4 在华业务
4.4 三菱化学控股集团
4.4.1 公司简介
4.4.2 经营情况
4.4.3 碳纤维业务
4.5 日本吴羽
4.5.1 公司简介
4.5.2 经营情况
4.5.3 先进材料部门经营情况
4.5.4 碳纤维业务
4.6 美国赫克塞尔
4.6.1 公司简介
4.6.2 经营情况
4.6.3 营收构成
4.6.4 碳纤维业务
4.7 美国氰特
4.7.1 公司简介
4.7.2 经营状况
4.7.3 工程材料部门经营情况
4.7.4 碳纤维业务
4.8 德国西格里
4.8.1 公司简介
4.8.2 经营状况
4.8.3 碳纤维及复合材料部门经营情况
4.8.4 碳纤维业务
4.9 台塑
4.9.1 公司简介
4.9.2 经营情况
4.9.3 碳纤维业务经营情况
4.9.4 碳纤维产销量
第五章 中国大陆碳纤维生产企业
5.1 中钢吉炭
5.1.1 公司简介
5.1.2 经营状况
5.1.3 营收构成
5.1.4 毛利率
5.1.5 客户
5.1.6 碳纤维业务
5.1.7 预测与展望
5.2 奇峰化纤
5.2.1 公司简介
5.2.2 经营状况
5.2.3 营收构成
5.2.4 毛利率
5.2.5 产销量
5.2.6 销售价格
5.2.7 碳纤维业务
5.2.8 预测与展望
5.3 金发科技
5.3.1 公司简介
5.3.2 经营状况
5.3.3 碳纤维业务
5.4 方大炭素
5.4.1 公司简介
5.4.2 经营状况
5.4.3 碳纤维业务
5.5 北京城建
5.5.1 公司简介
5.5.2 经营状况
5.5.3 碳纤维业务
5.6 恒天天鹅
5.5.1 公司简介
5.5.2 经营状况
5.5.3 碳纤维业务
5.7 大元股份
5.7.1 公司简介
5.7.2 经营状况
5.7.3 营收构成
5.7.4 毛利率
5.7.5 客户
5.7.6 碳纤维业务
5.7.7 预测与展望
5.8 江苏天鸟
5.8.1 公司简介
5.8.2 经营状况
5.8.3 营收构成
5.8.4 毛利率
5.8.5 碳纤维业务
5.9 其他企业
5.9.1 中复神鹰
5.9.2 山西恒天
5.9.3 威海拓展
5.9.4 吉林石化
5.9.5 鞍山塞诺达
5.9.6 江苏恒神
5.9.7 安徽鑫丰
5.9.8 天顺化工
5.9.9 邯郸硅谷
5.9.10 河南永煤
5.9.11 沈阳中恒
5.9.12 四川新万兴
5.9.13 西安康本
5.9.14 浙江巨鑫
5.9.15 安徽首文
5.9.16 甘肃郝氏
5.9.17 中简科技
5.9.18 大连兴科
5.10 拟在建项目情况
5.10.1 上海石化
5.10.2 鄂尔多斯亚欣
5.10.3 山西宏特
5.10.4 山东新天
5.10.5 新疆创越
5.10.6 大连国瑞
5.10.7 太钢集团
5.10.8 蓝星威邦
5.10.9 和邦股份
5.10.10 康得新
第六章 总结与预测
6.1 总结
6.2 供需预测
6.2.1 全球市场
6.2.2 中国市场
1 Overview of Carbon Fiber
1.1 Definition and Properties
1.2 Technological Process
1.3 Classification
1.4 Application
2 Global Carbon Fiber Market
2.1 Status Quo
2.2 Supply and Demand
2.2.1 Supply
2.2.2 Demand
2.3 Competition Pattern
2.4 Price
3 Chinese Carbon Fiber Market
3.1 Status Quo
3.2 Supply and Demand
3.2.1 Supply
3.2.2 Demand
3.3 Import and Export
3.3.1 Carbon Fiber
3.3.2 Other Carbon Fiber Products
3.4 Price
4 Key Overseas Companies
4.1 Toray
4.1.1 Profile
4.1.2 Operation
4.1.3 Operation of Carbon Fiber Division
4.1.4 Carbon Fiber Business
4.1.5 Business in China
4.2 Zoltek
4.2.1 Profile
4.2.2 Operation
4.2.3 Carbon Fiber Business
4.2.4 Development of Carbon Fiber Business
4.3 Teijin
4.3.1 Profile
4.3.2 Operation
4.3.3 Carbon Fiber Business
4.3.4 Business in China
4.4 Mitsubishi Chemical Corporation
4.4.1 Profile
4.4.2 Operation
4.4.3 Carbon Fiber Business
4.5 Kureha
4.5.1 Profile
4.5.2 Operation
4.5.3 Operation of Advanced Materials Division
4.5.4 Carbon Fiber Business
4.6 Hexcel
4.6.1 Profile
4.6.2 Operation
4.6.3 Revenue Structure
4.6.4 Carbon Fiber Business
4.7 CYTEC
4.7.1 Profile
4.7.2 Operation
4.7.3 Operation of Engineering Materials Division
4.7.4 Carbon Fiber Business
4.8 SGL
4.8.1 Profile
4.8.2 Operation
4.8.3 Operation of Carbon Fiber and Composite Materials Division
4.8.4 Carbon Fiber Business
4.9 Formosa Plastics
4.9.1 Profile
4.9.2 Operation
4.9.3 Carbon Fiber Business Operation
4.9.4 Carbon Fiber Output and Sales Volume
5 Key Enterprises in Mainland China
5.1 Sinosteel Jilin Carbon Co., Ltd.
5.1.1 Profile
5.1.2 Operation
5.1.3 Revenue Structure
5.1.4 Gross Margin
5.1.5 Customers
5.1.6 Carbon Fiber Business
5.1.7 Forecast and Prospect
5.2 Jilin Qifeng Chemical Fiber Co., Ltd.
5.2.1 Profile
5.2.2 Operation
5.2.3 Revenue Structure
5.2.4 Gross Margin
5.2.5 Output and Sales Volume
5.2.6 Selling Price
5.2.7 Carbon Fiber Business
5.2.8 Forecast and Prospect
5.3 Kingfa
5.3.1 Profile
5.3.2 Operation
5.3.3 Carbon Fiber Business
5.4 Fangda Carbon
5.4.1 Profile
5.4.2 Operation
5.4.3 Carbon Fiber Business
5.5 Beijing Urban Construction
5.5.1 Profile
5.5.2 Operation
5.5.3 Carbon Fiber Business
5.6 Swan Fiber
5.5.1 Profile
5.5.2 Operation
5.5.3 Carbon Fiber Business
5.7 Ningxia Dayuan Chemical Co., Ltd.
5.7.1 Profile
5.7.2 Operation
5.7.3 Revenue Structure
5.7.4 Gross Margin
5.7.5 Customers
5.7.6 Carbon Fiber Business
5.7.7 Forecast and Prospect
5.8 Jiangsu Tianniao
5.8.1 Profile
5.8.2 Operation
5.8.3 Revenue Structure
5.8.4 Gross Margin
5.8.5 Carbon Fiber Business
5.9 Other Manufacturers
5.9.1 Zhongfu Shenying Carbon Fiber
5.9.2 Shanxi Hengtian
5.9.3 Weihai Tuozhan
5.9.4 PetroChina Jilin Petrochemical
5.9.5 Anshan Sinocarb
5.9.6 Jiangsu Hengshen Fiber Material
5.9.7 Anhui Xinfeng
5.9.8 Tianshun Chemical
5.9.9 Handan Silicon Valley (HSVC)
5.9.10 HNEC Yongmei Carbon Fiber
5.9.11 Shenyang Zhongheng New Materials
5.9.12 Sichuan Xinwanxing Carbon Fiber Composites
5.9.13 Xi'an Carbon Materials
5.9.14 Zhejiang Juxin Carbon Fiber
5.9.15 Anhui Shouwen
5.9.16 Gansu Haoshi
5.9.17 Sinofibers Technology
5.9.18 Dalian Xingke
5.10 Proposed and Ongoing Projects
5.10.1 Shanghai Petrochemical
5.10.2 Ordos Yaxin Carbon Fiber
5.10.3 Shanxi Hongte
5.10.4 Shandong Xintian
5.10.5 Xinjiang Chuangyue
5.10.6 Dalian Guorui
5.10.7 Taiyuan Iron & Steel Group
5.10.8 Bluestar Weibang
5.10.9 Hebang
5.10.10 Kangdexin
6 Summary and Forecast
6.1 Summary
6.2 Forecast for Supply and Demand
6.2.1 Global Market
6.2.2 Chinese Market
图:PAN基碳纤维生产工艺流程
表:碳纤维产品按每束碳丝根数分类
表:碳纤维按力学性能分类
表:碳纤维及其复合材料种类和主要应用
表:碳纤维复合材料深加工产品的具体应用
表:2009-2014年全球碳纤维产能及增长率
图:2009-2014年全球碳纤维需求量及增长率
图:2014年全球碳纤维三大应用领域占比
图:2014年全球碳纤维厂商产能占比(按碳纤维丝束产能计)
图:2007-2014年台塑公司碳纤维平均销售价格
表:2014年中国主要碳纤维生产企业及其产能
表:2015年中国碳纤维拟/在建项目情况
图:2009-2014年中国碳纤维需求量及同比增长
图:2014年中国碳纤维消费结构
图:2010-2014年中国碳纤维进出口量
图:2010-2014年中国碳纤维进出口平均价格
图:2014年1-11月中国碳纤维进口来源分布(按进口量)
图:2014年1-11月中国碳纤维出口目的地分布(按出口量)
图:2010-2014年中国其他碳纤维制品进出口量
图:2010-2014年中国其他碳纤维制品进出口平均价格
图:2014年1-11月中国其他碳纤维制品进口来源分布(按进口量)
图:2014年1-11月中国其他碳纤维制品出口目的地分布(按出口量)
表:2011-2013年中国碳纤维价格
图:FY2010-FY2014日本东丽净销售额和净利润
图:FY2014H1日本东丽(分部门)销售收入占比
图:FY2010-FY2014日本东丽碳纤维部门净销售额与营业利润
表:FY2012-FY2014东丽碳纤维部门(按应用领域)销售收入
图:FY2012-FY2014东丽碳纤维部门(按应用领域)销售收入占比
表:2015年东丽碳纤维拟在建项目情况
图:FY2008-FY2013美国Zoltek净销售额与营业利润
图:FY2010-FY2013美国Zoltek(分产品)销售收入占比
图:FY2010-FY2012美国Zoltek(分地区)销售收入占比
图:FY2008-FY2013美国Zoltek碳纤维销售收入与营业利润
图:FY2008-FY2013美国Zoltek碳纤维预氧丝和特殊碳纤维销售收入与营业利润
图:FY2010-FY2014帝人净销售额和净利润
图:FY2014H1帝人(分部门)销售收入占比
图:FY2011-FY2014日本Teijin先进纤维及其复合材料部门销售收入和营业利润
表:帝人集团下属碳纤维公司
表:日本东邦碳纤维主要应用领域
图:FY2010-FY2014三菱化学控股净销售额与净利润
表:FY2014H1三菱化学运营领域及主营业务销售收入占比
表:三菱丽阳基本信息
表:三菱丽阳下属碳纤维公司一览表
表:三菱丽阳碳纤维主要应用领域
表:三菱丽阳碳纤维业务发展情况
图:FY2010-FY2014日本吴羽净销售额和净利润
图:FY2012-FY2014日本Kureha(分业务)销售收入占比
图:FY2010-FY2014日本Kureha先进材料部门销售收入及营业利润
图:FY2011-FY2013日本Kureha先进材料部门主要产品销售收入
图:2010-2014年美国Hexcel净销售额与净利润
表:2012-2014年美国Hexcel(按市场)销售收入
图:2012-2014美国Hexcel(按市场)销售收入占比
图:2011-2013年美国Hexcel(分地区)销售收入占比
图:2010-2014年美国Cytec净销售额与净利润
图:2012-2014年美国Cytec(分部门)销售收入占比
图:2011-2013年美国Cytec(分地区)销售收入占比
图:2011-2014年美国Cytec航天材料部门销售收入及营业利润
图:2011-2013年美国Cytec航天材料部门(分地区)销售收入占比
图:2010-2014年德国SGL销售收入与EBITDA
图:2012-2014年德国SGL(分部门)销售收入占比
图:2011-2013年德国SGL(分地区)销售收入占比
图:2013年德国SGL(分市场)销售收入占比
图:2010-2014年德国SGL碳纤维及复合材料部门销售收入及EBITDA
图:2013年德国SGL碳纤维及复合材料部门(分业务)销售收入占比
图:2013年德国SGL碳纤维及复合材料部门(分市场)销售收入占比
表:台塑事业部门及主营业务
图:2010-2014年台塑营业收入及净利润
图:2013年台塑(分部门)营业收入占比
图:2009-2013年台塑碳纤维销售收入及平均价格
图:2011-2013年台塑碳纤维业务(分地区)销售收入占比
图:2009-2013年台塑碳纤维产能、产量及开工率
图:2009-2013年台塑碳纤维销量和产销率
图:2010-2014年中钢吉炭营业收入和净利润
表:2012-2014年中钢吉炭(分产品)营业收入
图:2012-2014年中钢吉炭(分产品)营业收入占比
表:2012-2014年中钢吉炭(分地区)营业收入
图:2012-2014年中钢吉炭(分地区)营业收入占比
表:2012-2014年中钢吉炭主营产品毛利率
图:2012-2014年中钢吉炭前五名客户贡献收入及占比
表:2014H1中钢吉炭前五名客户名称、收入贡献及占比
图:2012-2014年神舟碳纤维营业收入和净利润
图:2012-2014年江城碳纤维营业收入和净利润
图:2010-2014年奇峰化纤营业收入和净利润
表:2011-2013年奇峰化纤(分产品)营业收入
图:2011-2013年奇峰化纤(分产品)营业收入占比
表:2011-2013年奇峰化纤主营产品毛利率
图:2011-2013年奇峰化纤产量、销量及产销率
表:2011-2013年奇峰化纤主营产品销售量
图:2011-2013年奇峰化纤产品平均售价、丙烯腈采购价格及价差
表:2011-2013年奇峰化纤主营产品平均售价
图:2013-2017年奇峰化纤营业收入和净利润预测
图:2010-2014年金发科技营业收入和净利润
图:2013-2014年金发碳纤维营业收入和净利润
图:2010-2014年方大炭素营业收入和净利润
图:2010-2014年北京城建营业收入和净利润
图:2010-2014年北京城建营业收入和净利润
图:2010-2014年大元股份营业收入和净利润
表:2012-2014年大元股份(分产品)营业收入
图:2012-2014年大元股份(分产品)营业收入占比
图:2010-2014年大元股份碳纤维产品毛利率
图:2012-2014年大元股份前五名客户贡献收入及占比
表:2014H1大元股份前五名客户名称、收入贡献及占比
表:2012-2014年嘉兴中宝营业收入和净利润
表:2012-2014年嘉兴中宝主营产品产量
图:2011-2013年江苏天鸟营业收入和净利润
表:2011-2013年江苏天鸟(分产品)营业收入
图:2011-2013年江苏天鸟(分产品)营业收入占比
表:2011-2013年江苏天鸟(分地区)营业收入
表:2011-2013年江苏天鸟(分地区)营业收入
图:2011-2013年江苏天鸟主营产品毛利率
表:2011-2013年江苏天鸟主营产品产能
表:2011-2013年江苏天鸟主营产品产量
表:2011-2013年江苏天鸟主营产品销量
表:2011-2013年江苏天鸟主营产品销售价格
图:山西恒天碳纤维原丝主要下游客户
表:2013年全球及中国主要企业碳纤维经营情况对比
表:2015年全球主要碳纤维拟/在建项目
表:2014与2017年全球碳纤维行业供需分析
表:2011-2014年全球主要碳纤维生产企业在汽车工业中的拓展
表:2014与2017年中国碳纤维行业供需分析
图:2014、2017及2020年中国碳纤维消费结构
PAN-based Carbon Fiber Production Process
Classification of Carbon Fiber Products by Number of Carbon Fibers per Tow
Classification of Carbon Fiber by Mechanical Properties
Classification and Main Application of Carbon Fiber and Its Composites
Specific Applications of Deep-processed Carbon Fiber Composite Products
Global Carbon Fiber Capacity and Growth Rate, 2009-2014
Global Carbon Fiber Demand and Growth Rate, 2009-2014
Global Carbon Fiber Application Structure, 2014
Global Carbon Fiber Capacity Structure by Manufacturer (by Capacity of Carbon Fiber Tow), 2014
Average Selling Price of Carbon Fiber of Formosa Plastics, 2007-2014
Major Carbon Fiber Manufacturers and Their Capacities in China, 2014 Carbon Fiber Projects under Planning/Construction in China, 2015
China's Carbon Fiber Demand and YoY Growth Rate, 2009-2014
China's Carbon Fiber Consumption Structure, 2014
China's Carbon Fiber Import and Export Volume, 2010-2014
Average Prices of China's Carbon Fiber Imports and Exports, 2010-2014
China's Carbon Fiber Import Source Structure (by Import Volume), Jan-Nov 2014
China's Carbon Fiber Export Destination Structure (by Export Volume), Jan-Nov 2014
China's Import and Export Volume of Other Carbon Fiber Products, 2010-2014
Average Import and Export Prices of China's Other Carbon Fiber Products, 2010-2014
Import Source Structure of China's Other Carbon Fiber Products (by Import Volume), Jan-Nov 2014
Export Destination Structure of China's Other Carbon Fiber Products (by Export Volume), Jan-Nov 2014
China’s Carbon Fiber Price, 2011-2013
Toray's Net Sales and Net Income, FY2010-FY2014
Toray's Sales Percentage (by Division), H1 FY2014
Net Sales and Operating Income of Toray's Carbon Fiber Division, FY2010-FY2014
Sales of Toray's Carbon Fiber Division (by Application), FY2012-FY2014
Sales Percentage of Toray's Carbon Fiber Division (by Application), FY2012-FY2014
Toray's Carbon Fiber Projects under Planning/Construction, 2015
Zoltek's Net Sales and Operating Income, FY2008-FY2013
Zoltek's Sales Percentage (by Product), FY2010-FY2013
Zoltek's Sales Percentage (by Region), FY2010-FY2012
Zoltek's Carbon Fiber Sales and Operating Income, FY2008-FY2013
Sales and Operating Income of Zoltek's Preoxidized Fiber and Special Carbon Fiber, FY2008-FY2013
Teijin's Net Sales and Net Income, FY2010-FY2014
Teijin's Sales Percentage (by Division), H1 FY2014
Sales and Operating Income of Teijin's Advanced Fiber and Composite Materials Division, FY2011-FY2014
Teijin's Carbon Fiber Subsidiaries
Toho's Main Carbon Fiber Applications
Net Sales and Net Income of Mitsubishi Chemical, FY2010-FY2014
Business Scope and Sales Percentage of Mitsubishi Chemical, H1 FY2014
Profile of Mitsubishi Rayon
Carbon Fiber Subsidiaries of Mitsubishi Rayon
Main Carbon Fiber Applications of Mitsubishi Rayon
Development of Carbon Fiber Business of Mitsubishi Rayon
Kureha's Net Sales and Net Income, FY2010-FY2014
Kureha's Sales Percentage (by Business), FY2012-FY2014
Sales and Operating Income of Kureha's Advanced Materials Division, FY2010-FY2014
Sales of Main Products of Kureha's Advanced Materials Division, FY2011-FY2013
Hexcel's Net Sales and Net Income, 2010-2014
Hexcel's Sales (by Market), 2012-2014
Hexcel's Sales Percentage (by Market), 2012-2014
Hexcel's Sales Percentage (by Region), 2011-2013
Cytec's Net Sales and Net Income, 2010-2014
Cytec's Sales Percentage (by Division), 2012-2014
Cytec's Sales Percentage (by Region), 2011-2013
Sales and Operating Income of Cytec's Aerospace Materials Division, 2011-2014
Sales Percentage of Cytec's Aerospace Materials Division (by Region), 2011-2013
SGL's Sales and EBITDA, 2010-2014
SGL's Sales Percentage (by Division), 2012-2014
SGL's Sales Percentage (by Region), 2011-2013
SGL's Sales Percentage (by Market), 2013
Sales and EBITDA of SGL's Carbon Fiber and Composite Materials Division, 2010-2014
Sales Percentage of SGL's Carbon Fiber and Composite Materials Division (by Business), 2013
Sales Percentage of SGL's Carbon Fiber and Composite Materials Division (by Market), 2013
Divisions of Formosa Plastics and Their Main Business
Revenue and Net Income of Formosa Plastics, 2010-2014
Revenue Structure of Formosa Plastics (by Division), 2013
Carbon Fiber Revenue and Average Price of Formosa Plastics, 2009-2013
Carbon Fiber Revenue Structure of Formosa Plastics (by Region), 2011-2013
Carbon Fiber Capacity, Output and Operating Rate of Formosa Plastics, 2009-2013
Carbon Fiber Sales Volume and Sales/Output Ratio of Formosa Plastics, 2009-2013
Revenue and Net Income of Sinosteel Jilin Carbon, 2010-2014
Revenue Breakdown of Sinosteel Jilin Carbon (by Product), 2012-2014
Revenue Structure of Sinosteel Jilin Carbon (by Product), 2012-2014
Revenue Breakdown of Sinosteel Jilin Carbon (by Region), 2012-2014
Revenue Structure of Sinosteel Jilin Carbon (by Region), 2012-2014
Gross Margin of Main Products of Sinosteel Jilin Carbon, 2012-2014
Revenue of Sinosteel Jilin Carbon from Top 5 Clients and % of Total Revenue, 2012-2014
Name List and Revenue Contribution of Top 5 Clients of Sinosteel Jilin Carbon, H1 2014
Revenue and Net Income of Shenzhou Carbon Fiber, 2012-2014
Revenue and Net Income of Jiangcheng Carbon Fiber, 2012-2014
Revenue and Net Income of Jilin Qifeng Chemical Fiber, 2010-2014
Revenue Breakdown of Jilin Qifeng Chemical Fiber (by Product), 2011-2013
Revenue Structure of Jilin Qifeng Chemical Fiber (by Product), 2011-2013
Gross Margin of Main Products of Jilin Qifeng Chemical Fiber, 2011-2013
Output, Sales Volume and Sales/Output Ratio of Jilin Qifeng Chemical Fiber, 2011-2013
Sales Volume of Main Products of Jilin Qifeng Chemical Fiber, 2011-2013
Product Average Selling Prices, Acrylonitrile Purchase Price and Price Difference of Jilin Qifeng Chemical Fiber, 2011-2013
Average Selling Price of Main Products of Jilin Qifeng Chemical Fiber, 2011-2013
Revenue and Net Income of Jilin Qifeng Chemical Fiber, 2013-2017E
Kingfa’s Revenue and Net Income, 2010-2014
Kingfa’s Carbon Fiber Revenue and Net Income, 2013-2014
Revenue and Net Income of Fangda Carbon, 2010-2014
Revenue and Net Income of Beijing Urban Construction, 2010-2014
Revenue and Net Income of Ningxia Dayuan Chemical, 2010-2014
Revenue Breakdown of Ningxia Dayuan Chemical (by Product), 2012-2014
Revenue Structure of Ningxia Dayuan Chemical (by Product), 2012-2014
Gross Margin of Carbon Fiber Products of Ningxia Dayuan Chemical, 2010-2014
Revenue of Ningxia Dayuan Chemical from Top 5 Clients and % of Total Revenue, 2012-2014
Name List and Revenue Contribution of Top 5 Clients of Ningxia Dayuan Chemical, H1 2014
Revenue and Net Income of Jiaxing Sino-Dia Carbon Fiber, 2012-2014
Output of Main Products of Jiaxing Sino-Dia Carbon Fiber, 2012-2014
Revenue and Net Income of Jiangsu Tianniao, 2011-2013
Revenue Breakdown of Jiangsu Tianniao (by Product), 2011-2013
Revenue Structure of Jiangsu Tianniao (by Product), 2011-2013
Revenue Breakdown of Jiangsu Tianniao (by Region), 2011-2013
Gross Margin of Main Products of Jiangsu Tianniao, 2011-2013
Capacity of Main Products of Jiangsu Tianniao, 2011-2013
Output of Main Products of Jiangsu Tianniao, 2011-2013
Sales Volume of Main Products of Jiangsu Tianniao, 2011-2013
Selling Price of Main Products of Jiangsu Tianniao, 2011-2013
Major Carbon Fiber Precursor Clients of Shanxi Hengtian New Textile Fiber Tech
Carbon Fiber Operation Comparison between Global and Chinese Major Companies, 2013
Major Global Carbon Fiber Projects under Planning/Construction, 2015
Supply and Demand of Global Carbon Fiber Industry, 2014 vs 2017E
Development of Major Global Carbon Fiber Manufacturers in the Automotive Industry, 2011-2014
Supply and Demand of China Carbon Fiber Industry, 2014 vs 2017E
China's Carbon Fiber Consumption Structure, 2014, 2017E vs 2020E
如果这份报告不能满足您的要求,我们还可以为您定制报告,请 留言说明您的详细需求。
|