|
|
|
报告导航:研究报告—
制造业—材料
|
|
2014-2017年中国火电脱硝行业研究报告 |
 |
字数:2.9万 |
页数:103 |
图表数:94 |
|
中文电子版:7500元 |
中文纸版:3750元 |
中文(电子+纸)版:8000元 |
|
英文电子版:2250美元 |
英文纸版:2400美元 |
英文(电子+纸)版:2550美元 |
|
编号:ZL020
|
发布日期:2015-01 |
附件:下载 |
 |
|
|
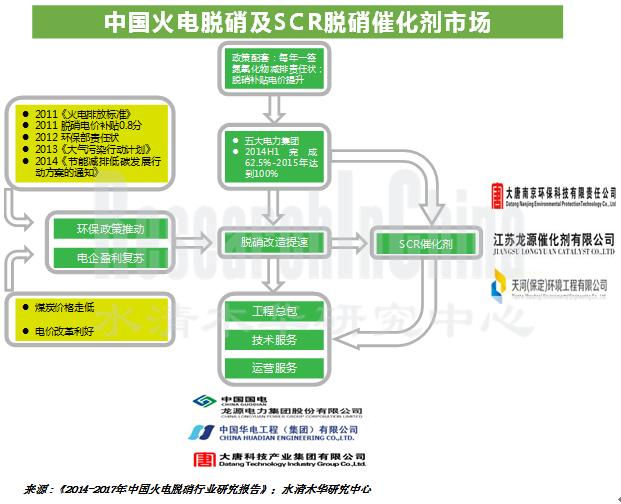
随着中国经济的快速发展和工业化水平的提高,大气污染状况日益严重,环境治理措施愈来愈严厉。中国已是世界上最大的氮氧化物排放国,烟气脱硝已成为继脱硫后中国一项重要的环保任务。2013年氮氧化物排放量为2227.4万吨,同比减少4.7%。氮氧化物排放量的减少主要得益于火电厂脱硝政策的实施。
截至2014年6月,中国发电装机总容量达到13亿千瓦,其中火力发电装机容量8.8亿千瓦,占比67.7%,占比进一步下降。火力发电年消耗燃煤约17亿吨,2013年氮氧化物排放880万吨,占氮氧化物总排放量的39.5%。鉴于此,政府已出台强制措施要求现有及在建火电厂必须安装脱硝装备,2012-2015年为中国脱硝工程建设高峰时期。2014年上半年,新增火电脱硝机组1.2亿千瓦,脱硝装机容量累计达5.5亿千瓦,占火电总装机容量62.5%,市场仍有较大的发展空间。
在脱硝工程建设方面,2013年,国电龙源累计投运装机容量规模最大,所占份额达21%,其次是华电工程和大唐科技,所占份额分别为8%和7%。该类企业主要为隶属于发电集团的环保公司。在SCR脱硝催化剂方面,因其占到整个脱硝改造成本的40%,且未来更新需求较大,故仍有大量企业积极新建或扩大产能。
2014年,中国SCR脱硝催化剂产能已超过40万立方米,其中天河环保和大唐南京环保为国内最大SCR脱硝催化剂供应商,产能分别达到50000立方米/年和40000立方米/年。其他诸如江苏龙源、江苏万德等产能均在20000立方米/年左右。
水清木华研究中心《2014-2017年中国火电脱硝行业研究报告》主要包括以下内容:
 中国火电脱硝行业的发展现状、竞争格局、供需情况、发展预测等; 中国火电脱硝行业的发展现状、竞争格局、供需情况、发展预测等;
中国SCR脱硝催化剂的技术特征、发展趋势及竞争格局等;
中国20家重点火电脱硝领域企业(中电远达、华光股份、国电清新、东方凯特瑞等)的经营现状、脱硝业务分析及前景预测等。
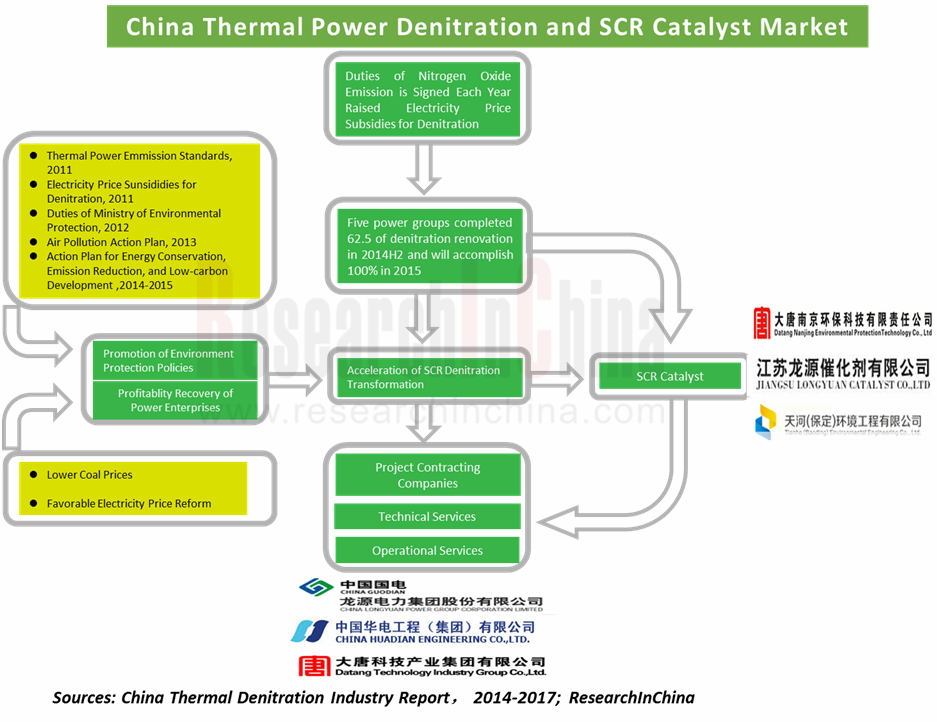
With rapid economic development and enhanced industrialization in China, the air pollution is worsening, while environmental control measures become increasingly stringent. China has already turned to be the world's largest NOx emitter, and flue gas denitrification has become an important task following desulfurization. In 2013, the NOx emission went down 4.7% year on year to 22.274 million tons, thanks to denitration policies implemented by thermal power plants.
As of June 2014, China's installed generating capacity totaled 1.3 billion kilowatts, of which thermal power installed capacity reached 880 million kilowatts with a share of 67.7% which was lower than before. Thermal power consumes about 1.7 billion tons of coal each year, and discharged 8.8 million tons of NOx (accounting for 39.5% of the total NOx emission) in 2013. In view of this, the government has introduced compulsory measures to require all the existing thermal power plants and the ones under construction to install denitration equipment. Therefore, China’s denitration construction will reach a peak during 2012-2015. In H1 2014, the new thermal power denitration units had 120 million kilowatts, and the installed denitration capacity amounted to 550 million kilowatts, equivalent to 62.5% of the total installed capacity of thermal power, showing huge potentials.
As for the denitration project construction, GuodianLongyuan ranked first in the cumulative installed capacity which was put into operation in 2013, enjoying the largest share 21% and followed by China Huadian Engineering with 8% and Datang Technology with 7%. These enterprises are environmental protection companies subject to power generation groups. Given SCR denitration catalysts occupy 40% of the total denitration renovation costs and the future demand is great, a large number of enterprises are actively creating or expanding capacity herein.
In 2014, China’s SCR denitration catalyst capacity exceeded 400,000 m3, of which 50,000 m3 / a and 40,000 m3 / a came from China’s largest SCR denitration catalyst suppliers -- Tianhe Environmental Engineering and Datang Nanjing Environmental Protection respectively. Jiangsu Longyuan, Jiangsu Wonder and other companies had the respective capacity of about 20,000 m3 / a.
The report includes the following aspects:
 Status quo, competition pattern, supply & demand and development trends of China thermal power denitration industry,; Status quo, competition pattern, supply & demand and development trends of China thermal power denitration industry,;
Technical characteristics, competition pattern and development trends of China SCR denitration catalyst;
Status quo, denitration business and prospects of 20 major Chinese thermal power denitration enterprises (CPI Yuanda, Wuxi Huaguang Boiler, Beijing SPC Environment Protection Tech, DKC, etc.).
第一章 火电脱硝概述
1.1 脱硝背景
1.2 脱硝催化剂
1.2.1 SCR脱硝催化剂
1.2.2 脱硝原理
1.2.3 SCR脱硝工艺流程
1.2.4 产业链
1.2.5 行业进入壁垒
第二章 中国火电脱硝发展现状
2.1 发展环境
2.1.1 政策环境
2.1.2 产业环境
2.1.3 技术环境
2.2 火电脱硝
2.2.1 氮氧化物(NOx)排放量
2.2.2 火电脱硝技术
2.2.3 火电脱硝装机容量
2.3 脱硝催化剂需求
2.4 脱硝催化剂供给
第三章 中国脱硝市场竞争格局
3.1 中国脱硝市场竞争格局
3.2 SCR催化剂竞争格局
第四章 中国脱硝行业重点企业
4.1 中电远达
4.1.1 公司介绍
4.1.2 经营情况
4.1.3 营收构成
4.1.4 毛利率
4.1.5 脱硝业务
4.1.6 前景及预测
4.2 华光股份
4.2.1 公司介绍
4.2.2 经营情况
4.2.3 营收构成
4.2.4 毛利率
4.2.5 脱硝业务
4.2.6 前景及预测
4.3 龙净环保
4.3.1 公司介绍
4.3.2 经营情况
4.3.3 营收构成
4.3.4 毛利率
4.3.5 脱硝业务
4.3.6 前景及预测
4.4 菲达环保
4.4.1 公司简介
4.4.2 经营情况
4.4.3 营收构成
4.4.4 毛利率
4.4.5 脱硝业务
4.4.6 前景及预测
4.5 永清环保
4.5.1 公司简介
4.5.2 经营情况
4.5.3 营收构成
4.5.4 毛利率
4.5.5 脱硝业务
4.5.6 前景及预测
4.6 国电清新
4.6.1 公司简介
4.6.2 经营情况
4.6.3 营收构成
4.6.4 毛利率
4.6.5 脱硝业务
4.6.6 前景及预测
4.7 龙源技术
4.7.1 公司简介
4.7.2 营业收入
4.7.3 营收构成
4.7.4 毛利率
4.7.5 脱硝业务
4.7.6 前景及预测
4.8 浙大网新
4.8.1 公司简介
4.8.2 营业收入
4.8.3 营收构成
4.8.4 毛利率
4.8.5 脱硝业务
4.8.6 前景及预测
4.9 华电工程
4.9.1 公司简介
4.9.2 经营情况
4.9.3 脱硝业务
4.10 国电科环
4.10.1 公司介绍
4.10.2 经营情况
4.10.3 营收构成
4.10.4 脱硝业务
4.11 启源装备
4.11.1 公司介绍
4.11.2 经营情况
4.11.3 脱硝业务
4.12 东方凯特瑞
4.12.1 公司介绍
4.12.2 经营状况
4.12.3 主要客户
4.13 大唐南京环保
4.13.1 公司介绍
4.13.2 经营情况
4.13.2 脱硝业务
4.14 江苏万德
4.14.1 公司介绍
4.14.2 脱硝业务
4.15 德创环保
4.15.1 公司简介
4.15.2 经营情况
4.15.3 脱硝业务
4.16 天河环境
4.16.1 公司简介
4.16.2 经营情况
4.16.3 脱硝业务
4.17 其他企业
4.17.1 浙江海量
4.17.2 涿州中天
4.17.3 北京迪诺斯
4.17.4 山东天璨
第五章 总结与预测
5.1 总结
5.2 预测
1 Overview of Thermal Power Denitration
1.1 Background of Denitration
1.2 Denitration Catalyst
1.2.1 SCR Denitration Catalyst
1.2.2 Denitration Principle
1.2.3 SCR Denitration Process
1.2.4 Industry Chain
1.2.5 Barriers to Entry
2 Status Quo of Thermal Power Denitration in China
2.1 Development Environment
2.1.1 Policy
2.1.2 Industry
2.1.3 Technology
2.2 Thermal Power Denitration
2.2.1NOx Emission
2.2.2 Thermal Power Denitration Technology
2.2.3 Thermal Power Denitration Installed Capacity
2.3 Denitration Catalyst Demand
2.4 Denitration Catalyst Supply
3 Competition in Chinese Denitration Market
3.1 Denitration
3.2 SCR Catalyst
4 Key Enterprises in ChinaDenitration Industry
4.1 CPI Yuanda
4.1.1 Profile
4.1.2 Operation
4.1.3 Revenue Structure
4.1.4 Gross Margin
4.1.5Denitration Business
4.1.6 Prospect and Forecast
4.2 WuxiHuaguang Boiler
4.2.1 Profile
4.2.2 Operation
4.2.3 Revenue Structure
4.2.4 Gross Margin
4.2.5Denitration Business
4.2.6 Prospect and Forecast
4.3 FujianLongking
4.3.1 Profile
4.3.2 Operation
4.3.3 Revenue Structure
4.3.4 Gross Margin
4.3.5Denitration Business
4.3.6 Prospect and Forecast
4.4 ZhejiangFeida Environmental Science & Technology
4.4.1 Profile
4.4.2 Operation
4.4.3 Revenue Structure
4.4.4 Gross Margin
4.4.5Denitration Business
4.4.6 Prospect and Forecast
4.5 Yonker Environmental Protection
4.5.1 Profile
4.5.2 Operation
4.5.3 Revenue Structure
4.5.4 Gross Margin
4.5.5Denitration Business
4.5.6 Prospect and Forecast
4.6 Beijing SPC Environment Protection Tech
4.6.1 Profile
4.6.2 Operation
4.6.3 Revenue Structure
4.6.4 Gross Margin
4.6.5Denitration Business
4.6.6 Prospect and Forecast
4.7 Yantai Longyuan Power Technology
4.7.1 Profile
4.7.2 Revenue
4.7.3 Revenue Structure
4.7.4 Gross Margin
4.7.5Denitration Business
4.7.6 Prospect and Forecast
4.8 Insigma Technology
4.8.1 Profile
4.8.2 Revenue
4.8.3 Revenue Structure
4.8.4 Gross Margin
4.8.5Denitration Business
4.8.6 Prospect and Forecast
4.9 ChinaHuadian Engineering
4.9.1 Profile
4.9.2 Operation
4.9.3Denitration Business
4.10 Guodian Technology & Environment Group
4.10.1 Profile
4.10.2 Operation
4.10.3 Revenue Structure
4.10.4Denitration Business
4.11 Xi’anQiyuan Mechanical and Electrical Equipment
4.11.1 Profile
4.11.2 Operation
4.11.3Denitration Business
4.12 DKC (Chengdu Dongfang KWH Environmental Protection Catalysts Co., Ltd.)
4.12.1 Profile
4.12.2 Operation
4.12.3 Major Customers
4.13 Datang Nanjing Environmental Protection
4.13.1 Profile
4.13.2 Operation
4.13.2Denitration Business
4.14 Jiangsu Wonder
4.14.1 Profile
4.14.2Denitration Business
4.15 TUNA
4.15.1 Profile
4.15.2 Operation
4.15.3Denitration Business
4.16 Tianhe Environmental Engineering
4.16.1 Profile
4.16.2 Operation
4.16.3Denitration Business
4.17 Other Enterprises
4.17.1ZhejiangHailiang
4.17.2ZhuozhouZhongtian
4.17.3BeijingDenox
4.17.4Shandong GEMSKY
5 Summary and Forecast
5.1 Summary
5.2 Forecast
图:蜂窝式、板式、波纹式催化剂(从左至右)
图:SCR脱硝工作原理
图:典型火电厂SCR 脱硝工艺流程
图:SCR脱硝催化剂产业链
表:2009-2014年中国脱硝行业相关政策
表:2011年火电厂燃煤锅炉大气污染排放标准
图:2005-2013年中国环境治理投资额
表:2005-2013年中国老工业源污染治理投资情况
图:2005-2013年中国污染设施运行费用
表:中国主要SCR脱硝催化剂生产企业技术来源
图:2007-2016年中国氮氧化物排放量
图:2013年中国氮氧化物排放来源
图:2013年中国氮氧化物(分行业)排放量
图:2007-2014年中国火力发电氮氧化物排放量
表:中国采用SCNR技术的电厂
表:低氮燃烧技术与烟气脱销技术比较
图:2005-2014年中国火电装机总容量及占比
图:2010-2017年中国SCR脱硝催化剂需求量
图:2010-2017年中国SCR脱硝催化剂(分类型)需求量
图:2011-2014年中国SCR脱硝催化剂产能
图:2013年脱硝机组总装机量中主要脱硝公司的累计市场占有率
表:脱硝领域重点企业
图:2013年中国SCR催化剂生产企业地域分布
表:中国主要SCR催化剂生产企业产能
表:SCR脱硝催化剂价格
图:2008-2014年中电远达营业收入及净利润
图:2008-2014年中电远达(分产品)营业收入
图:2013-2014年中电远达(分地区)营业收入份额
图:2008-2014年中电远达(分产品)毛利率
图:2010-2014年中电远达脱硝催化剂销量
表:中电远达子公司及其业务
图:2012-2017年中电远达营业收入及净利润
图:2008-2014年华光股份营业收入及净利润
表:2008-2014年华光股份(分产品)营业收入
图:2009-2014年华光股份(分地区)营业收入
图:2008-2014年华光股份(分产品)毛利率
图:2012-2014年华光股份脱硝催化剂产能
图:2012-2017年华光股份营业收入及净利润
图:2008-2014年龙净环保营业收入及净利润
表:2008-2014年龙净环保(分产品)营业收入
图:2008-2014年龙净环保(分地区)营业收入
图:2008-2014年龙净环保(分产品)毛利率
图:2012-2017年龙净环保营业收入及净利润
图:2008-2014年菲达环保营业收入及净利润
图:2008-2014年菲达环保(分产品)营业收入
图:2008-2014年菲达环保(分地区)营业收入
图:2008-2014年菲达环保毛利率
图:2011-2013年菲达环保环保设备产销量
图:2012-2017年菲达环保营业收入及净利润
图:2008-2014年永清环保营业收入及净利润
表:2008-2014年永清环保(分产品)营业收入
图:2008-2014年永清环保(分地区)营业收入
图:2008-2014年永清环保(分产品)毛利率
图:2008-2014年国电清新营业收入及净利润
表:2008-2014年国电清新(分产品)营业收入
图:2013-2014年国电清新(分地区)营业收入
图:2008-2014年国电清新(分产品)毛利率
图:2012-2017年国电清新营业收入及净利润
图:2008-2014年龙源技术营业收入及净利润
图:2008-2014年龙源技术(分产品)营业收入
图:2013-2014年龙源技术(分地区)营收份额
图:2008-2014年龙源技术(分产品)毛利率
图:2012-2017年龙源技术营业收入及净利润
图:2008-2014年浙大网新营业收入及净利润
图:2008-2014年浙大网新(分产品)营业收入
图:2008-2014年浙大网新(分地区)营业收入
图:2008-2014年浙大网新(分产品)毛利率
图:2012-2014年众合机电营业收入及净利润
图:2012-2017年浙大网新营业收入及净利润
图:2008-2014年华电工程营业收入及净利润
表:国电科环环保子公司及主要业务
图:2008-2014年国电科环营业收入及净利润
表:2008-2014年国电科环(分产品)营业收入
表:2014年上半年国电科环环保业务营业收入
图:2010-2015年国电科环脱硝催化剂产能
图:2008-2014年启源装备营业收入及净利润
图:2010-2013年东方凯特瑞营业收入及净利润
表:2012-2014年东方凯特瑞主要中国客户
图:2011-2014年大唐环保脱硝催化剂产能
图:2012-2014年大唐环保重点脱硝项目
图:万德科技脱硝催化剂产能规划
图:2011-2014年德创股份(分产品)营业收入
图:2011-2013年天河环境营业收入
图:2011-2014年天河环境SCR催化剂产能
表:2013-2014年浙江海亮环境材料有限公司业绩表
图:2010-2014年涿州中天环保SCR催化剂产能)
表:2012-2013年迪诺斯主要项目
表:2012年山东天璨营业收入及净利润
表:2013-2014年山东天璨主要项目
图:2007-2014年中国火电脱硝装机容量占比
图:2013年脱硝机组总装机量中主要脱硝公司的累计市场占有率
表:中国主要SCR脱硝催化剂生产企业产能
表:2003-2012年脱硫行业发展历程
Cellular, Plate and Corrugated Catalysts (from left to right)
SCR Denitration Principles
SCR Denitration Process of Typical Thermal Power Plants
SCR Denitration Catalyst Industry Chain
Policies on ChinaDenitration Industry, 2009-2014
Air Pollution Emission Standards for Coal-fired Boilers of Thermal Power Plants, 2011
China's Investment in Environmental Control, 2005-2013
China's Investment in Pollution Control of Old Industrial Sources, 2005-2013
China's Pollution Facility Operating Costs, 2005-2013
Main Technical Sources of Major SCR Denitration Catalyst Manufacturers in China
China’s NOx Emission, 2007-2016E
China’s NOx Emission Sources, 2013
China’s NOx Emission (by Industry), 2013
China’s Thermal Power NOx Emission, 2007-2014
Power Plants Using SCNR Technology in China
Comparison between Low Nitrogen Combustion Technology and Flue Gas Denitrification Technology
China’s Thermal Power Denitration Installed Capacity and Proportion, 2005-2014
China's SCR Denitration Catalyst Demand, 2010-2017E
China's SCR Denitration Catalyst Demand (by Type), 2010-2017E
China's SCR Denitration Catalyst Capacity, 2011-2014
Cumulative Market Share of Major Companies by Total Installed Capacity of Denitration Units, 2013
Major Denitration Enterprises
Geographical Distribution of SCR Catalyst Manufacturers in China, 2013
Capacity of Major SCR Catalyst Manufacturers in China
SCR Denitration Catalyst Price
Revenue and Net Income of CPI Yuanda, 2008-2014
Revenue Breakdown of CPI Yuanda (by Product), 2008-2014
Revenue Structure of CPI Yuanda (by Region), 2013-2014
Gross Margin of CPI Yuanda (by Product), 2008-2014
Denitration Catalyst Sales Volume of CPI Yuanda, 2010-2014
Subsidiaries of CPI Yuanda and Their Business
Revenue and Net Income of CPI Yuanda, 2012-2017E
Revenue and Net Income of WuxiHuaguang Boiler, 2008-2014
Revenue Breakdown of WuxiHuaguang Boiler (by Product), 2008-2014
Revenue Breakdown of WuxiHuaguang Boiler (by Region), 2009-2014
Gross Margin of WuxiHuaguang Boiler (by Product), 2008-2014
Denitration Catalyst Capacity of WuxiHuaguang Boiler, 2012-2014
Revenue and Net Income of WuxiHuaguang Boiler, 2012-2017E
Revenue and Net Income of FujianLongking, 2008-2014
Revenue Breakdown of FujianLongking (by Product), 2008-2014
Revenue Breakdown of FujianLongking (by Region), 2008-2014
Gross Margin of FujianLongking (by Product), 2008-2014
Revenue and Net Income of FujianLongking, 2012-2017E
Revenue and Net Income of ZhejiangFeida Environmental Science & Technology, 2008-2014
Revenue Breakdown of ZhejiangFeida Environmental Science & Technology (by Product), 2008-2014
Revenue Breakdown of ZhejiangFeida Environmental Science & Technology (by Region), 2008-2014
Gross Margin of ZhejiangFeida Environmental Science & Technology, 2008-2014
Output and Sales Volume of Environmental Protection Equipment of ZhejiangFeida Environmental Science & Technology, 2011-2013
Revenue and Net Income of ZhejiangFeida Environmental Science & Technology, 2012-2017E
Revenue and Net Income of Yonker Environmental Protection, 2008-2014
Revenue Breakdown of Yonker Environmental Protection (by Product), 2008-2014
Revenue Breakdown of Yonker Environmental Protection (by Region), 2008-2014
Gross Margin of Yonker Environmental Protection (by Product), 2008-2014
Revenue and Net Income of Beijing SPC Environment Protection Tech, 2008-2014
Revenue Breakdown of Beijing SPC Environment Protection Tech (by Product), 2008-2014
Revenue Breakdown of Beijing SPC Environment Protection Tech (by Region), 2013-2014
Gross Margin of Beijing SPC Environment Protection Tech (by Product), 2008-2014
Revenue and Net Income of Beijing SPC Environment Protection Tech, 2012-2017E
Revenue and Net Income of Yantai Longyuan Power Technology, 2008-2014
Revenue Breakdown of Yantai Longyuan Power Technology (by Product), 2008-2014
Revenue Structure of Yantai Longyuan Power Technology (by Region), 2013-2014
Gross Margin of Yantai Longyuan Power Technology (by Product), 2008-2014
Revenue and Net Income of Yantai Longyuan Power Technology, 2012-2017E
Revenue and Net Income of Insigma Technology, 2008-2014
Revenue Breakdown of Insigma Technology (by Product), 2008-2014
Revenue Breakdown of Insigma Technology (by Region), 2008-2014
Gross Margin of Insigma Technology (by Product), 2008-2014
Revenue and Net Income of United Mechanical & Electrical, 2012-2014
Revenue and Net Income of Insigma Technology, 2012-2017E
Revenue and Net Income of ChinaHuadian Engineering, 2008-2014
Environmental Protection Subsidiaries and Major Business of Guodian Tech
Revenue and Net Income of Guodian Tech, 2008-2014
Revenue Breakdown of Guodian Tech (by Product), 2008-2014
Environmental Protection Revenue of Guodian Tech, H1 2014
Denitration Catalyst Capacity of Guodian Tech, 2010-2015E
Revenue and Net Income of Xi'anQiyuan Mechanical and Electrical Equipment, 2008-2014
DKC's Revenue and Net Income, 2010-2013
DKC's Major Customers in China, 2012-2014
Denitration Catalyst Capacity of Datang Nanjing Environmental Protection, 2011-2014
Major Denitration Projects of Datang Nanjing Environmental Protection, 2012-2014
Denitration Catalyst Capacity Plan of Jiangsu Wonder
TUNA's Revenue Breakdown (by Product), 2011-2014
Revenue of Tianhe Environmental Engineering, 2011-2013
SCR Catalyst Capacity of Tianhe Environmental Engineering, 2011-2014
Performance of ZhejiangHailiang, 2013-2014
Environmental Protection SCR Catalyst Capacity of ZhuozhouZhongtian, 2010-2014
Major Projects of Denox, 2012-2013
Revenue and Net Income of Shandong GEMSKY, 2012
Major Projects of Shandong GEMSKY, 2013-2014
Proportion of China’s Thermal Power Denitration Installed Capacity, 2007-2014
Cumulative Market Share of Major Companies by Total Installed Capacity of Denitration Units, 2013
Capacity of Major SCR Denitration Catalyst Manufacturers in China
Development Course of Desulphurization Industry, 2003-2012
如果这份报告不能满足您的要求,我们还可以为您定制报告,请 留言说明您的详细需求。
|