|
|
|
报告导航:研究报告—
TMT产业—电子半导体
|
|
2014-2015年全球及中国显示IC行业研究报告 |
 |
字数:3.1万 |
页数:150 |
图表数:155 |
|
中文电子版:8000元 |
中文纸版:4000元 |
中文(电子+纸)版:8500元 |
|
英文电子版:2400美元 |
英文纸版:2600美元 |
英文(电子+纸)版:2700美元 |
|
编号:ZYW196
|
发布日期:2015-01 |
附件:下载 |
 |
|
|
《2014-2015年全球及中国显示IC行业研究报告》包含以下内容:
1、LCD 驱动IC和触控IC发展趋势
2、LCD 驱动IC和触控IC下游市场分析
3、LCD 驱动IC和触控IC产业分析
4、10家LCD 驱动IC厂家研究
5、13家触控IC厂家及周边厂家研究
LCD 驱动IC和触控IC在2014年发生两起重大并购,一是Synaptic收购Renesas的中小尺寸驱动IC业务,另一起是出货量全球第一的触控IC厂家敦泰收购了旭曜(Orise)。再有就是OGS触控龙头厂家胜华因债务危机破产。
除4K电视外,LCD 驱动IC缺乏亮点。虽然手机显示屏分辨率大幅度提高,但是这并未提升LCD 驱动IC的ASP。因为手机市场经历多年快速成长,已经明显饱和,即便是智能手机增幅也大幅度放缓。除了一线品牌厂家,2、3线品牌手机出货量大幅度下滑。
2014年中国手机市场出现了15年以来首次下滑,2014年中国手机市场累积出货量为4.52亿部,比2013年的5.79亿部下降了21.9%,其中国产品牌手机出货量则下滑23.3%。2014年中国智能手机出货量达3.89亿部,仍然是全球第一大智能手机市场,但是2014年同比下滑8.2%。而平板电脑则连续3个季度出货量下滑,中国的中小型平板电脑厂家大面积倒闭。唯一的亮点是4K电视,电视经历LCD取代CRT第一波换机潮后,开始出现第二波换机潮,更大屏幕更低价格,高分辨率节目源增多是刺激市场的主要原因。

触控IC则经历了痛苦的2014年,In-CELL/On-Cell良率大幅度提高,价格大幅度下滑。以敦泰为例,2011年触控IC的ASP为新台币47.28元,到了2013年降到27.98元,2014年前三季已跌至18.15元,短短三年多,触控IC的ASP大减61.6%。
In-CELL/On-Cell采用LCD 驱动IC和触控IC合二为一是明显的趋势,虽然成本可能稍微增加,但是性能也得到较大的提升,同时缩短了供应链。2018年In-CELL/On-Cell市场占有率预计超过65%,触控IC厂家必须提前转型,所以Synaptic收购Renesas的中小尺寸驱动IC业务,敦泰收购旭曜(Orise)。
为了留住客户,以便在新产品推出时迅速打开市场,加上下游手机市场低迷,触控IC厂家纷纷降低价格来抢占市场,毛利率迅速下滑。而2015年,这个势头丝毫不减,预计ASP跌幅还有20-30%。
Out-cell型触控IC小厂家将来可能无法独立存在,要么被LCD 驱动IC厂家收购,要么倒闭。触控IC厂家必须避开手机和平板电脑领域,工控领域和汽车领域是不错的选择。
The report contains the following aspects:
1, Development trends of LCD driver IC and touch IC
2, Analysis on downstream markets of LCD driver IC and touch IC
3, Analysis on LCD driver IC and touch IC Industries
4, Study on 10 LCD driver IC vendors
5, Study on 13 touch IC vendors and peripheral vendors
In the field of LCD driver IC and touch IC, two major acquisitions occurred in 2014. Synaptic took over the small and medium-sized driver IC business of Renesas; and FocalTech (the world's largest touch IC vendor by shipment) acquired Orise. Besides, the OGS touch giant Wintek went bankruptcy due to debt crisis.
Except 4K TV, LCD driver IC lacks highlights. Although the display resolution of mobile phones gets greatly improved, the ASP of LCD driver IC does not jump. After years of rapid growth, the mobile phone market has been saturated obviously, even the growth rate of smartphones has slowed considerably. Except first-tier brand vendors, second and third-tier brand vendors witness substantial decline in the mobile phone shipment.
In 2014, Chinese mobile phone market saw the first decline in the past 15 years, and the cumulative shipment decreased by 21.9% from 579 million in 2013 to 452 million, in which the shipment of handsets under domestic brands fell 23.3%. China’s smartphone shipment amounted to 389 million in 2014, marking China was still the world's largest smartphone market, but this figure was 8.2% lower than 2013. The tablet PC shipment dropped for three consecutive quarters, and many Chinese small and medium-sized tablet PC vendors collapsed. The only bright spot is 4K TV. After experiencing the first replacement tide that LCD replaced CRT, the TV industry is confronted with the second wave of replacement. Larger screens, lower prices and more high-resolution program sources stimulate the TV market.
Touch IC experienced a painful year in 2014. The yield of In-CELL / On-Cell was improved significantly, while the price slumped. For example, FocalTech’s touch IC ASP was NTD47.28 in 2011, NTD27.98 in 2013 and NTD18.15 in Q3 2014, representing the decline rate of 61.6 %.
It is a clear trend that In-CELL / On-Cell uses the combination of LCD driver IC and touch IC, which needs higher costs but intensifies performance apparently and shortens the supply chain. In 2018, the market share of In-CELL / On-Cell is expected to exceed 65%. In this case, touch IC vendors must conduct restructuring in advance, like Synaptic that took over the small and medium-sized driver IC business of Renesas as well as FocalTech that acquired Orise.
In order to retain customers and quickly open the market when launching new products, touch IC vendors have reduced prices to seize the market amid the sluggish mobile phone market, resulting in the sharp decline in their gross margin. The trend will continue in 2015, and ASP may flop by 20-30%.
Small Out-cell touch IC vendors will feel difficult to survive independently in the future, maybe acquired by LCD driver IC vendors or closed down. Touch IC vendors must avoid mobile phones and tablet PC filed, while industrial control and automotive fields are better options for them.
第一章、驱动IC简介
1.1、TFT-LCD驱动IC简介
1.2、驱动IC制造流程
1.3、触控IC简介
1.4、触控IC发展趋势
1.5、手机触控屏技术发展趋势
1.6、中尺寸触控屏发展趋势
1.7、笔记本电脑触控屏发展趋势
1.8、AIO PC触控屏
1.9、METAL MESH 优势
1.10、METAL MESH供应链
1.11、SILVER NANOFIBERSWIRES纳米银线
第二章、显示下游市场
2.1、触控屏市场规模
2.2、笔记本电脑市场
2.3、平板电脑市场
2.4、全球手机市场
2.5、全球智能手机市场
2.6、中国手机市场
2.7、UHD-TV市场
第三章、触控与驱动IC产业
3.1、驱动IC产业链
3.2、驱动IC发展趋势
3.3、显示驱动IC市场
3.4、显示驱动IC产业
3.5、中国中小尺寸驱动IC市场
3.6、全球手机显示屏发展趋势
3.7、中国手机显示屏发展趋势
3.8、全球手机显示屏产业分析
3.9、触控屏厂家排名
3.10、触控屏厂家与客户配套关系
3.11、触控IC市场趋势
3.12、触控IC市场规模
3.13、触控IC产业分析
第四章、驱动IC厂家研究
4.1、RENESAS瑞萨
4. 2、联咏
4.3、奇景(HIMAX)
4.4、奕力(ILITEK )
4. 5、瑞鼎(RAYDIUM)
4.6、旭曜
4.7、矽创(SITRONIX)
4.8、天钰FITIPOWER
4.9、SILICON WORKS
4.10、LUSEM
4.11、MAGNACHIP
第五章、触控IC设计公司研究
5.1、MELFAS
5.2、敦泰FOCALTECH
5.3、汇顶科技GOODIX
5.4、义隆电子(ELAN MICRROELECTRONICS)
5.5、SYNAPTICS
5.6、CYPRESS
5.7、ATMEL
5.8、禾瑞亚EETI
5.9、瀚瑞微PIXCIR
5.10、晨星半导体
5.11、其他
5.11.1、贝特莱
5.11.2、艾为电子
5.11.3、思立微
第六章、驱动IC产业链厂家研究
6.1、南茂科技CHIPMOS
6.2、颀邦科技(CHIPBOND)
6.3、世界先进(VIS)
1 Introduction to Driver IC
1.1 Introduction to TFT-LCD Driver IC
1.2 Driver IC Fabrication Process
1.3 Introduction to Touch IC
1.4 Touch IC Development Trend
1.5 Development Trend of Mobile Phone Touch Screen Technology
1.6 Development Trend of Medium-sized Touch Screen
1.7 Development Trend of Notebook Computer Touch Screen
1.8 AIO PC Touch Screen
1.9 Advantages of METAL MESH
1.10 METAL MESH Supply Chain
1.11 Silver Nanowires
2 Downstream Display Markets
2.1 Touch Screen Market Size
2.2 Notebook Computer Market
2.3 Tablet PC Market
2.4 Global Mobile Phone Market
2.5 Global Smartphone Market
2.6 Chinese Mobile Phone Market
2.7 UHD-TV Market
3 Touch and Driver IC Industry
3.1 Driver IC Industry Chain
3.2 Driver IC Development Trend
3.3 Display Driver IC Market
3.4 Display Driver IC Industry
3.5 Chinese Small and Medium-sized Driver IC Market
3.6 Global Mobile Phone Display Development Trend
3.7 China's Mobile Phone Display Development Trend
3.8 Global Mobile Phone Display Industry
3.9 Ranking of Touch Screen Vendors
3.10 Supply Relationship between Touch Screen Vendors and Customers
3.11 Touch IC Market Trend
3.12 Touch IC Market Size
3.13 Touch IC Industry
4 Driver IC Vendors
4.1 Renesas
4. 2 Novatek
4.3 Himax
4.4 ILITEK
4. 5 Raydium
4.6 Orise
4.7 Sitronix
4.8 Fitipower
4.9 SILICON WORKS
4.10 LUSEM
4.11 MAGNACHIP
5 Touch IC Design Houses
5.1 MELFAS
5.2 FocalTech
5.3 Goodix
5.4 Elan Microelectronics
5.5 SYNAPTICS
5.6 CYPRESS
5.7 ATMEL
5.8 EETI
5.9 PIXCIR
5.10 MStar Semiconductor
5.11 Others
5.11.1 Betterlife
5.11.2 Awinic
5.11.3 Sili Microelectronics
6 Driver IC Industry Chain Vendors
6.1 ChipMOS
6.2 Chipbond
6.3 VIS
Driver IC Manufaturing Process
2013-2017年全球智能手机触控技术发展趋势
2013-2017年全球智能手机显示屏技术发展趋势
2011-2015年中尺寸触控屏技术分布
2012-2016年笔记本电脑触控屏出货量技术分布
2012-2016年AIO PC触控屏出货量技术分布
纳米银Silver NanofibersWires供应链
2010-2016年全球触控屏市场规模
2010-2016年全球触控屏市场规模(出货量)
2008-2015年笔记本电脑出货量
2010-2013年全球主要笔记本电脑ODM厂家出货量
2011-2016年全球平板电脑出货量
2013年平板电脑主要品牌市场占有率
2012、2013年全球平板电脑制造厂家产量
2007-2015年全球手机出货量
2011-2014年全球3G/4G手机出货量地域分布
Worldwide Mobile Phone Sales to End Users by Vendor in 2013 (Thousands of Units)
Worldwide Smartphone Sales to End Users by Vendor in 2013 (Thousands of Units)
Worldwide Smartphone Sales to End Users by Operating System in 2013 (Thousands of Units)
2013-2015年全球Top 13智能手机厂家出货量
2014年1-11月中国手机月度出货量
2014年中国智能手机市场主要厂家市场占有率
2014年中国4G手机市场主要厂家市场占有率
2013-2017年UHD电视出货量
55-inch UHD TV price vs. FHD TV price
2014-2015 15大电视厂家出货量
2009-2016年全球显示驱动IC市场规模
2009-2014年全球显示驱动IC市场规模类型分布
驱动IC与面板厂家配套关系
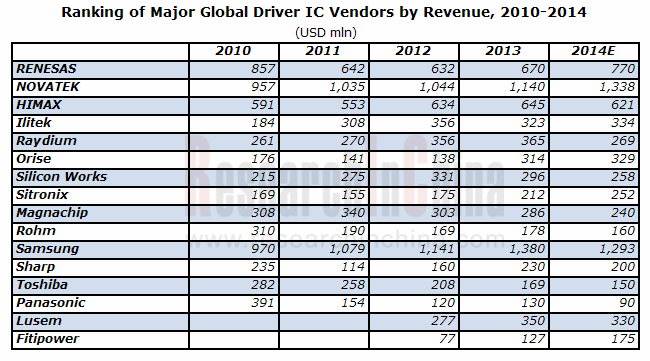
2010-2014年全球主要驱动IC厂家收入排名
2012-2013全球主要驱动IC厂家营业利润率
2010-2018年中国中小尺寸驱动IC分辨率分布
2011-2014年中国主要中小尺寸驱动IC厂家收入排名
2011-2014年中国主要中小尺寸驱动IC厂家出货量排名
2013-2017年全球智能手机显示屏尺寸发展趋势
2013-2017年全球智能手机触控技术发展趋势
2013-2017年全球智能手机显示屏技术发展趋势
2013-2017年全球智能手机显示屏分辨率发展趋势
2014年中国手机市场尺寸分布
2013-2017年中国智能手机显示屏尺寸发展趋势
2014年中国智能手机市场分辨率分布
2013-2017年中国智能手机显示屏分辨率发展趋势
2014年中国手机市场PPI分布
2013-2017年中国智能手机显示屏技术发展趋势
2013-2014年全球主要中小尺寸显示屏厂家出货量
2014年中国手机显示屏主要供应厂家市场占有率
2010-2014年触控屏厂家收入排名
2012-2014年触控屏厂家营业利润率%
三星2012-2013年手机触控屏供应商市场占有率
三星2012-2013年TabletPC触控屏供应商市场占有率
2014年诺基亚触控屏主要供应厂家所占比例
2012年LG触控屏主要供应厂家所占比例
2012年HTC触控屏主要供应厂家所占比例
触控IC商业模式
2011-2016年触控IC市场规模
2012-2015年触控IC市场下游分布
触控IC产业链
2012-2013年触控IC设计公司收入(只计算触控IC业务收入)
2012年2季度-2013年4季度Renesas销售额与毛利率
瑞萨组织结构
2011-2014财年3季度瑞萨收入部门分布
Novatek Organization Chart
2006-2015年联咏收入与运营利润率
2012年12月-2014年12月联咏月度收入与增幅
2012年1季度-2014年3季度联咏季度收入产品分布
奇景关系企业图
2006-2014年奇景收入与运营利润率
2007-2014年奇景收入与毛利率
2006-2013年奇景收入产品分布
2002-2014年奇景出货量
2007-2013年奇景毛利率
2007-2013年奇景OPEX
2011年3季度-2014年3季度奇景季度收入产品分布
2011年1季度-2014年3季度奇景季度运营花费
2011年3季度-2014年3季度奇景季度毛利率
2007-2013年奇景大客户比例
奇景产品与客户分布
奇景供应链
奇景子公司
奇景全球分布
2007-2014年奕力收入与运营利润率
2012年12月-2014年12月奕力月度收入与增幅
2007-2014年奕力出货量
2008-2013年奕力出货量下游应用分布
2007-2014年瑞鼎收入与运营利润率
2012年12月-2014年12月瑞鼎月度收入与增幅
2011-2013年瑞鼎产量、销量、产值
2007-2014年旭曜收入与运营利润率
2010年1季度-2013年4季度旭曜季度OPEX
2010年1季度-2013年4季度旭曜收入
2010年1季度-2013年4季度旭曜EBT
2012年12月-2014年12月旭曜月度收入与增幅
2008-2011年旭曜产量
2008-2013年旭曜销量
2009年1季度-2013年4季度旭 曜收入产品分布
2012年2季度旭 曜收入客户分布
2013年4季度旭 曜收入客户分布
2009年1季度-2013年2季度旭曜季度出货量
2006-2014年矽创收入与运营利润率
2012年12月-2014年12月矽创月度收入与增幅
2011-2014年矽创收入产品分布
2011年12月-2014年12月天钰科技月度收入与增幅
2009-2014年Silicon Works收入与营业利润率
2009-2013年Silicon Works收入产品分布
Lusem组织结构
2004-2013年Magnachip收入与毛利率
2004-2013年Magnachip收入业务分布
2009-2013年Magnachip收入地域分布
MAGNACHIP 各晶圆厂一览
2007-2014年Melfas收入与运营利润率
2007-2014年Melfas收入产品分布
2013年1季度-2014年4季度Melfas季度收入与运营利润率
2013年敦泰收入客户分布
汇顶科技股东结构
2013年汇顶科技主要供应商所占采购比例
2004-2014年义隆电子收入与运营利润率
2012年12月-2014年12月义隆电子月度收入与增幅
2011年1季度-2013年4季度Elan收入产品分布
2010-2011年义隆电子收入客户分布
FY2006-2015 Synaptics收入与运营利润率
2004-2014财年 Synaptics收入下游应用分布
FY2010-2014 SYNAPTICS收入地域分布
2014 SYNAPTICS收入客户分布
SYNAPTICS产品线
采用Synaptic产品的中国手机
2007-2014年Cypress收入与运营利润率
2009-2014年 Cypress收入业务分布
2009-2014年Cypress收入地域分布
2006-2014年ATMEL收入与营业利润率
2008-2014年ATMEL收入业务分布
2012-2013年Atmel营业利润分布
2008-2014年ATMEL收入地域分布
ATMEL TOUCH PANEL CONTROL IC ROADMAP
2008-2014年禾瑞亚收入与营业利润率
2012年12月-2014年12月禾瑞亚月度收入
ChipMOS业务分布
2003-2014年ChipMOS收入与毛利率
2014年前3季度CHIPMOS收入产品分布
2010-2014年ChipMOS LCD Driver Segment Revenue
2010-2014年ChipMOS LCD Driver Segment Capacity
ChipMOS Roadmap
2010-2014 ChipMOS CAPEX
2006-2013年南茂科技收入地域分布
2013年ChipMOS客户分布
Category Distribution of Active Patents of ChipMOS
2012年全球图形驱动IC Gold Bump厂家市场占有率
2006-2014年Chipbond收入与运营利润率
颀邦COG\COF 产能地域分布
颀邦TAB 产能分布
2012年12月-2014年12月颀邦月度收入
2005-2014年VIS收入与营业利润率
2012年12月-2014年12月世界先进半导体月度收入
2012年1季度-2014年3季度VIS收入与毛利率
2012年1季度-2014年3季度VIS收入节点(Node)分布
2012年1季度-2014年3季度VIS收入下游应用分布
2012年1季度-2014年3季度VIS收入产品分布
2012年1季度-2014年3季度VIS出货量与产能利用率
Driver IC Manufaturing Process
Development Trend of Global Smartphone Touch Technology, 2013-2017E
Development Trend of Global Smartphone Display Technology, 2013-2017E
Medium-sized Touch Screens by Technology, 2011-2015
Laptop Computer Touch Screen Shipment by Technology, 2012-2016E
AIO PC Touch Screen Shipment by Technology, 2012-2016E
Supply Chain of Silver Nanowires
Global Touch Screen Market Size, 2010-2016E
Global Touch Screen Market Size (Shipment), 2010-2016E
Laptop Computer Shipment, 2008-2015
Shipment of World’s Major Laptop ODM Vendors, 2010-2013
Global Tablet PC Shipment, 2011-2016E
Market Share of Main Tablet PC Brands, 2013
Output of Global Tablet PC Vendors, 2012-2013
Global Mobile Phone Shipment, 2007-2015E
Global 3G / 4G Mobile Phone Shipment by Region, 2011-2014
Worldwide Mobile Phone Sales to End Users by Vendor in 2013
Worldwide Smartphone Sales to End Users by Vendor in 2013
Worldwide Smartphone Sales to End Users by Operating System in 2013
Shipment of Global Top 13 Smartphone Vendors, 2013-2015E
China's Monthly Mobile Phone Shipment, Jan-Nov 2014
Market Share of Main Vendors in Chinese Smartphone Market, 2014
Market Share of Main Vendors in Chinese 4G Mobile Phone Market, 2014
UHD TV Shipment, 2013-2017E
55-inch UHD TV Price vs. FHD TV Price
Shipment of Top 15 TV Vendors, 2014-2015
Global Display Driver IC Market Size, 2009-2016E
Global Display Driver IC Market Size by Type, 2009-2014
Supply Relationship between Driver IC and Panel Vendors
Ranking of Major Global Driver IC Vendors by Revenue, 2010-2014
Operating Margin of Major Global Driver IC Vendors, 2012-2013
Resolution Distribution of China's Small and Medium-sized Driver IC, 2010-2018E
Ranking of Major Small and Medium-sized Driver IC Vendors in China by Revenue, 2011-2014
Ranking of Major Small and Medium-sized Driver IC Vendors in China by Shipment, 2011-2014
Development Trend of Global Smartphone Display Size, 2013-2017E
Development Trend of Global Smartphone Touch Technology, 2013-2017E
Development Trend of Global Smartphone Display Technology, 2013-2017E
Development Trend of Global Smartphone Display Resolution, 2013-2017E
Chinese Mobile Phone Market by Size, 2014
Development Trend of China's Smartphone Display Size, 2013-2017E
Chinese Smartphone Market by Resolution, 2014
Development Trend of China's Smartphone Display Resolution, 2013-2017E
Chinese Mobile Phone Market by PPI, 2014
Development Trend of China's Smartphone Display Technology, 2013-2017E
Shipment of Major Global Small and Medium-sized Display Vendors, 2013-2014
Market Share of Major Mobile Phone Display Suppliers in China, 2014
Ranking of Touch Screen Vendors by Revenue, 2010-2014
Operating Margin of Touch Screen Vendors, 2012-2014
Market Share of Samsung's Mobile Phone Touch Screen Suppliers, 2012-2013
Market Share of Samsung's Tablet PC Touch Screen Suppliers, 2012-2013
Proportion of Nokia's Major Touch Screen Suppliers, 2014
Proportion of LG's Major Touch Screen Suppliers, 2012
Proportion of HTC's Major Touch Screen Suppliers, 2012
Touch IC Business Models
Touch IC Market Size, 2011-2016E
Touch IC Market by Application, 2012-2015
Touch IC Industry Chain
Revenue of Touch IC Design Houses (Only Including Touch IC Revenue), 2012-2013
Revenue and Gross Margin of Renesas, Q2 2012-Q4 2013
Organizational Structure of Renesas
Revenue of Renesas by Division, FY2011-Q3 FY2014
Novatek's Organization Chart
Novatek's Revenue and Operating Margin, 2006-2015
Novatek's Monthly Revenue and Growth Rate, Dec 2012- Dec 2014
Novatek's Quarterly Revenue by Product, Q1 2012-Q3 2014
Himax's Affiliated Companies
Himax's Revenue and Operating Margin, 2006-2014
Himax's Revenue and Gross Margin, 2007-2014
Himax's Revenue by Product, 2006-2013
Himax's Shipment, 2002-2014
Himax's Gross Margin, 2007-2013
Himax's OPEX, 2007-2013
Himax's Quarterly Revenue by Product, Q3 2011-Q3 2014
Himax's Quarterly Operating Expenses, Q1 2011-Q3 2014
Himax's Quarterly Gross Margin, Q3 2011-Q3 2014
Proportion of Himax's Key Customers, 2007-2013
Himax's Products and Customer Distribution
Himax's Supply Chain
Himax's Subsidiaries
Himax's Global Presence
ILITEK's Revenue and Operating Margin, 2007-2014
ILITEK's Monthly Revenue and Growth Rate, Dec 2012- Dec 2014
ILITEK's Shipment, 2007-2014
ILITEK's Shipment by Application, 2008-2013
Raydium's Revenue and Operating Margin, 2007-2014
Raydium's Monthly Revenue and Growth Rate, Dec 2012- Dec 2014
Raydium's Output, Sales Volume and Output Value, 2011-2013
Orise's Revenue and Operating Margin, 2007-2014
Orise's Quarterly OPEX, Q1 2010-Q4 2013
Orise's Revenue, Q1 2010-Q4 2013
Orise's EBT, Q1 2010-Q4 2013
Orise's Monthly Revenue and Growth Rate, Dec 2012- Dec 2014
Orise's Output, 2008-2011
Orise's Sales Volume, 2008-2013
Orise's Revenue by Product, Q1 2009-Q4 2013
Orise's Revenue by Customer, Q2 2012
Orise's Revenue by Customer, Q4 2013
Orise's Quarterly Shipment, Q1 2009-Q2 2013
Sitronix's Revenue and Operating Margin, 2006-2014
Sitronix's Monthly Revenue and Growth Rate, Dec 2012- Dec 2014
Sitronix's Revenue by Product, 2011-2014
Fitipower's Monthly Revenue and Growth Rate, Dec 2011- Dec 2014
Revenue and Operating Margin of Silicon Works, 2009-2014
Revenue of Silicon Works by Product, 2009-2013
Lusem's Organizational Structure
Magnachip's Revenue and Gross Margin, 2004-2013
Magnachip's Revenue by Business, 2004-2013
Magnachip's Revenue by Region, 2009-2013
Magnachip's Fabs
Revenue and Operating Margin of Melfas, 2007-2014
Revenue of Melfas by Product, 2007-2014
Quarterly Revenue and Operating Margin of Melfas, Q1 2013-Q4 2014
FocalTech's Revenue by Customer, 2013
Goodix's Shareholder Structure
Procurement Proportion of Goodix's Major Suppliers, 2013
Revenue and Operating Margin of Elan Microelectronics, 2004-2014
Monthly Revenue and Growth Rate of Elan Microelectronics, Dec 2012- Dec 2014
Revenue of Elan Microelectronics by Product, Q1 2011-Q4 2013
Revenue of Elan Microelectronics by Customer, 2010-2011
Revenue and Operating Margin of Synaptics, FY2006-FY2015
Revenue of Synaptics by Application, FY2004-FY2014
Revenue of Synaptics by Region, FY2010-FY2014
Revenue of Synaptics by Customer, 2014
Product Lines of Synaptics
Chinese Mobile Phones Using Products of Synaptics
Revenue and Operating Margin of Cypress, 2007-2014
Revenue of Cypress by Business, 2009-2014
Revenue of Cypress by Region, 2009-2014
ATMEL's Revenue and Operating Margin, 2006-2014
ATMEL's Revenue by Business, 2008-2014
ATMEL's Operating Profit Distribution, 2012-2013
ATMEL's Revenue by Region, 2008-2014
ATMEL's Touch Panel Control IC Roadmap
EETI's Revenue and Operating Margin, 2008-2014
EETI's Monthly Revenue, Dec 2012- Dec 2014
Business Distribution of ChipMOS
Revenue and Gross Margin of ChipMOS , 2003-2014
Revenue of ChipMOS by Product, Q1-Q3 2014
LCD Driver Segment Revenue of ChipMOS, 2010-2014
LCD Driver Segment Capacity of ChipMOS, 2010-2014
Roadmap of ChipMOS
CAPEX of ChipMOS, 2010-2014
Revenue of ChipMOS by Region, 2006-2013
Customer Distribution of ChipMOS, 2013
Category Distribution of Active Patents of ChipMOS
Market Share of Global Graphic Driver IC Gold Bump Vendors, 2012
Chipbond's Revenue and Operating Margin, 2006-2014
Chipbond's COG \ COF Capacity by Region
Chipbond's TAB Capacity Distribution
Chipbond's Monthly Revenue, Dec 2012- Dec 2014
Revenue and Operating Margin of VIS, 2005-2014
Monthly Revenue of VIS, Dec 2012- Dec 2014
Revenue and Gross Margin of VIS, Q1 2012-Q3 2014
Revenue of VIS by Node, Q1 2012-Q3 2014
Revenue of VIS by Application, Q1 2012-Q3 2014
Revenue of VIS by Product, Q1 2012-Q3 2014
Shipment and Capacity Utilization of VIS, Q1 2012-Q3 2014
如果这份报告不能满足您的要求,我们还可以为您定制报告,请 留言说明您的详细需求。
|