|
|
|
报告导航:研究报告—
TMT产业—电子半导体
|
|
2014-2015年全球及中国LED行业研究报告 |
 |
字数:2.9万 |
页数:137 |
图表数:140 |
|
中文电子版:8000元 |
中文纸版:4000元 |
中文(电子+纸)版:8500元 |
|
英文电子版:2600美元 |
英文纸版:2800美元 |
英文(电子+纸)版:2900美元 |
|
编号:ZYW197
|
发布日期:2015-02 |
附件:下载 |
 |
|
|
《2014-2015年全球及中国显示LED行业研究报告》包含以下内容:
1、LED市场发展趋势
2、LED产业分析
3、38家LED厂家研究
LED在2012、2013年经历低谷,价格暴跌,不少企业破产或退出LED领域,仍坚持生产的企业则减少产能,不少企业的产能扩展计划终止,这在LED上游尤其明显。价格降低刺激了市场,产能减少稳定了价格,于是LED产业在2014年上半年大幅度好转,不过好景不长,市场好转刺激企业开足马力生产,那些本来关停的产能也重启,而2014年下半年LED市场就急转直下,2015年可能会继续恶化。
虽然LED照明市场看起来前景很好,但是其门槛也很低,特别是LED照明下游领域,几乎没有任何资金和技术门槛,市场完全是靠价格竞争。再有就是LED照明下游领域厂家众多,为了打开市场,各厂家不得不投入大量资金进行市场营销,因此,LED照明市场看起来前景很好,但实际企业利润尤其是营业利润却是节节下滑。以美国大厂Cree为例,2014年4季度的营业利润率仅为2.5%,而2013年4季度还有8.5%。
在2014年10月,三星宣布退出海外LED照明市场,专心韩国本土的市场。此外GE也在2014年9月重新定位年收入30亿美元的照明业务,也有剥离照明业务的可能,东芝也基本放弃了海外LED照明市场。
而飞利浦则采取两步走,2014年7月,飞利浦将照明部门中的LED Chip业务和汽车照明业务独立为一个全新的公司,然后将其他业务独立为飞利浦照明公司。未来飞利浦会将飞利浦照明的股份对外出售,而高利润的LED Chip业务和汽车照明业务仍然是飞利浦全资子公司。
公认最佳性能的白光LED专利是日亚化学(NICHIA)的YAG,此项专利费极高,并且日亚化学对专利授权非常苛刻,但此专利于2017年到期。其他公司的白光专利在2017年后面临贬值,例如丰田合成的含Sr、Ba和Ca的正硅酸盐荧光粉专利。丰田合成近期LED业务收入下滑,利润暴跌,丰田合成很愿意低价转让专利,2014年丰田合成向台湾的宏齐光电和大陆的聚飞光电转让了此项专利,这也是大陆企业首次拥有LED白光专利。但聚飞广电仅是一家下游封装厂家,丰田合成转让专利一来获得利润,二来则委托聚飞光电代工。
2014年LED产业各厂家都在积极延伸产业链,封装厂家纷纷进入灯具的零售环节,以中国大陆厂家最为明显。例如大陆最大的封装企业木林森,正在大规模组建终端营销网络,2014年已经建立超过300家经销网络,未来目标是3000家经销网络。2014年8月,同方股份收购香港上市的真明丽,真明丽2014财年营业收入8.41亿港币,净利润亏损7.31亿港币,但是真明丽拥有完整的营销网络,这正是同方股份所看重的。
2014年LED产业最重大收购是晶元光电收购璨圆。晶元光电收购璨圆之后,将获得来自璨圆中国大陆子公司超过四百台MOCVD机台,比竞争对手机台数量高过一倍以上。晶元光电于2014年第四季的产能市占预计可达11%,而在合并璨圆之后,将可再增约4%的产能市占,总计达15%,远高于第二名三安光电及三星(Samsung)的7%,将稳居全球最大GaN晶圆供应商地位。
Global and China LED Industry Report, 2014-2015 is primarily concerned with the following:
1. LED development trend
2. LED industry analysis
3. 38 LED companies
After experiencing fall to the bottom and price slump in LED during 2012-2013, quite a few LED enterprises have been forced to go bankrupt or retreat from the industry. However, those that still struggled on the manufacturing front have reduced their capacity. Even worse, so many companies have aborted their capacity expansion plans, which is particularly true of the upstream sectors. Price reduction stimulates the market and capacity cuts stabilizes the price. Therefore, the LED industry improved greatly in the first half of 2014, which soon came to an end. The market rise propelled enterprises to operate in full capacity, and even the enterprises that had been closed down resumed their capacity. But in the second half of 2014, the LED market plummeted and will very likely continue to worsen in 2015.
The LED lighting market seems to have broad prospects, but the industry’s threshold is extremely low, especially in downstream sectors of LED lighting, which virtually have no financial and technical thresholds. Price competition prevails in this market. On the other hand, there are a great number of enterprises in the downstream sectors of LED lighting industry that they, to open the market, have to invest capital into marketing. Although LED lighting market looks good, the profit, particularly operating income, shows declining trend. Take example for Cree, a large US company, whose operating margin in Q4 2014 was only 2.5% in sharp contrast to 8.5% in Q4 2013.
In October 2014, Samsung announced that it would retreat from overseas LED lighting market and shift its focus to the market in South Korea. In addition, GE repositioned its lighting business and is very likely to spin off the lighting business. Toshiba also largely withdrew from the overseas LED lighting market.
In July 2014, Philips merged LED Chip business and automotive lighting business into a new company, while other businesses were integrated to form Philips Lighting. In future, Philips will sell the equities of Philips Lighting, and the highly profitable LED Chip and automotive lighting businesses will still be Philips’ wholly-owned subsidiary.
NICHIA’s YAG is generally recognized as white-light LED patent with the best performance. The patent fee is very high and NICHIA has a stringent patent authorization, but this patent will expire in 2017. The white-light LED patents from other companies -- such as Toyota Gosei’s orthosilicate fluorescent powder containing Sr, Ba, and Ca, will devalue after 2017. Recently, Toyota Gosei’s LED revenue declined and its profit slumped, which made the company be willing to transfer its patents at a low price. In 2014, Toyota Gosei transferred the patent to Harvatek and JuFei Optoelectronics. This was the first time that the mainland Chinese enterprise gained the white-light LED patent. However, JuFei Optoelectronics is a downstream packaging enterprise, and Toyota Gosei’s patent transfer is to get profit and to entrust JuFei Optoelectronics to produce for it.
In 2014, as the companies in LED industry were aggressively expanding industry chain and packaging companies were entering retailing fields of lighting industry. This was particularly true of companies in Mainland China. The MLS Lighting -- the largest packaging enterprise in Chinese Mainland, for instance, was building a huge marketing network, with a network of 300 distributors brought into being in 2014. Its target is to create a network of 3,000 distributors. In August 2014, Tsinghua Tongfang acquired Neo-Neon LED Lighting International, a company listed in Hong Kong. In FY 2014, Neo-Neon reported revenue of HKD841 million and a loss of HKD731 million in net income. But the company had a complete marketing network, which was Tsinghua Tongfang’s top concern.
In 2014, Epistar’s buyout of Formosa Epitaxy was the largest acquisition in LED industry. When the acquisition was completed, Epistar would have over 400 MOCVDs , more than doubling that of its rivals. In Q4 2014, Epistar’scapacity was estimated to hold 11% of the market’s total. After the merger, its capacity would increase an additional 4%, far exceeding the 7% for Sanan Optoelectronics and Samsung, which would make it the largest GaN wafer supplier around the world.
第一章、 LED市场
1.1、 LED市场规模
1.2、LED照明市场规模
1.3、LED照明市场趋势
1.4、日本LED照明 市场
1.5、北美LED照明市场
1.6、大尺寸BLU用LED市场
1.7、手机BLU市场
1.8、LED汽车照明
1.8.1、LED汽车照明市场
1.8.2、汽车内饰LED 照明
1.8.3、汽车外饰LED照明
1.9、数位广告牌市场
第二章 LED封装
2.1、LED封装简介
2.2、COB封装
2.3、FLIP-CHIP(覆晶或倒装)封装
2.3.1、FLIP-CHIP封装简介
2.4、中功率LED
2.5、LED封装尺寸趋势
第三章 LED产业链
3.1、LED产业链
3.2、蓝宝石晶棒市场
3.3、蓝宝石晶棒产业
3.4、蓝宝石基板
3.5、Rubicon
3.6、MOCVD产业
3.7、AIXTRON
3.8、VEECO
3.9、LED产业地域分布
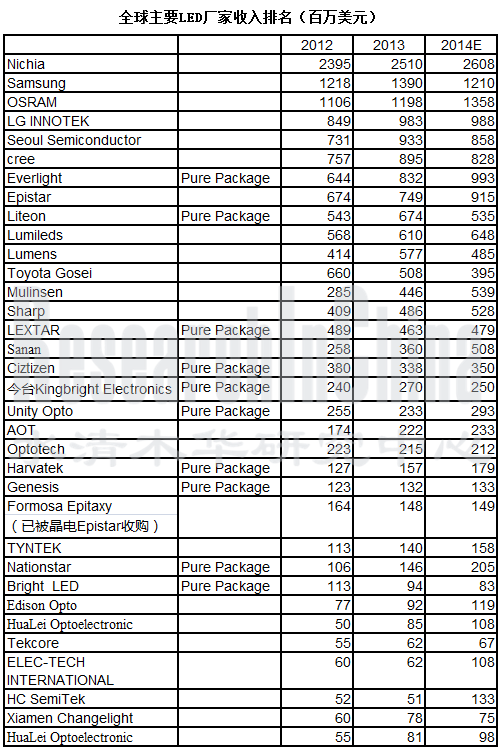
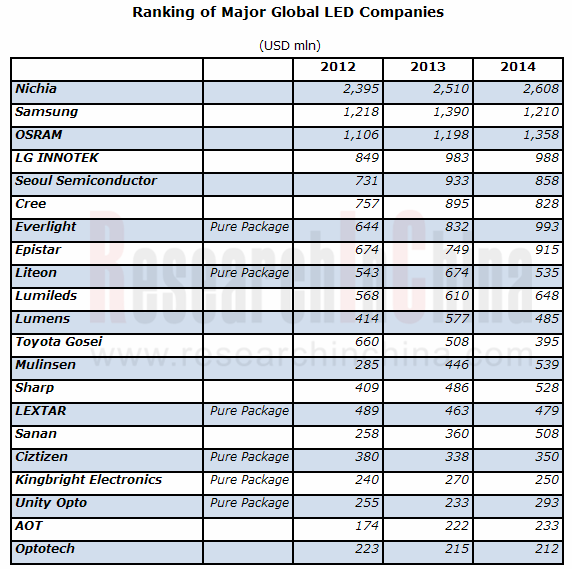
3.10、2012-2014年全球前30大LED厂家收入排名
3.11、中国大陆LED产业总结
3.12、白光LED 专利
第四章 台湾LED厂家研究
4.1、亿光
4.2、晶元光电
4.3、新世纪光电
4.4、璨圆光电
4.5、光宝
4.6、荣创能源
4.7、佰鸿
4.8、光磊
4.9、宏齐
4.10、泰谷
4.11、东贝
4.12、广镓
4.13、隆达
4.14、鼎元光电
4.15、艾笛森
第五章 中国大陆LED厂商研究
5.1、上海蓝光
5.2、华磊光电
5.3、士兰明芯
5.4、三安光电
5.5、南通同方半导体
5.6、浪潮华光
5.7、国星光电
5.8、上海蓝宝
5.9、大连路美
5.10、乾照光电
5.11、德润豪达
5.12、华灿光电
5.13、木林森
第六章 海外LED厂商研究
6.1、CREE
6.2、丰田合成
6.3、日亚化学
6.4、OSRAM OPTO SEMICONDUCTOR
6.5、Lumileds(Philips)
6.6、首尔半导体Seoul Semiconductor
6.7、LG INNOTEK
6.8、三星LED
6.9、Lumens
1 LED Market
1.1 LED Market Size
1.2 LED Lighting Market Size
1.3 LED Lighting Market Trend
1.4 Japan’s LED Lighting Market
1.5 North America’s LED Lighting Market
1.6 LED for Large-size BLU Market
1.7 Mobile Phone BLU Market
1.8 LED Automotive Lighting
1.8.1 LED Automotive Lighting Market
1.8.2 Automotive Interior LED Lighting
1.8.3 Automotive Exterior LED Lighting
1.9 Digital Billboard Market
2 LED Packaging
2.1 Overview of LED Packaging
2.2 COB Packaging
2.3 Flip Chip Packaging
2.3.1 Introduction
2.4 Medium Power LED
2.5 Trend of LED Packaging Size
3 LED Industry Chain
3.1 LED Industry Chain
3.2 Sapphire Ingot Market
3.3 Sapphire Ingot Industry
3.4 Sapphire Substrate
3.5 Rubicon
3.6 MOCVD Industry
3.7 AIXTRON
3.8 VEECO
3.9 Geographical Distribution of LED Industry
3.10 Global Top 30 LED Vendors by Revenue, 2012-2014
3.11 Summary of LED Industry in Mainland China
3.12 White Light LED Patents
4 Taiwanese LED Companies
4.1 Everlight Electronics
4.2 Epistar Corporation
4.3 Genesis Photonics
4.4 Formosa Epitaxy
4.5 Lite-On Technology
4.6 Advanced Optoelectronic Technology
4.7 Bright LED Electronics Corp.
4.8 Opto Tech
4.9 Harvatek
4.10 Tekcore
4.11 Unity Opto Technology
4.12 Huga Optotech
4.13 Lextar Electronics
4.14 TYNTEK
4.15 Edison Opto
5 LED Companies in Mainland China
5.1 Epiligh Technology Co., Ltd.
5.2 Hunan HuaLei Optoelectronic Corporation
5.3 Hangzhou Silan Azure Co., Ltd.
5.4 Sanan Optoelectronics Co., Ltd.
5.5 Nantong Tongfang Semiconductor Co., Ltd.
5.6 Shandong Inspur Huaguang Optoelectonics Co., Ltd.
5.7 Foshan Nationstar Optoelectronics Co. Ltd.
5.8 Shanghai Rainbow Optoelectronics Material Co. Ltd.
5.9 Dalian Lumei Optoelectronics Corporation
5.10 Xiamen Changelight Co., Ltd.
5.11 Elec-tech International Co., Ltd.
5.12 HC SemiTek Corporation
5.13 MLS Lighting Co., Ltd.
6 Foreign LED Companies
6.1 Cree Inc.
6.2 Toyoda Gosei
6.3 Nichia Corporation
6.4 Osram Opto Semiconductor
6.5 Philips Lumileds Lighting Company
6.6 Seoul Semiconductor.
6.7 LG Innotek
6.8 Samsung LED
6.9 Lumens Digital Optics Inc.
2008-2016年全球LED市场规模
2013-2018年LED市场规模下游分布
2009-2017年全球照明市场技术分布
2011-2016年LED Chips Volume of Lighting by Application
各个国家的照明节能政策
2012年5月-2014年1月 Price trend of 40W and 60W LED light bulbs
2012-2014年日本LED Bulb ASP
2012-2014年日本Bulbs Sales Volume Growth
2013年日本LED照明市场主要厂家市场占有率
2009-2015年BLU大尺寸应用比例
2007-2014年全球手机出货量
2011-2014年全球3G/4G手机出货量地域分布
Worldwide Smartphone Sales to End Users by Vendor in 2013 (Thousands of Units)
Worldwide Smartphone Sales to End Users by Operating System in 2013 (Thousands of Units)
Worldwide Mobile Phone Sales to End Users by Vendor in 2013 (Thousands of Units)
2010-2016年全球LED汽车照明市场规模
2007-2014年五种汽车光源成本与光照度发展趋势
LED结构
LED成本分析
COB封装
2012-2016 Sapphire Ingot Demand Forecast in Volume
2012-2016 Sapphire Ingot Demand Forecast in Value
2012-2016年全球主要Sapphire Ingot厂家Capacity Trend
2012-2016年Sapphire Ingot Price Forecast By Size
2012-2016 Demand for sapphire Substrates by country
2012-2016 Demand for sapphire Substrates by Size
2005-2014年Rubicon收入与运营利润率
Rubicon Technology生产流程
2009-2013年Rubicon 收入地域分布
2009-2013年Rubicon 收入产品分布
2009-2017年LED前端设备市场规模
1999-2013年MOCVD主要厂家市场占有率
AIXTRON全球分布
2003-2014年AIXTRON收入与EBIT率
AIXTRON 连续8季度Revenue\New Order\Backlog
2010年AIXTRON收入应用分布、地域分布
2014年前3季度AIXTRON Revenue by Application and Region
1999-2013年AIXTRON收入下游应用分布
2004-2014年VEECO收入与运营利润率
2011-2013年VEECO收入业务分布
VEECO主要客户
2013年3季度-2014年3季度VEECO季度订单应用分布
2013、2014年全球LED 产值地域分布
台湾LED 厂家2012-2014年营业利润率
EVERLIGHT(亿光电子)组织结构
2003-2014年EVERLIGHT(亿光电子)收入与运营利润率
2008-2011年EVERLIGHT(亿光电子)收入产品分布
2012-2015年EVERLIGHT(亿光电子)收入产品分布
2005-2015年EVERLIGHT(亿光电子)收入下游应用分布
2013-2014年EVERLIGHT(亿光电子)产能与产能利用率
2012年12月-2014年12月亿光月度收入与增幅
2011年4季度-2014年3季度亿光电子季度收入与库存
2011年4季度-2013季度亿光电子季度Debt Ratio
晶元光电组织结构
2004-2014年晶元光电收入与运营利润率
2012年12月-2014年12月晶元光电月度收入与增幅
2012-2015年EPISTAR收入下游应用
2012-2015年EPISTAR按产品收入细分
EPISTAR研发能力
2012年EPISTAR Sales Breakdown by Customer
2003-2014年新世纪光电收入与毛利率
2003-2014年新世纪光电收入与营业利润率
2012年12月-2014年12月新世纪光电月度收入
2002-2014年璨圆光电收入与运营利润率
2012年12月-2014年12月璨圆光电月度收入与增幅
2009-2013年璨圆光电收入产品分布
2012-2013年璨圆光电产能
2002-2014年佰鸿工业收入与运营利润率
2012年12月-2014年12月佰鸿工业月度收入与增幅
2004-2014年光磊收入与毛利率
2008-2014年光磊收入与营业利润率
2012年12月-2014年12月光磊月度收入
2008-2013年光磊收入产品分布
2013-Q1/2014年光磊系统产品除外收入地域分布
2013-Q1/2014年光磊系统产品收入地域分布
2000-2014年宏齐收入与运营利润率
2012年12月-2014年12月宏齐月度收入
2005-2014年泰谷收入与毛利率
2008-2014年泰谷收入与营业利润率
2012年12月-2014年12月泰谷月度收入与增幅
2004-2014年东贝收入与运营利润率
2012年12月-2014年12月东贝月度收入与增幅
2004-2012年广稼收入与运营利润统计
2010年5月-2012年5月广稼月度收入与增幅
2009-2014年隆达电子收入与运营利润率
2012年12月-2014年12月隆达月度收入与增幅
Tyntek Organization
2004-2014年鼎元光电收入与运营利润率
2012年12月-2014年12月鼎元光电月度收入与增幅
2006-2014年艾笛森收入与运营利润率
2012年12月-2014年12月艾笛森月度收入与增幅
2010-2014年荣创能源收入与毛利率
2012年12月-2014年12月荣创能源月度收入
AOT主要客户
2013年1季度-2014年3季度AOT收入下游应用
AOT技术路线图
2008-2012年上海市蓝光科技收入与净利润
2006-2014年士兰微电子收入与运营利润率
2007-2011年士兰明芯收入与净利润
2005-2014年三安光电收入与毛利率
2009-2012年三安光电收入业务分布
三安光电各子公司2013年收入与净利润
2007-2014年国星光电收入与运营利润率
2007-2013年国星光电收入产品分布
2013年国星光电前5大客户
2013年国星光电前5大供应商
2004-2014年AXT收入与运营利润率
2006-2013年AXT收入产品分布
2006-2014年AXT收入地域分布
2007-2014年乾照光电收入与运营利润
2010-2013年乾照光电Epitaxy收入与毛利率
2013年乾照光电主要子公司财务数据
2013年德豪润达主要子公司财务数据
2014年上半年德豪润达主要子公司财务数据
2009-2014年华灿光电收入与运营利润
2008-2014年木林森收入与营业利润率
2008-2014年木林森出货量
FY2004-FY2015 CREE收入与运营利润率
FY2011-FY2014 CREE收入产品分布
FY2011-FY2014 CREE 产品毛利率
CREE全球分布
FY2009-FY2014 CREE收入地域分布
2008-2015财年丰田合成 收入与运营利润率
FY2008-FY2015丰田合成LED业务收入与运营利润率
2003-2014年日亚化学收入与运营利润率
2004-2013年日亚化学LED部门收入与运营利润率
2012年1季度-2014年2季度OSRAM季度收入与EBITA Margin
2012-2014年OSRAM收入部门分布
FY2014 OSRAM收入业务分布
FY2014 OSRAM收入地域分布
FY2014 OSRAM收入渠道分布
2012-2014年OSRAM EBITA部门分布
2012-2014年OSRAM收入地域分布
FY2013-FY2014 Osram Opto Semiconductors业务季度收入与EBITA
2011年4季度-2013年4季度飞利浦照明收入与EBITDA
2014年飞利浦照明收入业务分布
2014年H1飞利浦照明收入应用分布
2014年H1飞利浦照明收入地域分布
首尔半导体产品分布
2003-2014年首尔半导体收入与运营利润率
2011年1季度-2014年3季度首尔半导体季度收入
2011年1季度-2014年3季度首尔半导体季度毛利率
2011年1季度-2014年3季度首尔半导体季度营业利润率
2011年1季度-2014年3季度首尔半导体季度净利率
2012年1季度-2014年3季度首尔半导体收入下游应用分布
2006-2015年LG INNOTEK收入与运营利润率
2012年1季度-2014年4季度LG INNOTEK收入与运营利润率
2011-2015年LG INNOTEK 收入业务分布
2011-2015年LG INNOTEK 运营利润业务分布
2011年4季度-2014年3季度LG INNOTEK LED业务季度收入
2005-2012年三星LED收入
2010年三星LED收入下游应用
2007-2014年LUMENS收入与EBITDA率
2012-2014年Lumens收入下游应用
Global LED Market Size, 2008-2016E
Distribution of LED Market Size by Downstream Sector, 2013-2018E
Distribution of Global Lighting Market by Technology, 2009-2017E
LED Chips Volume of Lighting by Application, 2011-2016E
Policies on Lighting Energy Saving by Country
Price Trend of 40W and 60W LED Light Bulbs, May, 2012-Jan. 2014
ASP of LED Bulb in Japan, 2012-2014
Bulbs Sales Growth Rate in Japan, 2012-2014
Market Share of Major LED Lighting Manufacturers in Japan, 2013
Proportion of Large-sized BLU Applied, 2009-2015E
Global Mobile Phone Shipments, 2007-2014
Geographical Distribution of Global 3G/4G Mobile Phone Shipments, 2011-2014
Global Smartphone Sales to End Users by Vendor, 2013
Global Smartphone Sales to End Users by Operating System, 2013
Global Mobile Phone Sales to End Users by Vendor, 2013
Market Size of Global LED Automotive Lighting, 2010-2016E
Costs and Illuminance Trend of Five Automotive Light Sources, 2007-2014
LED Structure
LED Costs
COB Packaging
Sapphire Ingot Demand, 2012-2016E
Sapphire Ingot Demand Value, 2012-2016E
Capacity Trend of Major Global Sapphire Ingot Companies, 2012-2016E
Sapphire Ingot Price by Size, 2012-2016E
Sapphire Substrate Demand by Country, 2012-2016E
Sapphire Substrate Demand by Size, 2012-2016E
Revenue and Operating Margin of Rubicon Technology, 2005-2014
Production Flow of Rubicon Technology
Revenue Breakdown of Rubicon Technology by Region, 2009-2013
Revenue Breakdown of Rubicon Technology by Product, 2009-2013
Market Size of LED Front-end Equipment, 2009-2017E
Market Share of Major MOCVD Manufacturers,1999-2013
Global Presence of Aixtron
Revenue and EBIT Margin of Aixtron, 2003-2014
Aixtron’s Revenue\New Order\Backlog for Eight Successive Quarters
Aixtron’s Revenue by Application and Region, 2010
Aixtron’s Revenue by Application and Region in Q1-Q3, 2014
Aixtron’s Revenue by Application,1999-2013
VEECO’s Revenue and Operating Margin, 2004-2014
VEECO’s Revenue by Business, 2011-2013
VEECO’s Key Customers
VEECO’s Quarterly Orders by Application, 2013Q3-2014Q3
Distribution of Global LED Output Value by Region, 2013 & 2014
Operating Margin of Taiwanese LED Companies, 2012-2014
Organizational Structure of Everlight Electronics
Revenue and Operating Margin of Everlight Electronics, 2003-2014
Revenue Breakdown of Everlight Electronics by Product, 2008-2011
Revenue Breakdown of Everlight Electronics by Product, 2012-2015E
Revenue Breakdown of Everlight Electronics by Application, 2005-2015E
Capacity and Capacity Utilization of Everlight Electronics, 2013-2014
Monthly Revenue and Growth Rate of Everlight Electronics, Dec. 2012-Dec. 2014
Quarterly Revenue and Inventory of Everlight Electronics, 2011Q4-2014Q3
Quarterly Debt Ratio of Everlight Electronics, 2011Q4-2013Q4
Organizational Structure of Epistar
Revenue and Operating Margin of Epistar, 2004-2014
Monthly Revenue and Growth Rate of Epistar, Dec. 2012-Dec. 2014
Revenue Breakdown of Epistar by Application, 2012-2015E
Revenue Breakdown of Epistar by Product, 2012-2015E
R&D Capabilities of Epistar
Revenue Breakdown of Epistar by Customer, 2012
Revenue and Gross Margin of Genesis Photonics, 2003-2014
Revenue and Operating Margin of Genesis Photonics, 2003-2014
Monthly Revenue of Genesis Photonics, Dec. 2012-Dec. 2014
Revenue and Operating Margin of Formosa Epitaxy, 2002-2014
Monthly Revenue and Growth Rate of Formosa Epitaxy, Dec. 2012-Dec. 2014
Revenue Breakdown of Formosa Epitaxy by Product, 2009-2013
Capacity of Formosa Epitaxy, 2012-2013
Revenue and Operating Margin of Bright LED Electronics, 2002-2014
Monthly Revenue and Growth Rate of Bright LED Electronics, Dec. 2012-Dec. 2014
Revenue and Gross Margin of Opto Tech, 2004-2014
Revenue and Operating Margin of Opto Tech, 2008-2014
Monthly Revenue of Opto Tech, Dec. 2012-Dec. 2014
Revenue Breakdown of Opto Tech by Product, 2008-2013
Revenue Breakdown of Opto Tech (Except System Products) by Region, 2013-Q1/2014
Opto Tech’s Revenue from System Products by Region, 2013-Q1/2014
Revenue and Operating Margin of Harvatek, 2000-2014
Monthly Revenue of Harvatek, Dec. 2012-Dec. 2014
Revenue and Gross Margin of Tekcore, 2005-2014
Revenue and Operating Margin of Tekcore, 2008-2014
Monthly Revenue and Growth Rate of Tekcore, Dec. 2012-Dec. 2014
Revenue and Operating Margin of Unity Opto, 2004-2014
Monthly Revenue and Growth Rate of Unity Opto, Dec. 2012-Dec. 2014
Revenue and Operating Income of Huga Optotech, 2004-2012
Monthly Revenue and Growth Rate of Huga Optotech, May, 2010-May, 2012
Revenue and Operating Margin of Lextar Electronics, 2009-2014
Monthly Revenue and Growth Rate of Lextar Electronics, Dec. 2012-Dec. 2014
Organizational Structure of Tyntek
Revenue and Operating Margin of Tyntek, 2004-2014
Monthly Revenue and Growth Rate of Tyntek, Dec. 2012-Dec. 2014
Revenue and Operating Margin of Edison Opto, 2006-2014
Monthly Revenue and Growth Rate of Edison Opto, Dec. 2012-Dec. 2014
Revenue and Gross Margin of AOT, 2010-2014
AOT’s Monthly Revenue, Dec. 2012-Dec. 2014
AOT’s Key Customers
AOT’s Revenue Breakdown by Application, 2013Q1-2014Q3
AOT’s Technology Roadmap
Revenue and Net Income of Epiligh Technology, 2008-2012
Revenue and Operating Margin of Silan Microelectronics, 2006-2014
Revenue and Net Income of Silan Azure, 2007-2011
Revenue and Gross Margin of Sanan Optoelectronics, 2005-2014
Revenue Breakdown of Sanan Optoelectronics by Business, 2009-2012
Revenue and Net Income of Sanan Optoelectronics’ Subsidiaries, 2013
Revenue and Operating Margin of Nationstar Optoelectronics, 2007-2014
Revenue Breakdown of Nationstar Optoelectronics by Product, 2007-2013
Top 5 Customers of Nationstar Optoelectronics, 2013
Top 5 Suppliers of Nationstar Optoelectronics, 2013
Revenue and Operating Margin of AXT, 2004-2014
AXT’s Revenue by Product, 2006-2013
AXT’s Revenue by Region, 2006-2014
Revenue and Operating Income of Xiamen Changelight, 2007-2014
Epitaxy Revenue and Gross Margin of Xiamen Changelight, 2010-2013
Financial Data of Xiamen Changelight’s Key Subsidiaries, 2013
Financial Data of Elec-tech International’s Key Subsidiaries, 2013
Financial Data of Elec-tech International’s Key Subsidiaries, 2014H1
Revenue and Operating Income of HC SemiTek, 2009-2014
MLS’ Revenue and Operating Margin, 2008-2014
MLS’ Shipments, 2008-2014
Revenue and Operating Margin of Cree, FY2004-FY2015
Cree’s Revenue Breakdown by Product, FY2011-FY2014
Gross Margin of Cree by Product, FY2011-FY2014
Cree’s Presence Worldwide
Cree’s Revenue Breakdown by Region, FY2009-FY2014
Revenue and Operating Margin of Toyoda Gosei, FY2008-FY2015
LED Revenue and Operating Margin of Toyoda Gosei, FY2008-FY2015
Revenue and Operating Margin of Nichia, 2003-2014
LED Revenue and Operating Margin of Nichia, 2004-2013
Quarterly Revenue and EBITA Margin of OSRAM, 2012Q1-2014Q2
OSRAM’s Revenue Breakdown by Segment, 2012-2014
OSRAM’s Revenue Breakdown by Business, FY2014
OSRAM’s Revenue Breakdown by Region, FY2014
OSRAM’s Revenue Breakdown by Channel, FY2014
EBITA of OSRAM by Segment, 2012-2014
OSRAM’s Revenue Breakdown by Region, 2012-2014
Revenue and EBITDA of Philips Lumileds Lighting, 2011Q4-2013Q4
Revenue Breakdown of Philips Lumileds Lighting by Business, 2014
Revenue Breakdown of Philips Lumileds Lighting by Application, 2014H1
Revenue Breakdown of Philips Lumileds Lighting by Region, 2014H1
Product Distribution of Seoul Semiconductor
Revenue and Operating Margin of Seoul Semiconductor, 2003-2014
Quarterly Revenue of Seoul Semiconductor, 2011Q1-2014Q3
Gross Margin of Seoul Semiconductor, 2011Q1-2014Q3
Operating Margin of Seoul Semiconductor, 2011Q1-2014Q3
Net Profit Margin of Seoul Semiconductor, 2011Q1-2014Q3
Revenue Breakdown of Seoul Semiconductor by Application, 2011Q1-2014Q3
Revenue and Operating Margin of LG Innotek, 2006-2015
Revenue and Operating Margin of LG Innotek, 2012Q1-2014Q4
Revenue Breakdown of LG Innotek by Business, 2011-2015
Operating Income of LG Innotek by Business, 2011-2015
Quarterly LED Revenue of LG Innotek, 2011Q4-2014Q3
Samsung’s LED Revenue, 2005-2012
Samsung’s LED Revenue by Application, 2010
Revenue and EBITDA Margin of Lumens Digital Optics, 2007-2014
Lumens’ Revenue Breakdown by Application, 2012-2014
如果这份报告不能满足您的要求,我们还可以为您定制报告,请 留言说明您的详细需求。
|