|
|
|
报告导航:研究报告—
制造业—工业机械
|
|
2014-2018年全球及中国风电变流器行业研究报告 |
 |
字数:3.4万 |
页数:101 |
图表数:116 |
|
中文电子版:8500元 |
中文纸版:4250元 |
中文(电子+纸)版:9000元 |
|
英文电子版:2200美元 |
英文纸版:2300美元 |
英文(电子+纸)版:2500美元 |
|
编号:ZHP018
|
发布日期:2015-02 |
附件:下载 |
 |
|
|
风电变流器是风力发电机组的关键部件之一,占风力发电设备自动化产品成本的17.9%。具有优化风电系统运行、改善风机效率、减少发电损耗、提升风能利用率等优点。
2014年全球新增风电装机容量为47.3GW,同比增长33.9%;其中,中国新增17.7GW,同比增长9.6%,已经连续5年位居全球第一。
在海上风电正式重启(2013年8月)以及国家支持风电产业发展政策的带动下,2014年中国风电变流器行业产值已达到58亿元,同比增长11.5%; 需求量10,727套,同比增长14.7%。
目前,市场上应用最广泛的是1.5MW和2MW的风电变流器,合计需求占比已超过80%。未来,随着海上风电的发展,5MW-10MW的风电变流器将会成为业内企业的主要研发对象。
由于中国风电产业起步较晚,国内风电变流器市场份额主要被ABB、Emerson、西门子等外资企业垄断,而阳光电源、海得控制、南车时代电气等内资企业仅占到5%左右的份额。
ABB:2014年推出适应中国本地环境的陆上和海上风电机组用新款空冷型双馈风电变流器,功率等级覆盖1.5MW-2.2MW。
Emerson:2014年10月,WinTrust系列2MW双馈风电变流器(风冷)产品中标云南华电大黑山项目;2015年1月,WinTrust系列2MW双馈风电变流器(水冷)产品中标华电安徽无为项目。
阳光电源:2014年初,完成年产60万千瓦风电变流器技术改造项目,包括全功率风电变流器产能40万千瓦/年、双馈风电变流器产能20万千瓦/年;2014年10月,推出针对≥5MW海上风力发电机组的全功率风电变流器。
海得控制:近几年积极进行风电变流器的研发。2014年成功研发出WINGREEN 5.5MW高压大功率海上风电变流器;2015年将研发3.0MW全功率液冷风电变流器。
水清木华研究中心《2014-2018年全球及中国风电变流器行业研究报告》着重研究了以下内容:
 全球风电变流器市场现状、竞争格局等; 全球风电变流器市场现状、竞争格局等;
中国风电变流器行业发展环境、市场规模、竞争格局等;
全球及中国IGBT、继电器等市场规模、竞争格局等;
全球及中国风电装机市场规模、市场结构、进出口、竞争格局等;
国外8家风电变流器生产商经营情况、营收结构、在华布局等;
中国16家风电变流器生产商经营情况、营收结构、竞争优势等。
As one of key components of a wind generating set, the wind power converter accounts for 17.9% of costs of wind power equipment automation products. It can optimize the operation of wind power system, improve the efficiency of wind turbine, reduce power loss, and raise utilization of wind energy.
In 2014, the global installed wind power capacity increased by 47.3GW, up 33.9% from a year earlier. In particular, China contributed 17.7GW, a 9.6% rise year on year, ranking the world's first for five consecutive years.
Driven by the resumption of offshore wind power projects in August 2013 and the State's support for wind power industry, the output value of China's wind power converter industry amounted to RMB5.8 billion in 2014, up 11.5% from a year earlier. The demand was 10,727 sets, rising by 14.7%, year on year.
At present, the 1.5MW and 2MW wind power converters are widely used in the market, with the total demand for both accounting for more than 80%. In the future, as offshore wind power expands, the industry's R&D focus will be shifted to 5MW-10MW wind power converters.
Now that China's wind power industry started relatively late, the domestic wind power converter market was monopolized by the foreign players like ABB, Emerson, and Siemens. In contrast, the Chinese enterprises such as Sungrow Power Supply, Hi-Tech Control, Zhuzhou CSR Times Electric occupied a mere 5% market share.
ABB: In 2014, the company released a new air cooled doubly-fed wind power converter, targeting China's onshore and offshore utility-scale wind turbines, with the power range of 1.5MW-2.2MW.
Emerson: In October 2014, WinTrust series 2MW doubly-fed wind power converter (air cooled) products won the bid for the Yunnan Huadian's Daheishan Project; in January 2015, WinTrust series 2MW doubly-fed wind power converter (water cooled) products won the tender for Huadian Anhui's Wuwei Project.
Sungrow Power Supply: in early 2014, the company completed a 600,000 kw/a wind power converter technological transformation project, including a 400,000 kw/a full-power wind power converter capacity and 200,000 kw/a doubly-fed wind power converter; in October 2014, the company launched a full-power wind power converter for the ≥5MW offshore wind power turbine unit.
Hi-Tech Control: In recent years, the company has aggressively developed wind power converters. In 2014, it developed 5.5MW WINGREEN high-voltage high-power offshore wind power converter; in 2015, it will develop 3.0MW full power (liquid cooled) wind power converter.
Global and China Wind Power Converter Industry Report, 2014-2018 by ResearchInChina is primarily concerned with the following:
 Status quo and competitive landscape, etc. of global wind power converter market; Status quo and competitive landscape, etc. of global wind power converter market;
Development environment, market size, competitive landscape, etc. of China's wind power converter industry;
Market size and competition pattern, etc. of IGBT and relay, etc. in China and the World;
Market size, market structure, imports and exports, competition pattern, etc. of installed wind power in China and the World;
Operation and revenue structure of 8 foreign wind power converter manufacturers and their layout in China;
Operation, revenue structure, competitive edges, etc. of 16 Chinese wind power converter manufacturers.
第一章 风电变流器行业概述
1.1 定义
1.2 分类及应用
1.3 工艺流程
1.4 发展趋势
第二章 全球风电变流器行业现状
2.1 市场现状
2.2 竞争格局
第三章 中国风电变流器行业现状
3.1 发展环境
3.1.1 行业环境
3.1.2 政策环境
3.2 市场规模
3.2.1 产值
3.2.2 需求
3.3 竞争格局
第四章 原材料市场现状
4.1 原材料构成
4.2 IGBT市场分析
4.2.1 市场规模
4.2.2 竞争格局
4.3 继电器市场分析
4.3.1 市场规模
4.3.2 市场构成
4.3.2.1 汽车继电器
4.3.2.2 电力继电器
4.3.3 竞争格局
第五章 风电装机市场现状
5.1 风电装机容量
5.1.1 全球
5.1.2 中国
5.2 市场构成
5.3 进出口
5.3.1 进口
5.3.2 出口
5.4 竞争格局
第六章 全球主要风电变流器企业
6.1 ABB
6.1.1 公司简介
6.1.2 经营情况
6.1.3 营收构成
6.1.4 在华业务
6.2 AMSC
6.2.1 公司简介
6.2.2 经营情况
6.2.3 营收构成
6.2.4 在华业务
6.3 西门子
6.3.1 公司简介
6.3.2 经营情况
6.3.3 营收构成
6.3.4 在华业务
6.4 Emerson
6.4.1 公司简介
6.4.2 经营情况
6.4.3 营收构成
6.4.4 在华业务
6.5 Vacon
6.5.1 公司简介
6.5.2 经营情况
6.5.3 营收构成
6.5.4 在华业务
6.6 Schneider
6.6.1 公司简介
6.6.2 经营情况
6.6.3 营收构成
6.6.4 在华业务
6.7 GE Power Conversion
6.7.1 公司简介
6.7.2 风电变流器业务
6.7.3 在华业务
6.8 斯维奇
第七章 中国重点风电变流器企业
7.1 阳光电源
7.1.1 公司简介
7.1.2 经营情况
7.1.3 营收构成
7.1.4 毛利率
7.1.5 风电变流器业务
7.2 九洲电气
7.2.1 公司简介
7.2.2 经营情况
7.2.3 营收构成
7.2.4 毛利率
7.2.5 风电变流器业务
7.3 荣信股份
7.3.1 公司简介
7.3.2 经营情况
7.3.3 营收构成
7.3.4 毛利率
7.3.5 风电变流器业务
7.4 龙源电力
7.4.1 公司简介
7.4.2 经营情况
7.4.3 营收构成
7.4.4 毛利率
7.4.5 风电变流器业务
7.5 海得控制
7.5.1 公司简介
7.5.2 经营情况
7.5.3 营收构成
7.5.4 毛利率
7.5.5 风电变流器业务
7.6 南车时代电气
7.6.1 公司简介
7.6.2 经营情况
7.6.3 营收构成
7.6.4 毛利率
7.6.5 风电变流器业务
7.7 科陆电子
7.7.1 公司简介
7.7.2 经营情况
7.7.3 营收构成
7.7.4 毛利率
7.7.5 风电变流器业务
7.8 禾望电气
7.8.1 公司简介
7.8.2 风电变流器业务
7.9 科诺伟业
7.9.1 公司简介
7.9.2 风电变流器业务
7.10 其他
7.10.1 清能华福
7.10.2 江苏大全
7.10.3 北京能高
7.10.4 许继集团
7.10.5 山东新风光
7.10.6 东方日立
7.10.7 日风电气
第八章 总结与预测
8.1 市场
8.2 企业
1 Overview of Wind Power Converter
1.1 Definition
1.2 Classification and Application
1.3 Process Flow
1.4 Development Trend
2 Global Wind Power Converter Industry
2.1 Current Market
2.2 Competition Pattern
3 China Wind Power Converter Industry
3.1 Development Environment
3.1.1 Industrial Environment
3.1.2 Policy Climate
3.2 Market Size
3.2.1 Output Value
3.2.2 Demand
3.3 Competition Pattern
4 Raw Materials Market
4.1 Composition of Raw Materials
4.2 IGBT
4.2.1 Market Size
4.2.2 Competition Pattern
4.3 Relay
4.3.1 Market Size
4.3.2 Market Structure
4.3.2.1 Automotive Relay
4.3.2.2 Power Relay
4.3.3 Competition Pattern
5 Wind Power Installation Market
5.1 Installed Capacity of Wind Power
5.1.1 Global
5.1.2 China
5.2 Market Structure
5.3 Import and Export
5.3.1 Import
5.3.2 Export
5.4 Competition Pattern
6 World’ Major Windpower Converter Companies
6.1 ABB
6.1.1 Profile
6.1.2 Operation
6.1.3 Revenue Structure
6.1.4 Business in China
6.2 AMSC
6.2.1 Profile
6.2.2 Operation
6.2.3 Revenue Structure
6.2.4 Business In China
6.3 Siemens
6.3.1 Profile
6.3.2 Operation
6.3.3 Revenue Structure
6.3.4 Business in China
6.4 Emerson
6.4.1 Profile
6.4.2 Operation
6.4.3 Revenue Structure
6.4.4 Business in China
6.5 Vacon
6.5.1 Profile
6.5.2 Operation
6.5.3 Revenue Structure
6.5.4 Business in China
6.6 Schneider
6.6.1 Profile
6.6.2 Operation
6.6.3 Revenue Structure
6.6.4 Business in China
6.7 GE Power Conversion
6.7.1 Profile
6.7.2 Windpower Converter Business
6.7.3 Business in China
6.8 The Switch
7 Key Chinese Windpower Converter Enterprises
7.1 Sungrow Power Supply Co., Ltd.
7.1.1 Profile
7.1.2 Operation
7.1.3 Revenue Structure
7.1.4 Gross Margin
7.1.5 Windpower Converter Business
7.2 Harbin Jiuzhou Electrical Co., Ltd.
7.2.1 Profile
7.2.2 Operation
7.2.3 Revenue Structure
7.2.4 Gross Margin
7.2.5 Windpower Converter Business
7.3 Rongxin Power Electronic Co., Ltd.
7.3.1 Profile
7.3.2 Operation
7.3.3 Revenue Structure
7.3.4 Gross Margin
7.3.5 Windpower Converter Business
7.4 China Longyuan Power Group Co., Ltd.
7.4.1 Profile
7.4.2 Operation
7.4.3 Revenue Structure
7.4.4 Gross Margin
7.4.5 Windpower Converter Business
7.5 Shanghai Hi-tech Control System Co., Ltd.
7.5.1 Profile
7.5.2 Operation
7.5.3 Revenue Structure
7.5.4 Gross Margin
7.5.5 Windpower Converter Business
7.6 Zhuzhou CSR Times Electric Co., Ltd.
7.6.1 Profile
7.6.2 Operation
7.6.3 Revenue Structure
7.6.4 Gross Margin
7.6.5 Windpower Converter Business
7.7 Shenzhen Clou Electronics Co., Ltd.
7.7.1 Profile
7.7.2 Operation
7.7.3 Revenue Structure
7.7.4 Gross Margin
7.7.5 Windpower Converter Business
7.8 Shenzhen Hopewind Electric Co., Ltd.
7.8.1 Profile
7.8.2 Windpower Converter Business
7.9 Corona
7.9.1 Profile
7.9.2 Windpower Converter Business
7.10 Others
7.10.1 Beijing Qingneng Harvest Wind Power Technology
7.10.2 Daqo Group
7.10.3 Beijing Nego Automation Technology
7.10.4 Xuji Group Corporation
7.10.5 Shandong Xinfengguang Electronic Technology Development
7.10.6 Dongfang Hitachi
7.10.7 HRV Electric
8 Summary and Forecast
8.1 Market
8.2 Enterprise
表:风电变流器应用
图:双馈风电变流器应用示意图
图:全功率风电变流器应用示意图
图:风电变流器工艺流程图
图:风力发电设备自动化产品成本结构
图:2008-2018年全球风电变流器市场容量
表:主要国外风电变流器生产商
表:全球主要风电变流器厂商供应体系
图:2014年中国(分类别)发电量构成
图:2015年中国风电项目分部
图:中国有效风功率密度分布
表:2006-2014年中国风电变流器法律法规及政策
图:2008-2018年中国风电变流器行业产值
图:2006-2018年中国风电变流器需求量
图:2013年中国风电变流器(分类别)需求量构成
图:2013年中国风电变流器市场份额
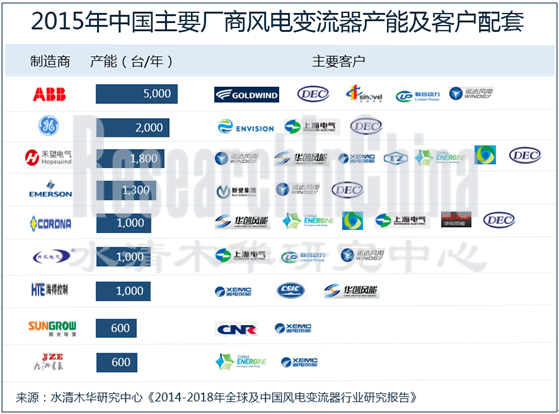
表:2014年中国主要风电变流器各厂商产能
表:风电变流器主要原材料
图:2013年风电变流器成本构成
图:2008-2018年全球IGBT市场规模
图:2011-2018年全球IGBT应用结构
图:各种功率元件的应用
图:中国主要IGBT制造商
图:2006-2016年全球继电器市场规模及增速
图:2006-2016年中国继电器市场规模及增速
图:2013年全球继电器(分行业)市场构成
图:2013年中国继电器(分行业)市场构成
图:2010-2016年中国汽车继电器销售额
图:2011-2016年全球及中国电力继电器销售额
图:2013年中国继电器市场份额
图:2006-2018年全球风电装机容量
图:2014年全球(分地区)风电装机容量构成
图:2020/2030年全球风电市场规划
图:2006-2018年中国风电装机容量
图:2013年中国(分地区)风电装机容量构成
表:2015年出中国拟/在建海上风电项目
图:2014年中国风机整机机型市场份额
图:2012-2014年中国风电机组进口情况
图:2007-2014年中国风电机组出口情况
表:2013年中国风电机组(分企业)出口情况
表:2013年中国风电装机市场份额
图:2009-2014年ABB营业收入及净利润
图:2013-2014年ABB(分业务)营业收入构成
图:截至2013年ABB在中国业务分布
图:2009-2014财年AMSC营业收入及净利润
表:2012-2014财年AMSC(分业务)营业收入
表:2011-2013财年AMSC(分地区)营业收入
图:2013-2014财年Siemens员工数量
图:2009-2014财年Siemens营业收入及净利润
图:2013-2014财年Siemens(分地区)营业收入
图:2012-2013财年Siemens(分地区)订单额与营业收入
图:2009-2014财年西门子中国区营业收入及增幅
图:2009-2014财年Emerson销售额及净利润
图:2013-2014财年Emerson(分产品)销售额构成
图:2014财年Emerson(分地区)销售额构成
图:2006-2014财年艾默生在华销售额及增速
图:艾默生网络能源在华生产基地
图:伟肯全球营销网络
图:2009-2014年Vacon营业收入及营业利润
图:2013-2014年Vacon(分渠道)营业收入构成
表:2011-2014年Vacon(分地区)营业收入
图:Vacon在华布局
图:Vacon风电变流器电路图
图:2009-2014年Schneider营业收入及净利润
图:2013-2014年Schneider(分业务)营业收入构成
图:2013-2014年Schneider(分地区)营业收入构成
图:2009-2013年Schneider中国区营业收入及增速
图:Power Conversion全球业务分部
图:2014年阳光电源股权结构
图:2010-2014年阳光电源营业收入及净利润
图:2011-2014年阳光电源(分产品)营业收入构成
表:2011-2014年阳光电源(分地区)主营业务收入
表:2011-2014年阳光电源(分产品)毛利率
图:2011-2014年阳光电源风电变流器收入及出货量
图:2014年九洲电气股权结构
图:2009-2014年九洲电气营业收入及净利润
图:2011-2014年九洲电气(分产品)主营业务收入构成
表:2011-2014年九洲电气(分地区)主营业务收入
表:2011-2014年九洲电气(分产品)毛利率
图:2014年荣信股份股权结构
图:2009-2014年荣信股份营业收入及净利润
图:2011-2014荣信股份(分产品)营业收入构成
表:2011-2014荣信股份(分地区)主营业务收入
表:2011-2014年荣信股份(分产品)毛利率
图:2014年龙源电力股权结构
图:截止2014年6月龙源电力(分地区)装机容量构成
图:2009-2014年龙源电力营业收入及净利润
图:2013-2014年龙源电力(分业务)营业收入构成
图:2009-2014年龙源电力毛利率
图:2014年海得控制股权结构
图:2009-2014年海得控制营业收入及净利润
图:2011-2014年海得控制(分产品)主营业务收入
表:2012-2014年海得控制(分地区)主营业务收入
表:2011-2014年海得控制(分产品)毛利率
表:2012-2014年海得控制(分地区)毛利率
图:2014年南车时代电气股权结构
图:2009-2014年南车时代电气营业收入及净利润
表:2011-2013南车时代电气(分产品)营业收入
图:2009-2014年南车时代电气毛利率
图:2014年科陆电子股权结构
图:2009-2014年科陆电子营业收入及净利润
图:2012-2014年科陆电子(分产品)营业收入
表:2011-2014年科陆电子(分地区)主营业务收入
图:2009-2014年科陆电子毛利率
图:2014年禾望电气股权结构
图:截止2014年底禾望电气已完成风电项目
表:截止2014年底科诺伟业已完成风电项目
图:2014年江苏大全股权结构
图:2009-2014年大全集团销售收入
图:2014年北京能高股权结构
表:2014年北京能高风电变流器产品
图:2014年东方日立股权结构
图:日风电气主要项目分布
图:2006-2018年中国风电装机量全球占比
图:2007-2018年中国风电变流器需求增速
图:2010-2014年全球主要风电变流器厂商营收增速
Application of Wind Power Converter
Schematic Diagram of Double-fed Wind Power Converter Applied
Schematic Diagram of Full-power Wind Power Converter Applied
Process Flow of Wind Power Converter
Cost Structure of Automated Products of Wind Power Generation Equipment
Global Wind Power Converter Market Capacity, 2008-2018E
Leading Overseas Producers of Wind Power Converter
Supply System of World’s Major Windpower Converter Manufacturers
Power Generation Structure (by Type) in China, 2014
Distribution of China’s Wind Power Projects, 2015
Distribution of Effective Wind Power Density in China
Laws & Regulations and Policies on Wind Power Converter in China, 2006-2014
Output Value of China Wind Power Converter Industry, 2008-2018E
Demand for Wind Power Converter in China, 2006-2018E
Structure of the Demand for Wind Power Converter (by Type) in China, 2013
China Wind Power Converter Market Share, 2013
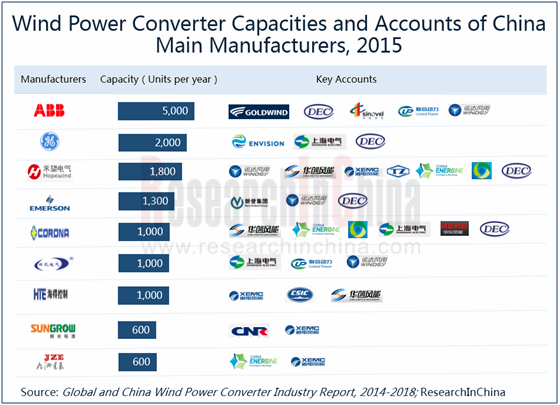
Capacities of Leading Windpower Converter Manufacturers in China, 2014
Key Raw Materials for Wind Power Converter
Cost Structure of Wind Power Converter, 2013
Global IGBT Market Size, 2008-2018E
Global IGBT Application Structure, 2011-2018E
Application of Various Power Components
Influential IGBT Manufacturers in China
Global Relay Market Size and Growth Rate, 2006-2016E
China Relay Market Size and Growth Rate, 2006-2016E
Global Relay Market Structure (by Sector), 2013
China Relay Market Structure (by Sector), 2013
Automotive Relay Sales in China, 2010-2016E
Global and China’s Sales of Power Relay, 2011-2016E
China Relay Market Share, 2013
Global Installed Capacity of Wind Power, 2006-2018E
Wind Power Installed Capacity Structure (by Region) Worldwide, 2014
Global Wind Power Market Planning, 2020/2030
Wind Power Installed Capacity in China, 2006-2018E
Structure of Wind Power Installed Capacity (by Region) in China, 2013
Proposed/Ongoing Offshore Wind Power Generation Projects in China, 2015
Market Shares of Wind Turbine Models in China, 2014
China’s Import of Wind Power Generating Units, 2012-2014
Export of Wind Power Generating Units from China, 2007-2014
Export of Wind Power Generating Units (by Enterprise) from China, 2013
China’s Wind Power Installation Market Share, 2013
Revenue and Net Income of ABB, 2009-2014
Revenue Structure of ABB (by Business), 2013-2014
Business Distribution of ABB in China as of 2013
Revenue and Net Income of AMSC, FY2009-FY2014
Revenue of AMSC (by Business), FY2012-FY2014
Revenue of AMSC (by Region), FY2011-FY2013
Number of Employees of Siemens, FY2013-FY2014
Revenue and Net Income of Siemens, FY2009-FY2014
Revenue of Siemens (by Region), FY2013-FY2014
Orders and Revenue of Siemens (by Region), FY2012-FY2013
Revenue and Growth Rate of Siemens in China, FY2009-FY2014
Revenue and Net Income of Emerson, FY2009-FY2014
Revenue Structure of Emerson (by Product), FY2013-FY2014
Revenue Structure of Emerson (by Region), FY2014
Revenue and Growth Rate of Emerson in China, FY2006-FY2014
Production Bases of Emerson Network Power in China
Global Marketing Network of Vacon
Revenue and Operating Income of Vacon, 2009-2014
Revenue Structure of Vacon (by Channel), 2013-2014
Revenue Breakdown of Vacon (by Region), 2011-2014
Vacon’s Layout in China
Windpower Converter Circuit Diagram of Vacon
Revenue and Net Income of Schneider, 2009-2014
Revenue Structure of Schneider (by Business), 2013-2014
Revenue Structure of Schneider (by Region), 2013-2014
Revenue and Growth Rate of Schneider in China, 2009-2013
Global Distribution of Schneider’s Power Conversion Business
Equity Structure of Sungrow Power Supply, 2014
Revenue and Net Income of Sungrow Power Supply, 2010-2014
Revenue Structure of Sungrow Power Supply (by Product), 2011-2014
Operating Revenue of Sungrow Power Supply (by Region), 2011-2014
Gross Margin of Sungrow Power Supply (by Product), 2011-2014
Revenue from and Shipment of Wind Power Converters of Sungrow Power Supply, 2011-2014
Equity Structure of Harbin Jiuzhou Electric, 2014
Revenue and Net Income of Harbin Jiuzhou Electrical, 2009-2014
Operating Revenue Structure of Harbin Jiuzhou Electrical (by Product), 2011-2014
Operating Revenue of Harbin Jiuzhou Electrical (by Region), 2011-2014
Gross Margin of Harbin Jiuzhou Electrical (by Product), 2011-2014
Equity Structure of Rongxin Power Electronic, 2014
Revenue and Net Income of Rongxin Power Electronic, 2009-2014
Revenue Structure of Rongxin Power Electronic (by Product), 2011-2014
Operating Revenue of Rongxin Power Electronic (by Region), 2011-2014
Gross Margin of Rongxin Power Electronic (by Product), 2011-2014
Equity Structure of China Longyuan Power Group, 2014
Installed Capacity Structure of China Longyuan Power Group as of June 2014
Revenue and Net Income of China Longyuan Power Group, 2009-2014
Revenue Structure of China Longyuan Power Group (by Business), 2013-2014
Gross Margin of China Longyuan Power Group, 2009-2014
Equity Structure of Shanghai Hi-tech Control System, 2014
Revenue and Net Income of Shanghai Hi-tech Control System, 2009-2014
Operating Revenue of Shanghai Hi-tech Control System (by Product), 2011-2014
Operating Revenue of Shanghai Hi-tech Control System (by Region), 2012-2014
Gross Margin of Shanghai Hi-tech Control System (by Product), 2011-2014
Gross Margin of Shanghai Hi-tech Control System (by Region), 2012-2014
Equity Structure of Zhuzhou CSR Times Electric, 2014
Revenue and Net Income of Zhuzhou CSR Times Electric, 2009-2014
Revenue of Zhuzhou CSR Times Electric (by Product), 2011-2013
Gross Margin of Zhuzhou CSR Times Electric, 2009-2014
Equity Structure of Shenzhen Clou Electronics, 2014
Revenue and Net Income of Shenzhen Clou Electronics, 2009-2014
Revenue of Shenzhen Clou Electronics (by Product), 2012-2014
Operating Revenue of Shenzhen Clou Electronics (by Region), 2011-2014
Gross Margin of Shenzhen Clou Electronics, 2009-2014
Equity Structure of Shenzhen Hopewind Electric, 2014
Wind Power Projects Completed by Shenzhen Hopewind Electric by the End of 2014
Wind Power Projects Completed by Corona by the End of 2014
Equity Structure of Daqo Group, 2014
Revenue of Daqo Group, 2009-2014
Equity Structure of Beijing Nego Automation Technology, 2014
Windpower Converters of Beijing Nego Automation Technology, 2014
Equity Structure of Dongfang Hitachi, 2014
Distribution of HRV Electric’s Key Projects
Proportion of China’s Windpower Installed Capacity in Global Total, 2006-2018E
Growth Rate for the Demand for Windpower Converter in China, 2007-2018E
Revenue Growth Rates of World’s Major Windpower Converter Manufacturers, 2010-2014
如果这份报告不能满足您的要求,我们还可以为您定制报告,请 留言说明您的详细需求。
|