|
|
|
报告导航:研究报告—
制造业—材料
|
|
2014-2017年全球及中国锂电池负极材料行业研究报告 |
 |
字数:3.1万 |
页数:107 |
图表数:121 |
|
中文电子版:7500元 |
中文纸版:3750元 |
中文(电子+纸)版:8000元 |
|
英文电子版:2300美元 |
英文纸版:2450美元 |
英文(电子+纸)版:2600美元 |
|
编号:HK055
|
发布日期:2015-02 |
附件:下载 |
 |
|
|
锂电池主要由正极材料、负极材料、隔膜和电解液等构成,其中负极材料在锂离子电池中的成本占比为5%-15%,是锂电池的重要原材料之一。目前,全球锂电池负极材料仍然以天然石墨和人造石墨为主,2014年合计占比达85%左右;而新型材料如中间相炭微球(MCMB)、钛酸锂(LTO)等负极材料的产量也在快速增长。
2014年,全球锂电池负极材料总产量达7万吨左右,主要集中于中国和日本,两国占据全球负极材料销量的95%以上。全球新能源汽车的高速增长、4G时代来临加快了锂电池在通信/储能领域的应用,未来3年,负极材料需求量的增长速度仍将保持在15%以上。
全球负极材料行业集中度较高,生产企业主要包括日本的日立化成、JFE化学、三菱化学以及中国的贝特瑞、杉杉股份等,2014年这五家企业的市场份额之和达80%以上。其中人造石墨负极材料以日立化成、杉杉股份为主,天然石墨负极材料以贝特瑞、三菱化学为主,MCMB负极材料以JFE化学、杉杉股份为主。
中国石墨矿产资源丰富,在负极材料生产方面成本优势明显,2014年中国负极材料产量占全球总产量的70%左右。而随着中国企业负极材料生产技术的日益成熟,国产负极材料市场占有率将会继续上升。
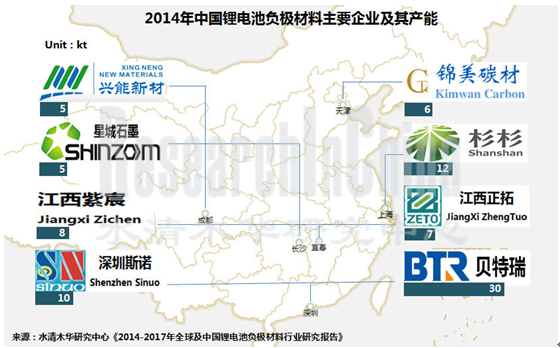
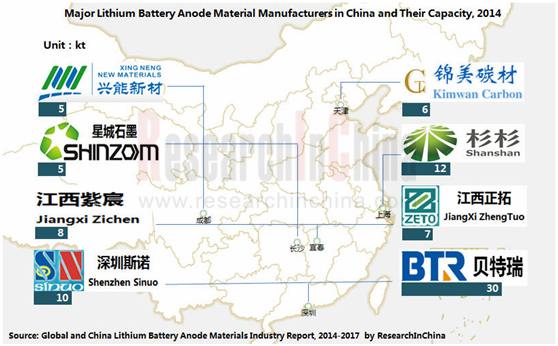
截止2014年底,中国从事锂电池负极材料生产的企业达50家以上,大部分是2010年之后新进入该行业。2014年中国锂电池负极材料产能前五的企业分别为贝特瑞、杉杉股份、深圳斯诺、江西紫宸和江西正拓,产能之和达6.7万吨。其中贝特瑞和杉杉股份在中国的市场占有率达60%左右。
近几年,由于电芯价格下滑及中国负极材料市场竞争加剧,中国负极材料市场价格和利润持续下滑,预计未来3年这一趋势仍将延续。这将导致部分缺乏资金和技术创新能力的中小企业经营困难,部分企业甚至会被并购或淘汰出局。
水清木华研究中心《2014-2017年全球及中国锂电池负极材料行业研究报告》主要包括以下几个内容:
 全球锂电池负极材料行业市场规模、竞争格局等; 全球锂电池负极材料行业市场规模、竞争格局等;
中国锂电池负极材料行业市场规模、竞争格局、价格走势及发展预测等;
全球及中国锂电池行业供需分析、竞争格局、上下游配套关系、发展预测等;
全球及中国15家负极材料生产企业经营状况、负极材料业务分析、发展预测等。
Lithium battery is composed mainly of cathode materials, anode materials, separator, and electrolyte, of which anode materials make up 5%-15% of lithium-ion battery costs, being one of important raw materials for lithium battery. Global lithium battery anode materials are now still dominated by natural graphite and artificial graphite, together accounting for roughly 85% in 2014. However, novel materials like mesocarbon microbeads (MCMB), lithium titanate (or lithium titanium oxide, LTO), and other anode materials see rapid growth in output.
In 2014, global lithium battery anode materials output totaled around 70,000 tons, concentrated in China and Japan, which together constituted over 95% of global anode materials sales volume. Rapid growth in global new energy vehicle market and accelerated application of lithium battery in communications and energy storage fields in the wake of the advent of 4G era will drive global demand for anode materials grow at a rate of more than 15% over the next three years.
Global anode materials industry is highly concentrated, with major manufacturers including Hitachi Chemical, JFE Chemical, Mitsubishi Chemical, BTR, and Ningbo Shanshan, which held a combined market share of over 80% in 2014, with Hitachi Chemical and Ningbo Shanshan specializing in artificial graphite anode materials, BTR and Mitsubishi Chemical in natural graphite anode materials, and JFE Chemical and Ningbo Shanshan in MCMB anode materials.
China abounds in graphite mineral resources, endowing the country with significant advantage in production costs of anode materials, and occupied 70% or so of global anode materials output in 2014. As anode materials production technologies of the Chinese companies become increasingly mature, home-made anode materials will gain more market shares.
As of the end of 2014, there were more than 50 producers of lithium battery anode materials in China, and most of them entered the field after 2010. In 2014, the top five lithium battery anode materials producers (by capacity) were BTR, Ningbo Shanshan, Shenzhen Sinuo Industrial Development, Jiangxi Zichen Technology, and Jiangxi Zhengtuo New Energy Technology, with their capacities totaling 67,000 tons, and BTR and Ningbo Shanshan taking approximately 60% of the Chinese market.
In recent years, due to falling cell price and fiercer competition in anode materials market in China, the prices and profits of anode materials in China continued to slide, and the trend is expected to last for the next three years. This will have small- and medium- sized enterprises lacking funds and technological innovation capabilities caught in deep waters, and even taken over or eliminated for some companies.
Global and China Lithium Battery Anode Materials Industry Report, 2014-2017 by ResearchInChina focuses on the following:
 Market size and competitive landscape of global lithium battery anode materials industry; Market size and competitive landscape of global lithium battery anode materials industry;
Market size, competitive landscape, price trend and development forecast of China lithium battery anode materials industry;
Supply & demand, competitive landscape, supporting relationship between upstream and downstream, development forecast of global and China lithium battery industry;
Operation, anode materials business, and development forecast of 15 global and Chinese anode materials producers.
第一章 锂电池负极材料概述
1.1 定义
1.2 产业链
1.3 产业政策
第二章 锂电池负极材料市场分析
2.1 全球市场
2.1.1 市场规模
2.1.2 竞争格局
2.2 中国市场
2.2.1 市场规模
2.2.2 竞争格局
2.2.3 价格走势
2.3 供应关系
2.4 其他负极材料
2.4.1 钛酸锂
2.4.2 硬碳
2.4.3 硅碳复合材料
第三章 锂电池行业分析
3.1 全球锂电池需求
3.1.1 普通3C锂电池需求
3.1.2 动力锂电池需求
3.1.3 锂电池出货量
3.1.4 锂电池市场规模
3.2 中国锂电池需求
3.2.1 普通3C锂电池需求
3.2.2 动力锂电池需求
3.2.3 锂电池出货量
3.2.4 锂电池市场规模
3.3 竞争格局
3.3.1 市场份额
3.3.2 动力电池厂商
3.3.3 配套关系
第四章 全球重点企业
4.1 日立化成
4.1.1 公司简介
4.1.2 经营情况
4.1.3 负极材料业务
4.1.4 在华业务
4.2 JFE化学
4.3 三菱化学控股集团
4.3.1 公司简介
4.3.2 经营情况
4.3.3 负极材料业务
4.4 日本吴羽
4.4.1 公司简介
4.4.2 经营情况
4.4.3 先进材料部门经营情况
4.4.4 负极材料业务
第五章 中国重点企业
5.1 中国宝安
5.1.1 公司简介
5.1.2 经营状况
5.1.3 营收构成
5.1.4 毛利率
5.1.5 研发
5.1.6 客户及供应商
5.1.7 负极材料业务
5.1.8 预测与展望
5.2 杉杉股份
5.2.1 公司简介
5.2.2 经营状况
5.2.3 营收构成
5.2.4 毛利率
5.2.5 研发
5.2.6 负极材料业务
5.2.7 预测与展望
5.3 当升科技
5.3.1 公司简介
5.3.2 经营状况
5.3.3 星城石墨
5.4 中科英华
5.4.1 公司简介
5.4.2 经营状况
5.4.3 营收构成
5.4.4 毛利率
5.4.5 研发
5.4.6 湖州创亚
5.5 江西正拓
5.5.1 公司简介
5.5.2 经营情况
5.5.3 营收构成
5.5.4 毛利率
5.5.5 研发
5.5.6 客户及供应商
5.5.7 销售价格
5.6 其他企业
5.6.1 江西紫宸
5.6.2 深圳斯诺
5.6.3 摩根海容
5.6.4 成都兴能
5.6.5 天津锦美
5.6.6 大连宏光
第六章 总结与预测
6.1 总结
6.2 发展预测
1. Overview of Lithium Battery Anode Materials
1.1 Definition
1.2 Industrial Chain
1.3 Industrial Policy
2. Lithium Battery Anode Materials Market
2.1 Global
2.1.1 Market Size
2.1.2 Competitive Landscape
2.2 China
2.2.1 Market Size
2.2.2 Competitive Landscape
2.2.3 Price Trend
2.3 Supply Relationship
2.4 Other Anode Materials
2.4.1 Lithium Titanate
2.4.2 Hard Carbon
2.4.3 Si/C Composites
3. Lithium Batter Industry
3.1 Global Demand for Lithium Battery
3.1.1 Demand for Common 3C Lithium Battery
3.1.2 Demand for Power Lithium Battery
3.1.3 Lithium Battery Shipments
3.1.4 Lithium Battery Market Size
3.2 China’s Demand for Lithium Battery
3.2.1 Demand for Common 3C Lithium Battery
3.2.2 Demand for Power Lithium Battery
3.2.3 Lithium Battery Shipments
3.2.4 Lithium Battery Market Size
3.3 Competitive Landscape
3.3.1 Market Share
3.3.2 Power Battery Manufacturers
3.3.3 Supporting Relationship
4. Major Global Companies
4.1 Hitachi Chemical Co., Ltd.
4.1.1 Profile
4.1.2 Operation
4.1.3 Anode Materials Business
4.1.4 Business in China
4.2 JFE Chemical
4.3 Mitsubishi Chemical Holdings
4.3.1 Profile
4.3.2 Operation
4.3.3 Anode Materials Business
4.4 KUREHA
4.4.1 Profile
4.4.2 Operation
4.4.3 Operation of Advanced Materials Segment
4.4.4 Anode Materials Business
5. Major Chinese Companies
5.1 China Baoan Group Co., Ltd.
5.1.1 Profile
5.1.2 Operation
5.1.3 Revenue Structure
5.1.4 Gross Margin
5.1.5 R&D
5.1.6 Customers and Suppliers
5.1.7 Anode Materials Business
5.1.8 Forecast and Outlook
5.2 Ningbo Shanshan Co., Ltd.
5.2.1 Profile
5.2.2 Operation
5.2.3 Revenue Structure
5.2.4 Gross Margin
5.2.5 R&D
5.2.6 Anode Materials Business
5.2.7 Forecast and Outlook
5.3 Beijing Easpring Material Technology Co., Ltd.
5.3.1 Profile
5.3.2 Operation
5.3.3 Hunan Shinzoom Graphite Technology Co., Ltd.
5.4 China-Kinwa High Technology Co., Ltd.
5.4.1 Profile
5.4.2 Operation
5.4.3 Revenue Structure
5.4.4 Gross Margin
5.4.5 R&D
5.4.6 Huzhou Chuangya Power Battery Materials Co., Ltd.
5.5 Jiangxi Zhengtuo New Energy Technology Co., Ltd.
5.5.1 Profile
5.5.2 Operation
5.5.3 Revenue Structure
5.5.4 Gross Margin
5.5.5 R&D
5.5.6 Customers and Suppliers
5.5.7 Selling Price
5.6 Other Companies
5.6.1 Jiangxi Zichen Technology Co., Ltd.
5.6.2 Shenzhen Sinuo Industrial Development Co., Ltd.
5.6.3 Morgan AM&T Hairong Co., Ltd.
5.6.4 Chengdu Xingneng New Materials Co., Ltd.
5.6.5 Tianjin Kimwan Carbon Technology and Development Co., Ltd.
5.6.6 Dalian Hongguang Lithium Industry Co., Ltd.
6. Summary and Forecast
6.1 Summary
6.2 Development Forecast
表:锂电池的成本构成
图:锂电池负极材料分类
图:动力锂电池价值链
图:动力锂电池生产工序
表:中国锂电池产业相关政策
图:2013年全球负极材料产量构成
表:全球负极材料(分产品)主要供应商及采购商
图:2013年全球负极材料厂商市场份额
图:2010-2014年中国锂电池负极材料销量及增长率
表:2014年中国锂电池负极材料主要企业及其产能
表:2013年中国锂电池负极材料主要企业出货量及收入
表:2014年中国锂电池负极材料主要企业客户情况
图:2010-2014年中国负极材料平均销售价格
图:2013年全球动力电池厂商关键材料供应体系
图:2013年中国动力电池厂商关键材料供应体系
表:几种负极材料技术特性对比
图:锂离子电池应用领域
图:2012-2016年全球笔记本、平板电脑、手机出货量
图:2012-2016年全球笔记本、平板电脑、手机锂电池出货量
图:2008-2016年全球电动汽车销量
表:全球主要电动汽车电池容量及续航能力
图:2008-2016年全球电动汽车单车电池容量
图:2008-2016年全球电动汽车动力电池需求
表:2014年全球主要电动汽车电池组成本
图:2008-2016年全球动力锂电池组价格
图:2008-2016年全球锂电池出货量
图:2008-2016年全球锂电池出货量
图:2012-2016年全球锂电池需求结构占比
图:2008-2016年全球锂电池(分领域)出货量
图:2008-2016年全球锂电池产业规模
图:2012-2016年中国笔记本、平板电脑、手机锂电池出货量
图:2008-2016年中国电动汽车销量
图:2008-2016年中国电动汽车销量占全球比重
图:2011-2016年中国Automotive Batteries需求
图:2008-2016年中国动力锂电池组价格
图:2008-2016年中国锂电池出货量
图:2008-2016年中国锂电池出货单元占全球比重
图:2008-2016年中国锂电池产业规模
图:2008-2016年中国锂电池产业规模占全球比重
图:2010-2016年中国动力锂电池产业规模与占比
图:2012-2013年中国、日本、韩国锂电池出货量占比
图:2013年全球小型锂电池企业市场份额
图:2013年全球动力锂电池企业市场份额
表:全球合资动力锂电池供应商
表:2013年中国动力锂电池企业电池技术和销售额
表:欧美动力锂电池厂商及配套车型
表:韩国动力锂电池厂商及及配套车型
表:日本动力锂电池厂商及及配套车型
表:中国动力锂电池厂商及及配套车型
图:2010-2014财年日立化成净销售额和净利润
图:2012-2014财年日立化成(分部门)净销售额占比
图:2011-2013财年日立化成(分地区)净销售额占比
表:日立化成主要业务部门及其业务
图:2010-2014财年日立化成功能材料部门净销售额和净利润
图:2014上半财年日立化成功能材料部门(分产品)净销售额占比
图:FY2010-FY2014三菱化学控股净销售额与净利润
表:FY2014H1三菱化学运营领域及主营业务销售收入占比
图:FY2010-FY2014日本吴羽净销售额和净利润
图:FY2012-FY2014日本Kureha(分业务)销售收入占比
图:FY2010-FY2014日本Kureha先进材料部门销售收入及营业利润
图:FY2011-FY2013日本Kureha先进材料部门主要产品销售收入
图:2010-2014年中国宝安营业收入和净利润
表:2012-2014年中国宝安(分产品)营业收入
图:2012-2014年中国宝安(分产品)营业收入占比
表:2012-2014年中国宝安(分地区)营业收入
图:2012-2014年中国宝安(分地区)营业收入占比
表:2012-2014年中国宝安主营产品毛利率
图:2011-2013年中国宝安研发支出及占营业收入的比例
图:2011-2013年中国宝安前五名客户贡献收入及占比
表:2013年中国宝安前五名客户名称、收入贡献及占比
图:2011-2013年中国宝安前五名供应商采购额及占比
表:2013年中国宝安前五名供应商名称、采购金额及占比
图:2012-2014年贝特瑞营业收入和净利润
表:截止2014年6月30日深圳贝特瑞子公司情况
表:2013-2014年贝特瑞锂电池材料研发进展情况
图:2013-2017年中国宝安营业收入和净利润预测
图:2010-2014年杉杉股份营业收入和净利润
表:2012-2014年杉杉股份(分产品)营业收入
图:2012-2014年杉杉股份(分产品)营业收入占比
表:2012-2014年杉杉股份(分地区)营业收入
图:2012-2014年杉杉股份(分地区)营业收入占比
表:2012-2014年杉杉股份主营产品毛利率
图:2011-2013年杉杉股份研发支出及占营业收入的比例
表:杉杉股份负极材料产品系列
图:2012-2014年杉杉股份负极材料业务收入及净利润
图:2012-2014年上海杉杉营业收入及净利润
表:杉杉股份锂电池负极材料发展情况
图:2013-2017年杉杉股份营业收入和净利润预测
图:2010-2014年杉杉股份营业收入和净利润
图:2012-2014年星城石墨营业收入和净利润
表:2012-2013年星城石墨(分产品)营业收入
图:2012-2013年星城石墨(分产品)营业收入占比
图:2012-2013年星城石墨主营产品毛利率
图:2012-2013年星城石墨研发支出及占营业收入的比例
表:2012-2013年星城石墨前五名客户贡献收入及占比
表:2012-2013年星城石墨前五名供应商采购金额及占比
图:2012-2013年星城石墨主营产品销量
图:2012-2013年星城石墨主营产品销售价格
图:2010-2014年中科英华营业收入和净利润
表:2012-2014年中科英华(分产品)营业收入
图:2012-2014年中科英华(分产品)营业收入占比
表:2012-2014年中科英华(分地区)营业收入
图:2012-2014年中科英华(分地区)营业收入占比
表:2012-2014年中科英华主营产品毛利率
图:2011-2013年中科英华研发支出及占营业收入的比例
图:2012-2014年湖州创亚营业收入和净利润
图:2012-2014年江西正拓营业收入和净利润
表:2012-2014年江西正拓(分产品)营业收入
图:2012-2014年江西正拓(分产品)营业收入占比
表:2012-2014年江西正拓(分地区)营业收入
图:2012-2014年江西正拓(分地区)营业收入占比
图:2012-2014年江西正拓主营产品毛利率
图:2012-2014年江西正拓研发支出及占营业收入的比例
图:2012-2014年江西正拓前五名客户贡献收入及占比
表:2014上半年江西正拓前五名客户名称、收入贡献及占比
图:2012-2014年江西正拓前五名供应商采购额及占比
表:2014上半年江西正拓前五名供应商名称、采购金额及占比
图:2012-2014年江西正拓主营产品销售价格
表:2013-2014年全球及中国主要企业负极材料营收情况
图:2013-2017年中国锂电池负极材料销量及增长率
图:2013-2017年中国负极材料平均销售价格
Cost Structure of Lithium Battery
Classification of Lithium Battery Anode Materials
Value Chain of Power Lithium Battery
Production Procedures of Power Lithium Battery
Policies on Lithium Battery Industry in China
Global Anode Materials Output Structure, 2013
Major Global Suppliers and Buyers of Anode Materials by Product
Market Shares of Global Anode Materials Producers, 2013
Sales Volume and Growth Rate of Lithium Battery Anode Materials in China, 2010-2014
Major Lithium Battery Anode Materials Companies and Their Capacities, 2014
Shipments and Revenue of Lithium Battery Anode Materials Companies in China, 2013
Customers of Major Lithium Battery Anode Materials Companies in China, 2014
Average Selling Prices of Anode Materials in China, 2010-2014
Critical Materials Supply System of Global Power Battery Manufacturers, 2013
Critical Materials Supply System of Power Battery Manufacturers in China, 2013
Comparison of Several Anode Materials’ Technical Characteristics
Applications of Lithium-ion Battery
Global Notebook, Tablet PC, and Mobile Phone Shipments, 2012-2016E
Global Notebook, Tablet PC, and Mobile Phone Lithium Battery Shipments, 2012-2016E
Global Electric Vehicles Sales Volume, 2008-2016E
Battery Capacity of Global Major Electric Vehicles and Endurance
Battery Capacity of Single Electric Vehicle Globally, 2008-2016E
Global Demand for Power Battery from Electric Vehicles, 2008-2016E
Battery Pack Costs of Global Major Electric Vehicles, 2014
Global Power Lithium Battery Pack Price, 2008-2016E
Global Lithium Battery Shipments, 2008-2016E
Global Lithium Battery Shipments, 2008-2016E
Global Lithium Battery Demand Structure, 2012-2016E
Global Lithium Battery Shipments by Field, 2008-2016E
Global Lithium Battery Industry Scale, 2008-2016E
China’s Notebook, Tablet PC, and Mobile Phone Shipments, 2012-2016E
China’s Electric Vehicle Sales Volume, 2008-2016E
China’s Share of Global Electric Vehicles Sales Volume, 2008-2016E
China’s Demand for Automotive Batteries, 2011-2016E
Power Lithium Battery Pack Price in China, 2008-2016E
China’s Lithium Battery Shipments, 2008-2016E
China’s Share of Global Lithium Battery Shipments, 2008-2016E
China’s Lithium Battery Industry Scale, 2008-2016E
China’s Share of Global Lithium Battery Industry Scale, 2008-2016E
Power Lithium Battery Industry Scale and Percentage in China, 2010-2016E
Shares of Lithium Battery Shipments in China, Japan, and China, 2012-2013
Market Shares of Global Small Lithium Battery Companies, 2013
Market Shares of Global Power Lithium Battery Companies, 2013
Global Joint-venture Suppliers of Power Lithium Battery
Battery Technologies and Sales of Power Lithium Battery Companies in China, 2013
Power Lithium Battery Companies in Europe and America and Supported Models
Power Lithium Battery Companies in South Korea and Supported Models
Power Lithium Battery Companies in Japan and Supported Models
Power Lithium Battery Companies in China and Supported Models
Net Revenue and Net Income of Hitachi Chemical, FY2010-FY2014
Net Revenue Structure of Hitachi Chemical by Segment, FY2012-FY2014
Net Revenue Structure of Hitachi Chemical by Region, FY2011-FY2013
Main Business Segments and Businesses of Hitachi Chemical,
Net Revenue and Net Income of Hitachi Chemical’s Functional Materials Segment, FY2010-FY2014
Net Revenue Structure of Hitachi Chemical’s Functional Materials Segment by Product, FY2014H1
Net Revenue and Net Income of Mitsubishi Chemical Holdings, FY2010-FY2014
Fields of Operation and Operating Revenue Structure of Mitsubishi Chemical Holdings, FY2014H1
Net Revenue and Net Income of KUREHA, FY2010-FY2014
Revenue Structure of Kureha by Business, FY2012-FY2014
Revenue and Operating Profit of Kureha’s Advanced Materials Segment, FY2010-FY2014
Revenue from Main Products of Kureha’s Advanced Materials Segment, FY2011-FY2013
Revenue and Net Income of China Baoan Group, 2010-2014
Revenue Breakdown of China Baoan Group by Product, 2012-2014
Revenue Structure of China Baoan Group by Product, 2012-2014
Revenue Breakdown of China Baoan Group by Region, 2012-2014
Revenue Structure of China Baoan Group by Region, 2012-2014
Gross Margins of Main Products of China Baoan Group, 2012-2014
R&D Costs and % of Total Revenue of China Baoan Group, 2011-2013
China Baoan Group’s Revenue from Top5 Customers and % of Total Revenue, 2011-2013
Name List and Revenue Contribution of China Baoan Group’s Top 5 Customers, 2013
China Baoan Group’s Procurement from Top5 Suppliers and % of Total Procurement, 2011-2013
Name List and Procurement of China Baoan Group’s Top 5 Suppliers, 2013
Revenue and Net Income of BTR, 2012-2014
Subsidiaries of BTR, as of Jun. 30, 2014
BTR’s Progress of Research into Lithium Battery Materials, 2013-2014
Revenue and Net Income of China Baoan Group, 2013-2017E
Revenue and Net Income of Ningbo Shanshan, 2010-2014
Revenue Breakdown of Ningbo Shanshan by Product, 2012-2014
Revenue Structure of Ningbo Shanshan by Product, 2012-2014
Revenue Breakdown of Ningbo Shanshan by Region, 2012-2014
Revenue Structure of Ningbo Shanshan by Region, 2012-2014
Gross Margins of Main Products of Ningbo Shanshan, 2012-2014
R&D Costs and % of Total Revenue of Ningbo Shanshan, 2011-2013
Anode Materials Series of Ningbo Shanshan
Revenue and Net Income of Ningbo Shanshan’s Anode Materials Business, 2012-2014
Revenue and Net Income of Shanghai Shanshan, 2012-2014
Development of Lithium Battery Anode Materials of Ningbo Shanshan
Revenue and Net Income of Ningbo Shanshan, 2013-2017E
Revenue and Net Income of Hunan Shinzoom Graphite Technology, 2012-2014
Revenue Breakdown of Hunan Shinzoom Graphite Technology by Product, 2012-2013
Revenue Structure of Hunan Shinzoom Graphite Technology by Product, 2012-2013
Gross Margin of Main Products of Hunan Shinzoom Graphite Technology, 2012-2013
R&D Costs and % of Total Revenue of Hunan Shinzoom Graphite Technology, 2012-2013
Hunan Shinzoom Graphite Technology’s Revenue from Top5 Customers and % of Total Revenue, 2012-2013
Hunan Shinzoom Graphite Technology’s Procurement from Top5 Suppliers and % of Total Procurement, 2012-2013
Sales Volume of Main Products of Hunan Shinzoom Graphite Technology, 2012-2013
Selling Prices of Main Products of Hunan Shinzoom Graphite Technology, 2012-2013
Revenue and Net Income of China-Kinwa High Technology, 2010-2014
Revenue Breakdown of China-Kinwa High Technology by Product, 2012-2014
Revenue Structure of China-Kinwa High Technology by Product, 2012-2014
Revenue Breakdown of China-Kinwa High Technology by Region, 2012-2014
Revenue Structure of China-Kinwa High Technology by Region, 2012-2014
Gross Margins of Main Products of China-Kinwa High Technology, 2012-2014
R&D Costs and % of Total Revenue of China-Kinwa High Technology, 2011-2013
Revenue and Net Income of Huzhou Chuangya Power Battery Materials, 2012-2014
Revenue and Net Income of Jiangxi Zhengtuo New Energy Technology, 2012-2014
Revenue Breakdown of Jiangxi Zhengtuo New Energy Technology by Product, 2012-2014
Revenue Structure of Jiangxi Zhengtuo New Energy Technology by Product, 2012-2014
Revenue Breakdown of Jiangxi Zhengtuo New Energy Technology by Region, 2012-2014
Revenue Structure of Jiangxi Zhengtuo New Energy Technology by Region, 2012-2014
Gross Margins of Main Products of Jiangxi Zhengtuo New Energy Technology, 2012-2014
R&D Costs and % of Total Revenue of Jiangxi Zhengtuo New Energy Technology, 2012-2014
Jiangxi Zhengtuo New Energy Technology’s Revenue from Top5 Customers and % of Total Revenue, 2012-2014
Name List and Revenue Contribution of Jiangxi Zhengtuo New Energy Technology’s Top 5 Customers, 2014H1
Jiangxi Zhengtuo New Energy Technology’s Procurement from Top 5 Suppliers and % of Total Procurement, 2012-2014
Name List and Procurement of Jiangxi Zhengtuo New Energy Technology’s Top 5 Suppliers, 2014H1
Selling Prices of Main Products of Jiangxi Zhengtuo New Energy Technology, 2012-2014
Anode Materials Revenue of Major Global and Chinese Companies, 2013-2014
Sales Volume and Growth Rate of Lithium Battery Anode Materials in China, 2013-2017E
Average Selling Prices of Anode Materials in China, 2013-2017E
如果这份报告不能满足您的要求,我们还可以为您定制报告,请 留言说明您的详细需求。
|