|
|
|
报告导航:研究报告—
金融与服务业—交通物流
|
|
2015-2018年中国航空运输及机场行业研究报告 |
 |
字数:3.6万 |
页数:127 |
图表数:162 |
|
中文电子版:8000元 |
中文纸版:4000元 |
中文(电子+纸)版:8500元 |
|
英文电子版:2200美元 |
英文纸版:2400美元 |
英文(电子+纸)版:2500美元 |
|
编号:LMX062
|
发布日期:2015-02 |
附件:下载 |
 |
|
|
2014年以来,虽然国内外经济增速放缓、高铁冲击等因素继续影响中国航空市场需求,但在以旅游出行为主的休闲需求带动下,中国民航旅客周转量仍保持较快增长,货邮周转量增速在出口回升带动下小幅反弹。2014年1-11月,中国民航全行业完成运输总周转量683.85亿吨公里,比上年同期增长11.1%;其中,旅客周转量5801.81亿人公里,同比增长11.60%;货邮周转量168.74亿吨公里,同比增长8.8%。
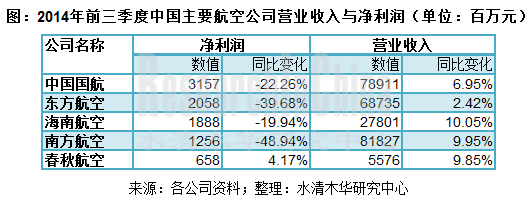
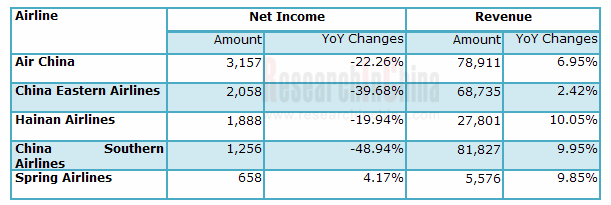
但航空公司在人民币对美元贬值的影响下,汇兑损失严重。2014年前三季度,四大航空公司的净利润都出现大幅下滑,其中南方航空的下滑程度最为严重,达到48.94%。相比四大航在2010年后利润均出现大幅下滑的情况,低成本航空代表企业春秋航空2011年以来营业收入和净利润始终保持增长,2014年前三季度公司净利润增速为4.17%。
为改善业绩,2013年以来,中国的航空公司主要通过两个途径寻求突破:加快开辟国际、地区航线和加快进军低成本航空领域。
积极开辟新航线。2014年国航总计新增12条航线,4条国内航线,8条国际线,2012年以来累计新增33条国际航线。2014年,南方航空新开9条国际航线,2012年以来累计新增26条国际航线。
加快低成本航空领域布局:2013年5月,西部航空宣告转型低成本航空;2013年6月,香港快运宣告转型低成本航空;2014年7月2日,东航集团宣布旗下中国联合航空有限公司正式转型为低成本航空公司;2015年1月21日,春秋航空成功登陆上海证券交易所,成为中国低成本航空上市的“第一股”。
《2015-2018年中国航空运输及机场行业研究报告》主要涉及以下内容:
 中国航空运输业发展环境,包括经济环境、政策环境以及社会环境分析; 中国航空运输业发展环境,包括经济环境、政策环境以及社会环境分析;
中国航空运输业运行状况以及中国低成本航空市场分析;
中国机场运输行业运行状况,主要包括旅客吞吐量、货邮吞吐量及飞机起降架次分析;
中国航空运输业整体经济效益分析,包括行业企业营业收入和利润总额;
中国16家主要航空公司研究,包括企业财务状况、运力、运载量、载运量、发展战略及业绩预测;
中国15个主要运输机场研究,包括机场财务状况、三大生产指标及业绩预测;
2015-2018年中国航空运输行业主要数据预测。
Since 2014, despite negative influence from slower economic growth at home and abroad and high-speed railway on Chinese aviation market demand, China’s civil aviation passenger throughput still kept relatively rapid growth driven by tourist’s leisure demand, and cargo & mail throughput rallied slightly driven by a pickup in exports. In the first eleven months of 2014, China’s total civil aviation turnover, passenger turnover, and cargo & mail turnover reached 68.385 billion ton-kilometers, 580.181 billion passenger-kilometers, and 16.874 billion ton-kilometers, a year-on-year increase of 11.1%, 11.60%, and 8.8%, respectively.
However, the airlines suffered heavy exchange losses due to yuan depreciation against dollar. In the first three quarters of 2014, four big airlines all saw sharp decline in net income, with China Eastern Airlines falling the hardest, at 48.94%. Compared with significant drop in profits of the four big airlines since 2010, Spring Airlines, a representative of budget airlines, has enjoyed continuous increase in revenue and net income ever since 2011, with the latter recording a growth of 4.17% in the first three quarters of 2014.
Revenue and Net Income of Major China Airlines in the First Three Quarters of 2014 (Unit: RMB mln)
Source: Companies Mentioned Above, ResearchInChina
To improve performance, the airlines in China have sought to make progress in two aspects since 2013: accelerate the opening up of international and regional routes; speed to expand into low-cost aviation industry.
Actively opening up new routes: In 2014, Air China added 12 routes (4 domestic ones and 8 international ones), totaling 33 international routes from 2012. In the same year, China Southern Airlines opened 9 new international routes, bringing the total newly-added international routes to 26 since 2012.
Speeding layout in low-cost aviation industry: In Mar. 2013, China West Air announced to transform into a low-cost carrier; in Jun. 2013, Hong Kong Express Airways announced its intention to transform into a low-cost carrier; on Jul. 2014, China Eastern Airlines announced its subsidiary China United Airlines to convert into a low-cost airline; on Jan. 21, 2015, Spring Airlines got its shares listed on the Shanghai Stock Exchange, becoming the first listed low-cost airline in China.
China Air Transport and Airport Industry Report, 2015-2018 focuses on the following:
 Development environment for air transport industry in China, covering economic environment, policy environment, and social environment; Development environment for air transport industry in China, covering economic environment, policy environment, and social environment;
Operation status of air transport industry and low-cost aviation market in China;
Operation status of airport transportation in China, including passenger throughput, cargo & mail throughput, and airplane takeoffs and landings;
Overall economic results of air transport industry in China, encompassing revenues and total profits of companies in the industry;
16 major airlines in China, including financial situation, transport capacity, carrying capacity, load factor, development strategy, and performance forecast;
15 major transport airports in China, including financial situation, three production index, and performance forecast;
Forecast on main data of China’s air transport industry for 2015-2018.
第一章 中国航空运输业发展环境
1.1 经济环境
1.2 政策环境
1.3 社会环境
第二章 中国航空运输业运行状况及发展现状
2.1 运行指标
2.1.1 运力
2.1.2 运输周转量
2.1.3 运输量
2.1.4 运输效率
2.2 低成本航空市场分析
2.2.1 发展历程
2.2.2 发展现状
2.2.3 未来发展
第三章 中国机场运输行业运行状况
3.1 通航城市与机场数量
3.2 旅客吞吐量
3.3 货邮吞吐量
3.4 飞机起降架次
第四章 中国航空运输及机场行业经济效益分析
4.1 行业整体经济效益
4.2 细分行业
第五章 中国主要航空公司运营状况
5.1 航空公司竞争格局
5.1.1 业绩对比
5.1.2 运力对比
5.1.3 运输量对比
5.1.4 客座率对比
5.2 南方航空
5.2.1 公司简介
5.2.2 经营状况
5.2.3 运力
5.2.4 运载量
5.2.5 载运率
5.2.6 战略转型
5.2.7 业绩预测
5.3 东方航空
5.3.1 公司简介
5.3.2 经营状况
5.3.3 运力
5.3.4 运载量
5.3.5 载运率
5.3.6 战略转型
5.3.7 业绩预测
5.4 中国国航
5.4.1 公司简介
5.4.2 经营状况
5.4.3 运力
5.4.4 运载量
5.4.5 载运率
5.4.6 发展战略
5.4.7 业绩预测
5.5 海南航空
5.5.1 公司简介
5.5.2 经营状况
5.5.3 运力
5.5.4 运载量
5.5.5 载运率
5.5.6 业绩预测
5.6 国泰航空
5.6.1 公司简介
5.6.2 经营状况
5.6.3 运力
5.6.4 运载量
5.6.5 载运率
5.6.6 业绩预测
5.7 山东航空
5.7.1 公司简介
5.7.2 经营状况
5.7.3 运力
5.7.4 运载量
5.7.5 载运率
5.7.6 业绩预测
5.8 春秋航空
5.8.1 公司简介
5.8.2 经营状况
5.8.3 运力
5.8.4 运载量
5.8.5 载运率
5.8.6 募集资金项目
5.9 吉祥航空
5.9.1 公司简介
5.9.2 经营状况
5.9.3 运力
5.9.4 运载量
5.9.5 载运率
5.9.6 发展战略
5.10 深圳航空
5.10.1 公司简介
5.10.2 经营状况
5.10.3 运力
5.10.4 运载量
5.10.5 载运率
5.11 厦门航空
5.11.1 公司简介
5.11.2 经营状况
5.11.3 运力
5.11.4 运载量
5.11.5 载运率
5.12 四川航空
5.13 华夏航空
5.14 中国联合航空
5.15 中国邮政航空
5.16 中国货运航空
5.17 奥凯航空
第六章 中国主要机场运营状况
6.1 中国机场竞争格局
6.2 北京首都国际机场
6.2.1 机场简介
6.2.2 财务状况
6.2.3 生产指标
6.2.4 业绩预测
6.3 上海机场
6.3.1 机场简介
6.3.2 财务状况
6.3.3 生产指标
6.3.4 业绩预测
6.4 白云机场
6.4.1 机场简介
6.4.2 财务状况
6.4.3 生产指标
6.4.4 业绩预测
6.5 深圳机场
6.5.1 机场简介
6.5.2 财务状况
6.5.3 生产指标
6.5.4 业绩预测
6.6 成都双流国际机场
6.7 昆明长水国际机场
6.8 西安咸阳国际机场
6.9 重庆江北国际机场
6.10 杭州萧山国际机场
6.11 厦门高崎国际机场
6.12 长沙黄花国际机场
6.13 南京禄口国际机场
6.14 武汉天河国际机场
6.15 乌鲁木齐国际机场
6.16 青岛国际机场
第七章 中国航空运输及机场行业总结及发展预测
7.1 数字看民航2014年
7.2 发展预测
7.2.1 行业发展趋势
7.2.2 数据预测
Preface
1. Development Environment for China Air Transport Industry
1.1 Economic Environment
1.2 Policy Environment
1.3 Social Environment
2. Operation and Development Status of China Air Transport Industry
2.1 Operation Indicators
2.1.1 Transport Capacity
2.1.2 Traffic Turnover
2.1.3 Traffic Volume
2.1.4 Traffic Efficiency
2.2 Low-Cost Aviation Market
2.2.1 Development Process
2.2.2 Development Status
2.2.3 Future Development
3. Operation of China Airport Transportation Industry
3.1 Number of Destinations & Airports
3.2 Passenger Throughput
3.3 Cargo & Mail Throughput
3.4 Aircraft Movements
4. Economic Benefits of China Air Transport and Airport Industry
4.1 Overall
4.2 Industry Segments
5. Operation of Major Chinese Airlines
5.1 Competition Pattern
5.1.1 Performance
5.1.2 Transport Capacity
5.1.3 Traffic Volume
5.1.4 Passenger Load Factor
5.2 China Southern Airlines
5.2.1 Profile
5.2.2 Operation
5.2.3 Transport Capacity
5.2.4 Carrying Capacity
5.2.5 Load Factor
5.2.6 Strategy Transition
5.2.7 Performance Forecast
5.3 China Eastern Airlines
5.3.1 Profile
5.3.2 Operation
5.3.3 Transport Capacity
5.3.4 Carrying Capacity
5.3.5 Load Factor
5.3.6 Strategy Transition
5.3.7 Performance Forecast
5.4 Air China
5.4.1 Profile
5.4.2 Operation
5.4.3 Transport Capacity
5.4.4 Carrying Capacity
5.4.5 Load Factor
5.4.6 Development Strategy
5.4.7 Performance Forecast
5.5 Hainan Airlines
5.5.1 Profile
5.5.2 Operation
5.5.3 Transport Capacity
5.5.4 Carrying Capacity
5.5.5 Load Factor
5.5.6 Performance Forecast
5.6 Cathay Pacific Airways
5.6.1 Profile
5.6.2 Operation
5.6.3 Transport Capacity
5.6.4 Carrying Capacity
5.6.5 Load Factor
5.6.6 Performance Forecast
5.7 Shandong Airlines
5.7.1 Profile
5.7.2 Operation
5.7.3 Transport Capacity
5.7.4 Carrying Capacity
5.7.5 Load Factor
5.7.6 Performance Forecast
5.8 Spring Airlines
5.8.1 Profile
5.8.2 Operation
5.8.3 Transport Capacity
5.8.4 Carrying Capacity
5.8.5 Load Factor
5.8.6 Fund-raising Projects
5.9 Juneyao Airlines
5.9.1 Profile
5.9.2 Operation
5.9.3 Transport Capacity
5.9.4 Carrying Capacity
5.9.5 Load Factor
5.9.6 Strategy
5.10 Shenzhen Airlines
5.10.1 Profile
5.10.2 Operation
5.10.3 Transport Capacity
5.10.4 Carrying Capacity
5.10.5 Load Factor
5.11 Xiamen Airlines
5.11.1 Profile
5.11.2 Operation
5.11.3 Transport Capacity
5.11.4 Carrying Capacity
5.11.5 Load Factor
5.12 Sichuan Airlines
5.13 China Express
5.14 China United Airlines
5.15 China Postal Airlines
5.16 China Cargo Airlines
5.17 Okay Airways
6. Operation of Major Chinese Airports
6.1 Competition Pattern
6.2 Beijing Capital International Airport
6.2.1 Profile
6.2.2 Financial Position
6.2.3 Production Index
6.2.4 Performance Forecast
6.3 Shanghai Airport
6.3.1 Profile
6.3.2 Financial Position
6.3.3 Production Index
6.3.4 Performance Forecast
6.4 Baiyun Airport
6.4.1 Profile
6.4.2 Financial Position
6.4.3 Production Index
6.4.4 Performance Forecast
6.5 Shenzhen Airport
6.5.1 Profile
6.5.2 Financial Position
6.5.3 Production Index
6.5.4 Performance Forecast
6.6 Chengdu Shuangliu International Airport
6.7 Kunming Changshui International Airport
6.8 Xi’an Xianyang International Airport
6.9 Chongqing Jiangbei International Airport
6.10 Hangzhou Xiaoshan International Airport
6.11 Xiamen Gaoqi International Airport
6.12 Changsha Huanghua International Airport
6.13 Nanjing Lukou International Airport
6.14 Wuhan Tianhe International Airport
6.15 Urumqi International Airport
6.16 Qingdao International Airport
7. Summary and Forecast for China Air Transport and Airport Industry
7.1 Digital Civil Aviation 2014
7.2 Development Forecast
7.2.1 Trends
7.2.2 Data Forecast
图:1991-2014年中国民航旅客周转量围绕GDP增速波动
表:2011-2015年中国航空运输行业相关法规及政策
图:1985-2013年中国城镇居民家庭人均年交通通信支出
图:高铁VS民航
图:2004-2013年中国民航民用飞机架数
图:2006-2013年中国民航运输飞机数量
图:2004-2013年中国民用航空航线条数
图:2006-2014年中国民航运输总周转量及同比增长
图:2007-2014年中国民航旅客周转量及同比增长
图:2007-2014年中国民航货邮周转量及同比增长
图:2010-2014年中国民航运输总周转量(分航线)
图:2007-2014年中国民航旅客运输量及同比增长
表:2010-2014年中国民航旅客运输量(分航线)
图:2006-2014年中国民航货邮运输量及同比增长
表:2010-2014年中国民航货邮运输量(分航线)
图:2009-2014年中国民航飞机日利用率
图:2010-2014年中国民航正班客座率与正班载运率
表:2003-2015年中国低成本航空业发展历程
图:2004-2014年全球低成本航空市场份额
图:2014年全球各地区低成本航空公司数量和市场份额
图:2014年全球低成本航空公司运送旅客量区域分布
图:中国低成本航空公司发展困境
表:中国低成本航空公司介绍
表:外国低成本航空公司在华布局
图:2007-2014年全球主要市场低成本航空份额变化
图:低成本航空和高铁对比
图:2007-2013年中国民用航空通航城市与运输机场数量
表:2013年中国运输机场数量区域分布
图:2007-2014年中国运输机场旅客吞吐量及同比增长
表:2010-2013年中国运输机场旅客吞吐量(分航线)
表:2013年中国旅客吞吐量100万人次以上的机场数量
图:2013年中国旅客吞吐量区域分布
图:2007-2014年中国运输机场货邮吞吐量及同比增长
表:2010-2013年中国运输机场货邮吞吐量(分航线)
图:2013年中国货邮吞吐量区域分布
图:2007-2014年中国机场飞机起降架次及同比增长
图:2009-2014年中国民航行业企业营业收入与利润总额
表:2013年中国民航行业营业收入和利润总额构成
图:2009-2013年中国民航行业航空公司营业收入与利润总额
图:2009-2013年中国民航行业机场营业收入与利润总额
表:2014年前三季度中国主要航空公司净利润排名
表:2014年前三季度中国主要航空公司营业收入排名
表:2014上半年中国主要航空公司飞机拥有量排名
表:2014年中国主要航空公司三大运力指标对比
表:2014年中国主要航空公司运输量对比
表:2014年中国主要航空公司客座率对比
图:2009-2014年南方航空营业收入与净利润
图:2014年上半年南方航空主营业务成本构成
表:2009-2014年南方航空飞机拥有量
表:2008-2014年南方航空三大运力指标
表:2008-2014年南方航空运载量情况
图:2010-2014年南方航空旅客运输量构成
图:2008-2014年南方航空载运率
表:南方航空战略转型之路
表:2015-2018年南方航空营业收入与净利润预测
图:2009-2014年东方航空营业收入与净利润
图:2014年上半年东方航空营业成本构成
图:2009-2014年东方航空飞机拥有量
表:2008-2014年东方航空运力情况
表:2008-2014年东方航空运载量
图:2010-2014年东方航空旅客运输量构成
图:2008-2014年东方航空载运率
表:2015-2018年东方航空营业收入与净利润预测
图:2009-2014年中国国航营业收入与净利润
表:2014年上半年中国国航营业成本构成
图:2009-2014年中国国航飞机拥有量
表:2008-2014年中国国航主要运力指标
表:2008-2014年中国国航运载量指标
图:2009-2014年中国国航旅客运输量构成
图:2008-2014年中国国航载运率
表:2015-2018年中国国航营业收入与净利润预测
图:2009-2014年海南航空营业收入与净利润
图:2009-2014年海南航空飞机拥有量
表:2008-2013年海南航空运力指标
表:2014年海南航空运力指标
表:2009-2014年海南航空主要载运量指标
图:2008-2014年海南航空载运率
图:2014年1-12月海南航空载运率(%)
表:2015-2018年海南航空营业收入与净利润预测
图:国泰航空及其附属公司、控股公司飞行航线
图:2009-2014年国泰航空营业收入与净利润
图:2014年上半年国泰航空营业开支构成
图:2009-2014年国泰航空飞机拥有量
表:2007-2014年国泰航空运力指标
表:2007-2014年国泰航空运载量指标
图:2014年国泰航空RPK(分区域)构成
图:2007-2014年国泰航空载运率
表:2015-2018年国泰航空营业收入与净利润预测
图:2009-2014年山东航空营业收入与净利润
表:2014年上半年山东航空机队类型
表:2010-2014年山东航空主要营运指标
图:2012-2014年山东航空载运率
表:2015-2018年山东航空营业收入与净利润预测
表:春秋航空介绍
图:2011-2014年春秋航空营业收入与净利润
图:2011-2014年春秋航空飞机拥有量
图:春秋航空A320飞机可飞行范围
表:2011-2015年春秋航空运力指标
表:2011-2015年春秋航空运载量指标
图:2011-2015年春秋航空载运率
表:春秋航空募集资金项目
图:2011-2014年吉祥航空营业收入与净利润
图:2011-2014年吉祥航空营业收入(分业务)构成
图:2011-2014年吉祥航空飞机拥有量
表:2014年6月底吉祥航空飞机类型
表:2007-2014年吉祥航空运载量
图:2011-2014年吉祥航空旅客运输量构成
图:2011-2014年吉祥航空客座率
表:2011-2014年深圳航空营业收入与净利润
图:深圳航空飞机拥有量
表:2010-2014年深圳航空运力指标
表:2010-2014年深圳航空运载量指标
表:2010-2014年深圳航空载运率
图:2002-2013年厦门航空业务收入总额
图:2002-2013年厦门航空利润总额
图:2011-2014年厦门航空飞机拥有量
表:2009-2014年厦门航空运载量指标
表:2011-2013年厦门航空载运率
表:2009-2013年四川航空主要财务指标
表:2006-2014年四川航空运载量
表:2007-2014年华夏航空旅客运载量
表:中联航介绍
表:2006-2014年中国联合航空运载量
表:2006-2013年中国邮政航空运载量
表:2012-2014年中国货运航空营业收入与净利润
表:2006-2013年中国货运航空运载量
图:2005-2015年奥凯航空飞机拥有量
表:2006-2014年奥凯联合航空运载量
表:2014年中国主要机场三大指标对比
图:2008-2014年北京首都国际机场营业收入与净利润
图:2014年上半年北京首都国际机场经营费用
表:2007-2014年北京首都国际机场三大生产指标
表:2015-2018年北京首都国际机场营业收入与净利润预测
图:2009-2014年上海机场营业收入与净利润
表:2014年上半年上海机场运营成本构成
表:2009-2014年上海浦东国际机场三大生产指标
表:2009-2014年上海虹桥机场三大生产指标
表:2015-2018年上海机场营业收入与净利润预测
图:2008-2014年白云机场营业收入与净利润
表:2008-2014年白云机场三大生产指标
表:2015-2018年白云机场营业收入与净利润预测
图:2009-2014年深圳机场营业收入与净利润
表:2007-2015年深圳机场三大生产指标
表:2015-2018年深圳机场营业收入与净利润预测
表:2007-2014年成都双流国际机场三大生产指标
表:2007-2014年昆明长水国际机场三大生产指标
表:2007-2014年西安咸阳国际机场三大生产指标
表:2007-2014年重庆江北国际机场三大生产指标
表:2007-2014年杭州萧山国际机场三大生产指标
表:2007-2014年厦门高崎国际机场三大生产指标
表:2007-2014年长沙黄花国际机场三大生产指标
表:2007-2014年南京禄口机场三大生产指标
表:2007-2014年武汉天河国际机场三大生产指标
表:2007-2014年乌鲁木齐国际机场三大生产指标
表:2009-2014年青岛国际机场三大生产指标
表:2013-2014年中国民航运输业主要运行指标
表:2014年中国主要千万级机场级别分布(按旅客吞吐量)
图:2012-2014年中国主要航空公司国际新开航线统计
图:2015-2018年中国民航行业企业营业收入与利润总额预测
图:2015-2018年中国民航运输总周转量预测(单位:百万吨公里
图:2015-2018年中国民航旅客运输量预测
图:2015-2018年中国民航货邮运输量预测
Fluctuation of China Civil Aviation RPK around GDP Growth Rate, 1991-2014
Laws, Regulations, and Policies Concerning China Air Transport Industry, 2011-2015
Urban Household’s Per Capita Transportation Communication Expense in China, 1985-2013
High Speed Rail VS Civil Aviation
Number of China Civil Aviation Aircrafts, 2004-2013
Number of Transport Aircrafts in China Civil Aviation Industry, 2006-2013
Number of China Civil Aviation Airlines, 2004-2013
China Civil Aviation Turnover and YoY Growth, 2006-2014
China Civil Aviation Passenger Turnover and YoY Growth, 2007-2014
China Civil Aviation Cargo & Mail Turnover and YoY Growth, 2007-2014
China Civil Aviation Turnover (by Air Route), 2006-2014
China Civil Aviation Passenger Traffic Volume and YoY Growth, 2007-2014
China Civil Aviation Passenger Traffic Volume (by Air Route), 2010-2014
China Civil Aviation Cargo & Mail Traffic Volume and YoY Growth, 2006-2014
China Civil Aviation Cargo & Mail Traffic Volume (by Air Route), 2010-2014
Daily Utilization Rate of China Civil Aviation Aircrafts, 2009-2014
Passenger Load Factor and Overall Load Factor of China Civil Aviation Industry, 2010-2014
Development Course of China Low-Cost Aviation Industry, 2003-2015
Global Low-Cost Aviation Market Share, 2004-2014
Number and Market Share of Low-Cost Airlines in the World (by Region), 2014
Passenger Transport Volume of Global Low-Cost Airlines (by Region), 2014
Development Difficulties of Low-Cost Airlines in China
Introduction of Low-Cost Airlines in China
Layout of Foreign Low-Cost Airlines in China
Low-Cost Airline Share Changes in the World’s Major Markets, 2007-2014
Low-Cost Aviation VS High Speed Railway
Number of Civil Aviation Destinations and Airports in China, 2007-2013
Number of Transport Airports in China (by Region), 2013
Passenger Throughput and YoY Growth of Transport Airports in China, 2007-2014
Passenger Throughput of Transport Airports in China (by Air Route), 2010-2013
Number of Transports with Passenger Throughput Exceeding 1 Million Person-times in China, 2013
Regional Distribution of China’s Passenger Throughput, 2013
Cargo & Mail Throughput and YoY Growth of Transport Airports in China, 2007-2014
Cargo & Mail Throughput of Transport Airports in China (by Air Route), 2010-2013
Regional Distribution of China’s Cargo & Mail Throughput, 2013
Aircraft Movements and YoY Growth of Airports in China, 2007-2014
Revenue and Total Profit of Civil Aviation Enterprises in China, 2009-2014
Structure of Revenue and Total Profit of China Civil Aviation Industry, 2013
Revenue and Total Profit of Airlines in China Civil Aviation Industry, 2009-2013
Revenue and Total Profit of Airports in China Civil Aviation Industry, 2009-2013
Airlines Ranking (by Net Income) in China, Q1-Q3, 2014
Airlines Ranking (by Revenue) in China, Q1-Q3, 2014
Airlines Ranking (by Number of Aircraft Ownership) in China, H1 2014
Key Chinese Airlines’ Three Capacity Indices, 2014
Key Chinese Airlines’ Traffic Volume, 2014
Key Chinese Airlines’ Passenger Load Factors, 2014
Revenue and Net Income of China Southern Airlines, 2009-2014
Structure of Main Business Cost of China Southern Airlines, H1 2014
Number of Aircraft Ownership of China Southern Airlines, 2009-2014
Three Capacity Indices of China Southern Airlines, 2008-2014
Carrying Capacity of China Southern Airlines, 2008-2014
Structure of Passenger Traffic Volume of China Southern Airlines, 2010-2014
Overall Load Factor of China Southern Airlines, 2008-2014
Strategy Transition of China Southern Airlines
Revenue and Net Income of China Southern Airlines, 2015E-2018E
Revenue and Net Income of China Eastern Airlines, 2009-2014
Structure of Operating Cost of China Eastern Airlines, H1 2014
Number of Aircraft Ownership of China Eastern Airlines, 2009-2014
Capacity Situation of China Eastern Airlines, 2008-2014
Carrying Capacity of China Eastern Airlines, 2008-2014
Structure of Passenger Traffic Volume of China Eastern Airlines, 2010-2014
Overall Load Factor of China Eastern Airlines, 2008-2014
Revenue and Net Income of China Eastern Airlines, 2015E-2018E
Revenue and Net Income of Air China, 2009-2014
Structure of Operating Cost of Air China, H1 2014
Number of Aircraft Ownership of Air China, 2009-2014
Main Capacity Indices of Air China, 2008-2014
Carrying Capacity Indices of Air China, 2008-2014
Structure of Passenger Traffic Volume of Air China, 2009-2014
Overall Load Factor of Air China, 2008-2014
Revenue and Net Income of Air China, 2015E-2018E
Revenue and Net Income of Hainan Airlines, 2009-2014
Number of Aircraft Ownership of Hainan Airlines, 2009-2014
Capacity Indices of Hainan Airlines, 2009-2014
Capacity Indices of Hainan Airlines, 2014
Carrying Capacity Indices of Hainan Airlines, 2009-2014
Overall Load Factor of Hainan Airlines, 2008-2014
Overall Load Factor of Hainan Airlines, 2014
Revenue and Net Income of Hainan Airlines, 2015E-2018E
Flight Lines of Cathay Pacific Airways and Its Affiliated Companies
Revenue and Net Income of Cathay Pacific Airways, 2009-2014
Structure of Operating Expenses of Cathay Pacific Airways, H1 2014
Number of Aircraft Ownership of Cathay Pacific Airways, 2009-2014
Capacity Indices of Cathay Pacific Airways, 2007-2014
Carrying Capacity Indices of Cathay Pacific Airways, 2007-2014
RPK Structure of Cathay Pacific Airways (by Region), 2014
Overall Load Factor of Cathay Pacific Airways, 2007-2014
Revenue and Net Income of Cathay Pacific Airways, 2015E-2018E
Revenue and Net Income of Shandong Airlines, 2009-2014
Fleet Type of Shandong Airlines, H1 2014
Major Operating Indicators of Shandong Airlines, 2010-2014
Overall Load Factor of Shandong Airlines, 2012-2014
Revenue and Net Income of Shandong Airlines, 2015E-2018E
Introduction of Spring Airlines
Revenue and Net Income of Spring Airlines, 2011-2014
Number of Aircraft Ownership of Spring Airlines, 2011-2014
Flying Range of Spring Airlines’ Airbus A320
Capacity Indices of Spring Airlines, 2011-2015
Carrying Capacity Indices of Spring Airlines, 2011-2015
Overall Load Factor of Spring Airlines, 2011-2015E
Fund-raising Projects of Spring Airlines
Revenue and Net Income of Juneyao Airlines, 2011-2014
Revenue Structure of Juneyao Airlines (by Segment), 2011-2014
Number of Aircraft Ownership of Juneyao Airlines, 2011-2014
Aircraft Type of Juneyao Airlines, end-Jun 2014
Carrying Capacity of Juneyao Airlines, 2007-2014
Structure of Passenger Traffic Volume of Juneyao Airlines, 2011-2014
Passenger Load Factor of Juneyao Airlines, 2011-2014
Revenue and Net Income of Shenzhen Airlines, 2011-2014
Number of Aircraft Ownership of Shenzhen Airlines
Capacity Indices of Shenzhen Airlines, 2010-2014
Carrying Capacity Indices of Shenzhen Airlines, 2010-2014
Overall Load Factor of Shenzhen Airlines, 2010-2014
Total Revenue of Xiamen Airlines, 2002-2013
Total Profit of Xiamen Airlines, 2002-2013
Number of Aircraft Ownership of Xiamen Airlines, 2011-2014
Carrying Capacity Indices of Xiamen Airlines, 2009-2014
Overall Load Factor of Xiamen Airlines, 2011-2013
Main Financial Indicators of Sichuan Airlines, 2009-2013
Carrying Capacity of Sichuan Airlines, 2006-2014
Passenger Carrying Capacity of China Express, 2007-2014
Introduction of China United Airlines
Carrying Capacity of China United Airlines, 2006-2014
Carrying Capacity of China Postal Airlines, 2006-2013
Revenue and Net Income of China Cargo Airlines, 2012-2014
Carrying Capacity of China Cargo Airlines, 2006-2013
Number of Aircraft Ownership of Okay Airways, 2005-2015
Carrying Capacity of Okay Airways, 2006-2014
Three Major Indices of Main Airports in China, 2014
Revenue and Net Income of Beijing Capital International Airport, 2008-2014
Operating Expenses of Beijing Capital International Airport, H1 2014
Three Production Indicators of Beijing Capital International Airport, 2007-2014
Revenue and Net Income of Beijing Capital International Airport, 2015E-2018E
Revenue and Net Income of Shanghai Airport, 2009-2014
Structure of Operating Cost of Shanghai Airport, H1 2014
Three Production Indicators of Shanghai Pudong Airport, 2009-2014
Three Production Indicators of Shanghai Hongqiao Airport, 2009-2014
Revenue and Net Income of Shanghai Airport, 2015E-2018E
Revenue and Net Income of Baiyun Airport, 2008-2014
Three Production Indicators of Baiyun Airport, 2008-2014
Revenue and Net Income of Baiyun Airport, 2015E-2018E
Revenue and Net Income of Shenzhen Airport, 2009-2014
Three Production Indicators of Shenzhen Airport, 2007-2015
Revenue and Net Income of Shenzhen Airport, 2015E-2018E
Three Production Indicators of Chengdu Shuangliu International Airport, 2007-2014
Three Production Indicators of Kunming Changshui International Airport, 2007-2014
Three Production Indicators of Xi’an Xianyang International Airport, 2007-2014
Three Production Indicators of Chongqing Jiangbei International Airport, 2007-2014
Three Production Indicators of Hangzhou Xiaoshan International Airport, 2007-2014
Three Production Indicators of Xiamen Gaoqi International Airport, 2007-2014
Three Production Indicators of Changsha Huanghua International Airport, 2007-2014
Three Production Indicators of Nanjing Lukou International Airport, 2007-2014
Three Production Indicators of Wuhan Tianhe International Airport, 2007-2014
Three Production Indicators of Urumqi International Airport, 2007-2014
Three Production Indicators of Qingdao International Airport, 2009-2014
Main Operation Indicators in China’s Civil Aviation Transportation Industry, 2013-2014
Airports (Passenger Throughput >10 Million Person-times) in China, 2014
New International Airlines of Major Airline Companies in China, 2012-2014
Revenue and Total Profit of Civil Aviation Companies in China, 2015E-2018E
Traffic Turnover of China’s Civil Aviation, 2015E-2018E
Passenger Traffic Volume of China’s Civil Aviation, 2015E-2018E
Cargo & Mail Traffic Volume of China’s Civil Aviation, 2015E-2018E
如果这份报告不能满足您的要求,我们还可以为您定制报告,请 留言说明您的详细需求。
|