|
|
|
报告导航:研究报告—
TMT产业—电子半导体
|
|
2015年全球及中国硬质PCB行业研究报告 |
 |
字数:3.2万 |
页数:190 |
图表数:248 |
|
中文电子版:9000元 |
中文纸版:4500元 |
中文(电子+纸)版:9500元 |
|
英文电子版:2500美元 |
英文纸版:2700美元 |
英文(电子+纸)版:2800美元 |
|
编号:ZYW198
|
发布日期:2015-03 |
附件:下载 |
 |
|
|
《2014-2015年全球及中国硬质PCB行业研究报告》包含以下内容:
1、PCB产业分析
2、PCB下游市场分析
3、PCB厂家横向对比
4、35家典型PCB厂家研究
2014年对大部分PCB厂家来说都是美好的一年,整个PCB产业产值达到596亿美元,比2013年增长3.7%,是自2011年以来增长最快的一年。展望2015年,大宗商品暴跌,尤其铜价大跌,将大大降低PCB厂家的原材料成本,PCB厂家的利润率有望继续提高。
2014年关键的PCB制造地区,欧元、台币和日元都显著贬值,而韩元反而升值,这不仅严重打击了韩国PCB企业的竞争力,也让韩国PCB企业面临利润下滑。韩国PCB企业无一例外收入和利润率全面下滑,即使龙头厂家三星旗下的SEMCO也不例外,PCB业务收入下滑2.4%,而IC Carrier业务下滑19%,营业利润率从大约9%跌到不足1%。
台湾企业和欧洲企业则受益于货币贬值,利润率大增。日本企业由于一半以上的生产基地都位于海外,因此并未从日元贬值中获益,但还是比韩国企业好不少。
2014年硬质PCB领域HDI仍然是主要增长动力,预计2015年仍然能维持成长。由于手机屏幕变大,带动手机PCB板面积也变大,为了保持手机轻薄,更先进的Anylayer HDI需求大增。Anylayer HDI工艺耗费工时长,消耗产能大,加上日本松下退出Anylayer HDI领域,各大PCB厂家都在2015年扩展Anylayer HDI产能。2014年HDI PCB 业务收入增长最大的是台湾的Compeq,增长28.3%,达到6.9亿美元,与龙头厂家Unimicron只有一步之遥,Compeq拥有苹果和小米两大客户,业绩极佳。
2014年另一个亮点是服务器用PCB,随着网络经济的进一步深入,大数据时代到来,以及资金疯狂流入网络新经济,服务器需求火爆。服务器用PCB板要求高Tg低Loss,层数越来越高,最高达28层,这也使得服务器PCB的单价从2009年开始一直在上升。专注于服务器PCB的企业如台湾的楠梓电和ACCL取得了不错的成绩,楠梓电子收入增长20%,ACCL收入增长27%。
光电板领域,LED照明拉动散热良好的金属PCB需求,擅长金属PCB的台湾T.P.T、GIA TZOONG,中国大陆的景旺都有不错的增长。汽车PCB也表现可以。
2014年PCB行业最大事件是TTM与Viasystems合并,合并后的企业是绝对的硬板PCB第一名,总收入在25亿美元左右。TTM擅长手机和网络通讯领域,Viasystems则擅长汽车和工业领域,两者完美互补。
Global and China Rigid PCB Industry Report, 2014-2015 highlights the followings:
1. PCB industry
2. PCB downstream market
3. Horizontal comparison of PCB companies
4. 35 typical PCB companies
2014 was a good year for majority of PCB companies, as output value of PCB industry touched USD59.6 billion, rising 3.7% against 2013, the fastest growth rate since 2011. Looking forward to 2015, a collapse in prices of commodities, especially in that of copper, will significantly reduce raw materials costs of PCB companies, thus further driving their profit margins.
In 2014, in key regions of PCB manufacturing, euro, NTD, and yen all depreciated sharply, while the won appreciated, dealing a heavy blow to South Korean PCB industry and cutting profit margins of the country’s PCB companies, which all suffered declines in revenue and profit margins, no exception for Samsung’s SEMCO, whose revenue from PCB business glided 2.4%, revenue from IC Carrier business dropped by 19%, and operating margin fell to below 1% from about 9%.
Taiwanese companies and European ones, benefiting from currency devaluation, saw a surge in profit margins, while Japanese peers didn’t gain from yen depreciation, as more than half of their production bases are located in foreign countries, but still performed better than South Korean counterparts.
HDI was still a main engine of growth in rigid PCB field in 2014, and is expected to maintain the momentum in 2015. As mobile phone screens become larger, PCB for mobile phone has to react accordingly. To ensure light weight and thinness of mobile phone, the demand for more advanced Anylayer HDI increases tremendously. As Anylayer HDI technology is time- and -capacity consuming, combined with Panasonic’s withdrawal from Anylayer HDI field, various PCB companies will expand Anylayer HDI capacity in 2015. In 2014, the company registered largest growth in revenue from HDI PCB business was Taiwanese Compeq, which boasts customers like Apple and Xiaomi with impressive performance, jumping by 28.3% to USD690 million, one step away from industry leader Unimicron.
Another spotlight in 2014 was PCB for server. With further penetration of internet economy, the coming of big data era, and influx of large amounts of capital into network economy, the demand for server ushers in explosive growth. PCB for server requires high Tg and low Loss, with layer growing more higher, up to 28, driving continuous increase in unit price of PCB for server since 2009. The companies that specialize in PCB for server, such as Taiwanese WUS Printed Circuit and ACCL, accomplished good results, with WUS Printed Circuit’s revenue ascending by 20% and ACCL’s 27%.
Regarding rigid PCB, LED lighting stimulated demand for metal PCB with good heat elimination performance. Taiwanese T.P.T, GIA TZOONG, and mainland Chinese Shenzhen Kinwong Electronic, which are skilled in metal PCB, all enjoyed a decent level of growth. In addition, PCB for automobile also did a good performance.
The most sensational event in PCB industry in 2014 was the merger of TTM and Viasystems. The combined company is absolutely No. 1 manufacturer with total revenue approximating USD2.5 billion. TTM enjoys a strong position in cellular phone and networking/telecom, and Viasystems in automotive and industrial fields, showing a perfect complementation.
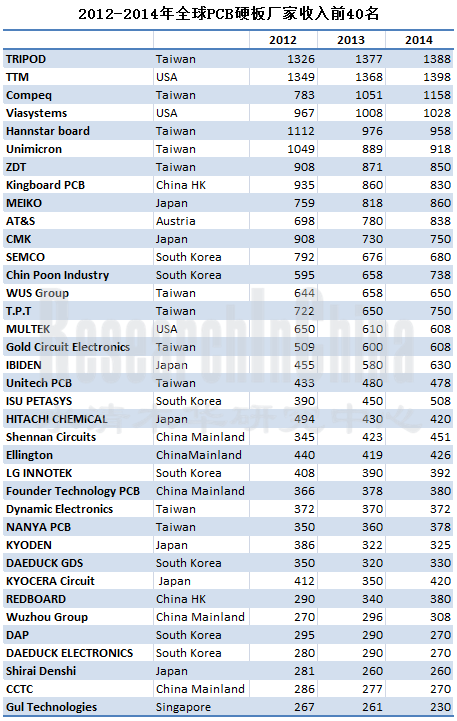
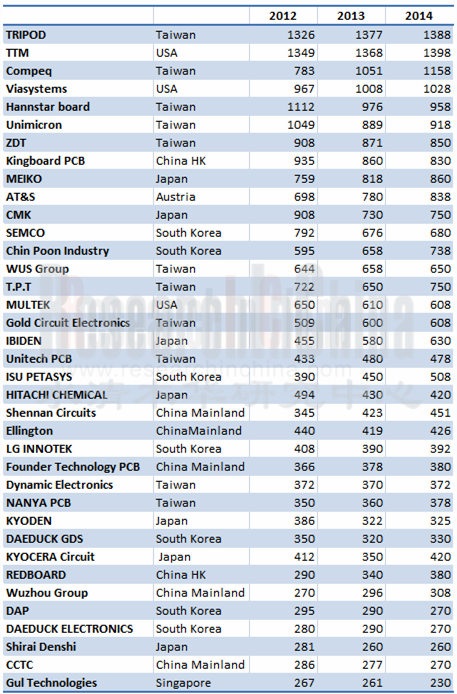
Global Top 40 Rigid PCB Companies by Revenue, 2012-2014
(USD mln)
第一章、PCB产业概况
1.1、全球PCB产业产值
1.2、PCB产业近况与未来趋势
1.3、台湾PCB产业
1.4、中国大陆PCB产业
1.4.1、中国大陆PCB产业规模
1.4.2、中国大陆PCB政策
1.5、大陆PCB厂家排名
1.6、欧洲PCB产业
1.7、北美PCB产业
1.8、日本PCB产业
第二章、PCB下游市场
2.1、全球手机市场
2.2、全球智能手机市场
2.3、中国手机市场
2.4、平板电脑市场
2.5、笔记本电脑市场
第三章、PCB产业分析
3.1、PCB技术趋势
3.1.1、手机PCB厂家排名
3.1.2、手机PCB配套关系
3.2、内存模块PCB
3.3、光电板
3.4、汽车电子PCB
3.5、笔记本电脑PCB
3.6、全球PCB厂家排名
第四章、主要PCB厂家研究
4.1、欣兴
4.2、华通
4.3、瀚宇博德
4.4、金像电子
4.5、健鼎
4.6、名幸MEIKO
4.7、CMK
4.7.1、无锡希门凯
4.7.2、瑞升科技
4.7.3、旗利得电子
4.8、IBIDEN
4.9、大德电子
4.10、TTM
4.11、耀华
4.12、AT&S
4.13、建滔
4.13.1、依利安达
4.13.2、科惠线路板
4.13.3、扬宣电子Express Electronics
4.14、SIMMTECH
4.15、志超T.P.T
4.16、依顿电子
4.17、敬鹏
4.18、LG INNOTEK
4.19、SEMCO
4.20、方正电路板
4.21、高德电子
4.22、定颖
4.23、惠亚
4.24、南亚电路板
4.25、深南电路
4.26、沪士电子
4.27、超声电子
4.28、臻鼎ZDT
4.29、MULTEK
4.30、景硕
4.31、SHINKO
4.32、ISU PETASYS
4.33、KYOCERA CIRCUIT SOLUTIONS
4.34、景旺电子KINWONG
4.35、博智电子
1. Overview of PCB Industry
1.1 Output Value of Global PCB Industry
1.2 Recent Developments and Future Trends of PCB Industry
1.3 PCB Industry in Taiwan
1.4 PCB Industry in Mainland China
1.4.1 Industrial Scale
1.4.2 Policy
1.5 Ranking of Chinese Mainland PCB Vendors
1.6 PCB Industry in Europe
1.7 PCB Industry in North America
1.8 PCB Industry in Japan
2. PCB Downstream Market
2.1 Global Mobile Phone Market
2.2 Global Smartphone Market
2.3 Chinese Mobile Phone Market
2.4 Tablet PC Market
2.5 Laptop Computer Market
3. Analysis of PCB Industry
3.1 PCB Technology Trends
3.1.1 Ranking of PCB Companies for Mobile Phone
3.1.2 Supporting Relationship of Mobile Phone PCB
3.2 Memory Module PCB
3.3 Rigid PCB
3.4 PCB for Automotive Electronics
3.5 PCB for Laptop Computer
3.6 Ranking of Global PCB Companies
4. Major PCB Companies
4.1 Unimicron
4.2 Compeq
4.3 HannStar Board
4.4 Gold Circuit Electronics
4.5 Tripod Technology
4.6 Meiko
4.7 CMK
4.7.1 WUXI CMK
4.7.2 CMK GBM
4.7.3 CMKC DONGGUAN
4.8 IBIDEN
4.9 Daeduck Electronics
4.10 TTM
4.11 Unitech PCB
4.12 AT&S
4.13 Kingboard
4.13.1 Elec&Eltek
4.13.2 Tech-Wise Circuit
4.13.3 Express Electronics
4.14 SIMMTECH
4.15 T.P.T
4.16 Ellington Electronics
4.17 Chinpoon Industrial
4.18 LG INNOTEK
4.19 SEMCO
4.20 Founder PCB
4.21 Gul Technologies
4.22 Dynamic Electronics
4.23 Viasystems
4.24 Nanya PCB
4.25 Shennan Circuit
4.26 WUS Printed Circuit
4.27 Guangdong Goworld
4.28 ZDT
4.29 Multek
4.30 Kinsus
4.31 Shinko
4.32 ISU PETASYS
4.33 KYOCERA CIRCUIT SOLUTIONS
4.34 Shenzhen Kinwong Electronic
4.35 Allied Circuit
2001-2015年PCB产业产值
1980-2001年全球PCB产值
PCB产业链
2009-2015年PCB产业收入分布(分技术)
2013年全球PCB产值by layer
2013-2015年全球PCB产业收入地域分布
2012-2014年全球PCB产业收入地域分布
2010-2013年台湾PCB产业收入产品分布
2010-2011年中国大陆PCB企业投资结构
2011-2013年大陆PCB产业产值技术分布
2013年大陆PCB厂家收入排名
2013 European PCB Production by End Market
2013年欧洲PCB厂家收入国别分布
2000-2013年欧洲PCB厂家收入国别分布
2009-2013年欧洲主要PCB厂家季度收入
2005-2017年欧洲PCB厂家产值增幅
2013年欧洲TOP50 -PCB厂家
2008年1季度-2014年1季度北美主要PCB厂家收入
2005-2017年北美PCB产值增幅
2001-2014年日本PCB产值地域分布
2014年日本PCB产值By layer
2007-2015年全球手机出货量
2011-2014年全球3G/4G手机出货量地域分布
Worldwide Mobile Phone Sales to End Users by Vendor in 2013 (Thousands of Units)
2014年3季度全球十大手机厂家出货量
Worldwide Smartphone Sales to End Users by Vendor in 2013 (Thousands of Units)
Worldwide Smartphone Sales to End Users by Operating System in 2013 (Thousands of Units)
2013-2015年全球Top 13智能手机厂家出货量
2014年3季度主要智能手机厂家出货量
2013年1月-2014年12月中国手机市场月度出货量
2014年中国智能手机市场主要厂家市场占有率
2014年中国4G手机市场主要厂家市场占有率
2011-2016年全球平板电脑出货量
Top Five Tablet Vendors, Shipments Fourth Quarter 2014
Top Five Tablet Vendors, Shipments, Market Share, and Growth, Calendar Year 2014
2008-2015年笔记本电脑出货量
2010-2014年全球主要笔记本电脑ODM厂家出货量
2012-2014年主要HDI厂家收入排名
2010-2013年NOKIA手机PCB供应商供应比例
2010-2013年SAMSUNG手机PCB供应商供应比例
2012年LG手机PCB供应商供应比例
2010-2013年ZTE手机PCB供应商供应比例
2010-2011年RIM手机PCB供应商供应比例
2010-2013年APPLE PCB供应商供应比例
2012-2014年主要HDI厂家收入排名
2014年1季度全球DRAM厂家收入排名
2014年1季度全球DRAM厂家市场占有率
2014年1季度NAND厂家市场占有率
2010-2013年内存PCB厂家市场占有率
2006\2010\2011\2012年光电板主要厂家市场占有率
2010-2014年汽车电子PCB厂家收入市场占有率
2011-2014年笔记本电脑PCB板主要厂家市场占有率(按出货量)
服务器PCB供应链
服务器PCB技术Roadmap
2014年全球服务器PCB主要厂家市场占有率
2012-2014年全球PCB硬板厂家收入前40名
2012-2014年主要PCB厂家毛利率
2012-2014年25大PCB厂家营业利润率
欣兴组织结构
2003-2014年欣兴收入与毛利率
2009-2014年欣兴收入与营业利润率
2012年1季度-2014年4季度欣兴季度收入与毛利率
2010-2014年欣兴销售额技术分布Sales Breakdown by Technology
2010-2014年欣兴收入下游应用分布Sales Breakdown by Application
2010-2014欣兴产能Capacity
2004-2013年欣兴CAPEX
2013年欣兴大陆子公司财务数据
2006-2014年华通收入与毛利率
2009-2014年华通收入与营业利润率
2013年1月-2015年1月华通每月收入与增幅
2009-2013年华通主要子公司财务数据
瀚宇博德关系企业图
2006-2014年瀚宇博德收入与毛利率
2009-2014年瀚宇博德收入与营业利润率
2013年1月-2015年1月瀚宇博月度收入与增幅
2009-2012年瀚宇博收入下游应用分布
2009-2012年瀚宇博收入Layer分布
2011年瀚宇博德主要子公司财务数据
2013年瀚宇博德主要子公司财务数据
2005-2015年金像电子收入与毛利率
2009-2014年金像电子收入与营业利润率
2013年1月-2015年1月金像电子 每月收入与增幅
2010-2012年金像电子收入产品分布
2006-2014年健鼎收入与毛利率
2009-2015年健鼎收入与营业利润率
2013年健鼎收入by application
2013年健鼎收入by layer
2013年1月-2015年1月健鼎每月收入与增幅
2006-2011年健鼎产能
2013年健鼎大陆子公司财务数据
2006-2015财年名幸电子收入与运营利润率
FY 2014名幸电子营业利润分析
2009-2014财年名幸电子大陆子公司收入与运营利润率
2015财年名幸电子大陆子公司收入与运营利润率
2013财年-2015财年名幸电子收入下游应用分布
2010财年-2015财年名幸电子收入技术分布by layer
2005-2015财年CMK收入与运营利润率
2007-2015财年CMK收入下游应用分布
2007-2015财年 CMK收入by layer
2007-2014财年 CMK收入地域分布
2003-2010年无锡希门凯收入与产量
2006-2015财年IBIDEN收入与运营利润率
2006-2015财年IBIDEN收入业务分布
2012年2季度-2014年2季度IBIDEN季度收入业务分布
2012年2季度-2014年2季度IBIDEN季度营业利润业务分布
2010-2015财年ibiden电子事业部收入产品分布
2010-2015财年ibiden CAPEX与depreciation
2005-2014年大德电子收入与运营利润率
2009-2014年大德电子收入by bunesiss
2005-2014年大德GDS收入与运营利润率
2010-2014年大德GDS收入业务分布
2005-2014年TTM收入与运营利润率
TTM +Viasystems 收入下游分布
2013年1季度-2014年4季度TTM季度收入地域分布
2013年1季度-2014年4季度TTM季度收入与毛利率
2014年TTM客户分布
2011-2013年TTM收入地域分布
2013年TTM Revenues by technology
2008-2014年TTM收入下游应用分布
TTM全球工厂分布
2006-2014年耀华收入与毛利率
2009-2015年耀华收入与营业利润率
2013年1月-2015年1月耀华每月收入与增幅
硬板技术路线图
软硬板技术路线图
上海展华电子2010、2013 财务数据
FY2005-FY2015 AT&S与EBITDA率
AT&S重庆substrate厂ramp
FY2014 AT&S收入业务与地域分布
FY2015 AT&S收入业务与地域分布
Q2/13-Q4/14 AT&S Mobile Devices & Substrates业务季度收入
AT&S Mobile Devices & Substrates业务主要客户
Q2/13-Q4/14 AT&S Industrial & Automotive 业务季度收入
2010-2015 AT&S员工数量
2010-2015 AT&S CAPEX
建滔集团组织结构
2002-2014年建滔集团收入与股东应占利润率
2009-2014年建滔集团收入与税前利润率
2008-2014年建滔集团收入业务分布
依利安达组织结构
2005-2014年依利安达收入与运营利润率
2009-2013年依利安达资产负债表
2006-2013年依利安达收入地域分布
2006-2013年依利安达收入技术分布by layer
依利安达各厂产能
依利安达技术能力
2009-2013年Express Electronics东莞厂收入
2009-2013年Express Electronics苏州厂收入
SIMM TECH组织结构
2004-2014年SIMMTECH收入与运营利润率
2009-2014年SIMMTECH收入、毛利率与净利率
2013-2015年SIMMTECH 收入产品分布
2013年1季度-2014年4季度SIMMTECH季度毛利率与运营利润率
2013年1季度-2014年4季度SIMMTECH季度出货量
2012-2015年SIMMTECH出货量
2013年1季度-2014年4季度SIMMTECH季度产能利用率
2012-2015年SIMMTECH产能利用率
2008-2014年SIMMTECH收入by application
2012-2014年SIMMTECH Substrate收入by application
SIMMTECH厂区
2005-2014年志超收入与毛利率
2005-2015年志超收入与营业利润率
2013年1月-2015年1月志超每月收入与增幅
2014年志超客户结构
2014年志超收入下游分布
TPT大陆子公司2013财务数据
依顿电子股权结构
2007-2014年依顿电子收入与毛利率
2009-2014年 依顿电子收入Layer分布
2009-2012H1 依顿电子收入by application
2009-2012依顿电子收入by Region
2005-2013年敬鹏收入与毛利率
2005-2015年敬鹏收入与营业利润率
2013年1月-2015年1月敬鹏每月收入与增幅
2006-2015年LG INNOTEK收入与运营利润率
2012年1季度-2014年4季度LG INNOTEK收入与运营利润率
2011-2015年LG INNOTEK 收入业务分布
2011-2015年LG INNOTEK 运营利润业务分布
2009-2014年SEMCO收入与营业利润率
2010-2014年SEMCO收入部门分布
2013年1季度-2014年4季度SEMCO ACI事业部收入与运营利润率
2014年1季度-2014年4季度SEMCO HDI 与PKG收入
2007-2014年方正PCB收入与运营利润率
2013年方正PCB子公司财务数据
2010年方正PCB下游应用分布
方正重庆厂产能
珠海方正一厂产能
珠海方正三厂产能
珠海方正五厂产能
方正杭州二厂产能by technology
珠海方正四厂产能
方正HDI技术能力
2005-2013年高德电子收入与运营利润
高德电子关系企业
2006-2014年定颖收入与毛利率
2009-2014年定颖收入与营业利润率
2013年1月-2015年1月定颖每月收入与增幅
2009-2012年定颖产能
2006-2014年惠亚收入与运营利润率
2008-2014年惠亚收入业务分布
惠亚全球分布
2008-2014惠亚集团收入下游应用分布
惠亚主要客户
DDI收入地域和终端市场分布
DDI工厂分布
DDI主要客户
南亚电路板组织结构
2006-2014年南亚电路板收入与毛利率
2009-2015年南亚电路板收入与营业利润率
2013年1月-2015年1月南亚电路板每月收入与增幅
南亚电路板产能与全球分布
深南电路技术能力
2007-2014年沪士电子收入与运营利润
2010-2014年沪士电子收入by layer
2007-2014年沪士电子收入下游分布
2012-2014年沪士电子毛利率by applicati
2013年沪士电子主要客户
2005-2014年超声电子收入与运营利润率
超声电子组织结构
2007-2014年超声电子收入业务分布
2007-2013年超声电子产量
ZDT Holding Structure
2008-2015年臻鼎收入与运营利润率
2008-2014年臻鼎收入与毛利率
2013年1月-2015年1月ZDT月度收入
ZDT Global Footprint
2006-2014 ZDT Number of Employees
2011-2013年Multek ELIC技术路线图
2011-2013年Multek 软硬板 技术路线图
2011-2013年Multek Microvias技术路线图
2004-2014年景硕收入与毛利率
2009-2015年景硕收入与营业利润率
2013年1月-2015年1月景硕每月收入与增幅
2011-2014年景硕收入产品分布
2011年景硕收入下游应用分布
Q1/2014景硕收入BY Applications
Q4/2014景硕收入BY Applications
2013\2014 KINSUS客户分布
FY207-FY2015 Shinko收入与净利润
2010-2015财年Shinko收入业务分布
2008-2014年ISU PETASYS收入与营业利润率
2012-2014年ISU PETASYS收入by technology
2011-2015年景旺电子收入与营业利润
2011-2014年景旺电子产能与产量
2011-2014年景旺电子收入by layer
2011-2014年景旺电子收入by end market
2011-2014年景旺电子产品ASP
2011-2014年景旺电子客户分布
2011-2014年景旺电子原材料成本结构
2011-2014年景旺电子原材料价格
2011-2014年景旺电子主要供应商
景旺电子2014年6月底主要设备
2009-2014年博智电子收入与毛利率
2009-2014年博智电子产品平均售价
2013年1月-2015年1月博智电子月度收入
2012-2014年博智电子出货量下游分布
Output Value of PCB Industry, 2001-2015E
Global PCB Output Value, 1980-2001
PCB Industry Chain
Revenue Breakdown of PCB Industry by Technology, 2009-2015E
Global PCB Output Value by Layer, 2013
Revenue of Global PCB Industry by Region, 2013-2015E
Revenue of Global PCB Industry by Region, 2012-2014
Revenue of PCB Industry in Taiwan by Product, 2010-2013
Investment Structure of PCB Companies in Mainland China, 2010-2011
Output Value of PCB Industry in Mainland China by Technology, 2011-2013
Ranking of Chinese Mainland PCB Vendors by Revenue, 2013
European PCB Production by End Market, 2013
Revenue of European PCB Vendors by Country, 2013
Revenue of European PCB Vendors by Country, 2000-2013
Quarterly Revenue of Major European PCB Vendors, 2009-2013
Output Value Growth of European PCB Vendors, 2005-2017E
TOP 50 PCB Vendors in Europe, 2013
Revenue of Major North American PCB Vendors, 2008 Q1-2014 Q1
Growth Rate of North American PCB Output Value, 2005-2017E
Geographical Distribution of Japanese PCB Output Value, 2001-2014
Japanese PCB Output Value by Layer, 2014
Global Mobile Phone Shipments, 2007-2015E
Geographical Distribution of Global 3G/4G Mobile Phone Shipments, 2011-2014
Worldwide Mobile Phone Sales to End Users by Vendor in 2013 (Thousands of Units)
Shipments of Global Top10 Mobile Phone Vendors, 2014 Q3
Worldwide Smartphone Sales to End Users by Vendor in 2013 (Thousands of Units)
Worldwide Smartphone Sales to End Users by Operating System in 2013 (Thousands of Units)
Global Top13 Smartphone Vendors by Shipment, 2013-2015E
Shipments of Major Smartphone Vendors, 2014 Q3
Monthly Mobile Phone Shipments in China, Jan 2013-Dec 2014
Market Share of Major Vendors in Chinese Smartphone Market, 2014
Market Share of Major Vendors in Chinese 4G Mobile Phone Market, 2014
Global Tablet PC Shipments, 2011-2016E
Shipments of Top5 Tablet PC Vendors, 2014 Q4
Shipments, Market Share, and Growth of Top5 Tablet PC Vendors, 2014
Laptop Computer Shipments, 2008-2015E
Shipments of Global Major Laptop Computer ODM Companies, 2010-2014
Ranking of Major HDI Vendors by Revenue, 2012-2014
Supply Structure of PCB for NOKIA Mobile Phone, 2010-2013
Supply Structure of PCB for SAMSUNG Mobile Phone, 2010-2013
Supply Structure of PCB for LG Mobile Phone, 2012
Supply Structure of PCB for ZTE Mobile Phone, 2010-2013
Supply Structure of PCB for RIM Mobile Phone, 2010-2011
Supply Structure of PCB for APPLE, 2010-2013
Ranking of Major HDI Vendors by Revenue, 2012-2014
Ranking of Global DRAM Vendors by Revenue, 2014 Q1
Market Share of Global DRAM Vendors, 2014 Q1
Market Share of NAND Vendors, 2014 Q1
Market Share of Memory Module PCB Vendors, 2010-2013
Market Share of Major Rigid PCB Vendors, 2006/2010/2011/2012
Market Share of PCB Vendors for Automotive Electronics, 2010-2014
Market Share of Major PCB Vendors for Laptop Computer by Shipment, 2011-2014
Supply Chain of Server PCB
Technology Roadmap of Server PCB
Market Share of Global Major Server PCB Vendors, 2014
Global Top40 Rigid PCB Vendors, 2012-2014
Gross Margin of Major PCB Vendors, 2012-2014
Operating Margin of Top25 PCB Vendors, 2012-2014
Organizational Structure of Unimicron
Revenue and Gross Margin of Unimicron, 2003-2014
Revenue and Operating Margin of Unimicron, 2009-2014
Quarterly Revenue and Gross Margin of Unimicron, 2012 Q1-2014 Q4
Sales Breakdown of Unimicron by Technology, 2010-2014
Sales Breakdown of Unimicron by Application, 2010-2014
Capacity of Unimicron, 2010-2014
CAPEX of Unimicron, 2004-2013
Financial Data of Unimicron’s Subsidiaries in Mainland China, 2013
Revenue and Gross Margin of Compeq, 2006-2014
Revenue and Operating Margin of Compeq, 2009-2014
Monthly Revenue and Growth Rate of Compeq, Jan 2013-Jan 2015
Financial Data of Major Subsidiaries under Compeq, 2009-2013
Diagram of Associated Companies of HannStar Board
Revenue and Gross Margin of HannStar Board, 2006-2014
Revenue and Operating Margin of HannStar Board, 2009-2014
Monthly Revenue and Growth Rate of HannStar Board, Jan 2013-Jan 2015
Revenue Breakdown of HannStar Board by Application, 2009-2012
Revenue Breakdown of HannStar Board by Layer, 2009-2012
Financial Data of Major Subsidiaries under HannStar Board, 2011
Financial Data of Major Subsidiaries under HannStar Board, 2013
Revenue and Gross Margin of Gold Circuit Electronics, 2005-2015E
Revenue and Operating Margin of Gold Circuit Electronics, 2009-2014
Monthly Revenue and Growth Rate of Gold Circuit Electronics, Jan 2013-Jan 2015
Revenue Breakdown of Gold Circuit Electronics by Product, 2010-2012
Revenue and Gross Margin of Tripod Technology, 2006-2014
Revenue and Operating Margin of Tripod Technology, 2009-2015E
Revenue Breakdown of Tripod Technology by Application, 2013
Revenue Breakdown of Tripod Technology by Layer, 2013
Monthly Revenue and Growth Rate of Tripod Technology, Jan 2013-Jan 2015
Capacity of Tripod Technology, 2006-2011
Financial Data of Tripod Technology’s Subsidiaries in Mainland China, 2013
Revenue and Operating Margin of Meiko, FY2006-FY2015E
Operating Income of Meiko, FY 2014
Revenue and Operating Margin of Meiko’s Subsidiaries in Mainland China, FY2009-FY2014
Revenue and Operating Margin of Meiko’s Subsidiaries in Mainland China, FY2015E
Revenue Breakdown of Meiko by Application, FY2013-FY2015E
Revenue Breakdown of Meiko by Layer, FY2010-FY2015E
Revenue and Operating Margin of CMK, FY2005-FY2015E
Revenue Breakdown of CMK by Application, FY2007-FY2015E
Revenue Breakdown of CMK by Layer, FY2007-FY2015E
Revenue Breakdown of CMK by Region, FY2007-FY2014
Revenue and Output of WUXI CMK, 2003-2010
Revenue and Operating Margin of IBIDEN, FY2006-FY2015E
Revenue Breakdown of IBIDEN by Business, FY2006-FY2015E
Quarterly Revenue Breakdown of IBIDEN by Business, 2012 Q2-2014 Q2
Quarterly Operating Income of IBIDEN by Business, 2012 Q2-2014 Q2
Revenue Breakdown of IBIDEN’s Electronics Division by Product, FY2010-FY2015E
CAPEX and Depreciation of IBIDEN, FY2010-FY2015E
Revenue and Operating Margin of Daeduck Electronics, 2005-2014
Revenue Breakdown of Daeduck Electronics by Business, 2009-2014
Revenue and Operating Margin of Daeduck GDS, 2005-2014
Revenue Breakdown of Daeduck GDS by Business, 2010-2014
Revenue and Operating Margin of TTM, 2005-2014
Revenue Breakdown of TTM +Viasystems by Application
Quarterly Revenue Breakdown of TTM by Region, 2013 Q1-2014 Q4
Quarterly Revenue and Gross Margin of TTM, 2013 Q1-2014 Q4
Distribution of TTM’s Customers, 2014
Revenue Breakdown of TTM by Region, 2011-2013
Revenue Breakdown of TTM by Technology, 2013
Revenue Breakdown of TTM by Application, 2008-2014
Global Distribution of TTM’s Factories
Revenue and Gross Margin of Unitech PCB, 2006-2014
Revenue and Operating Margin of Unitech PCB, 2009-2015E
Monthly Revenue and Growth Rate of Unitech PCB, Jan 2013-Jan 2015
Technology Roadmap for Rigid PCB
Technology Roadmap for Flexible PCB
Financial Data of Shanghai Unitech Electronics, 2010&2013
EBITDA of AT&S, FY2005-FY2015E
Ramp-up of AT&S’ Substrate Plant in Chongqing
Revenue Breakdown of AT&S by Business and Region, FY2014
Revenue Breakdown of AT&S by Business and Region, FY2015
Quarterly Revenue of AT&S Mobile Devices & Substrates, Q2/13-Q4/14
Main Customers of AT&S Mobile Devices & Substrates
Quarterly Revenue of AT&S Industrial & Automotive, Q2/13-Q4/14
Number of Employees of AT&S, 2010-2015E
CAPEX of AT&S, 2010-2015E
Organizational Structure of Kingboard
Revenue and Margin of Profit Attributable to Equity Shareholders of Kingboard, 2002-2014
Revenue and Pretax Profit Margin of Kingboard, 2009-2014
Revenue Breakdown of Kingboard by Revenue, 2008-2014
Organizational Structure of Elec&Eltek
Revenue and Operating Margin of Elec&Eltek, 2005-2014
Balance Sheets of Elec&Eltek, 2009-2013
Revenue Breakdown of Elec&Eltek by Region, 2006-2013
Revenue Breakdown of Elec&Eltek by Layer, 2006-2013
Capacities of Elec&Eltek’s Plants
Technological Capability of Elec&Eltek
Revenue of Express Electronics from Dongguan Plant, 2009-2013
Revenue of Express Electronics from Suzhou Plant, 2009-2013
Organizational Structure of SIMMTECH
Revenue and Operating Margin of SIMMTECH, 2004-2014
Revenue, Gross Margin and Net Profit Margin of SIMMTECH, 2009-2014
Revenue Breakdown of SIMMTECH by Product, 2013-2015E
Quarterly Gross Margin and Operating Margin of SIMMTECH, 2013 Q1-2014 Q4
Quarterly Shipments of SIMMTECH, 2013 Q1-2014 Q4
Shipments of SIMMTECH, 2012-2015E
Quarterly Capacity Utilization of SIMMTECH, 2013 Q1-2014 Q4
Capacity Utilization of SIMMTECH, 2012-2015E
Revenue Breakdown of SIMMTECH by Application, 2008-2014
Revenue Breakdown of SIMMTECH from Substrate by Application, 2012-2014
SIMMTECH’s Factories
Revenue and Gross Margin of T.P.T, 2005-2014
Revenue and Operating Margin of T.P.T, 2005-2015E
Monthly Revenue and Growth Rate of T.P.T, Jan 2013-Jan 2015
Customer Structure of T.P.T, 2014
Revenue Breakdown of T.P.T by Application, 2014
Financial Data of T.P.T’s Subsidiaries in Mainland China, 2013
Equity Structure of Ellington Electronics
Revenue and Gross Margin of Ellington Electronics, 2007-2014
Revenue Breakdown of Ellington Electronics by Layer, 2009-2014
Revenue Breakdown of Ellington Electronics by Application, 2009-2012H1
Revenue Breakdown of Ellington Electronics by Region, 2009-2012
Revenue and Gross Margin of Chinpoon Industrial, 2005-2013
Revenue and Operating Margin of Chinpoon Industrial, 2005-2015E
Monthly Revenue and Growth Rate of Chinpoon Industrial, Jan 2013-Jan 2015
Revenue and Operating Margin of LG INNOTEK, 2006-2015E
Revenue and Operating Margin of LG INNOTEK, 2012 Q1-2014 Q4
Revenue Breakdown of LG INNOTEK by Business, 2011-2015E
Operating Income Breakdown of LG INNOTEK by Business, 2011-2015E
Revenue and Operating Margin of SEMCO, 2009-2014
Revenue Breakdown of SEMCO by Business Division, 2010-2014
Revenue and Operating Margin of SEMCO ACI Division, 2013 Q1-2014 Q4
SEMCO’s Revenue from HDI and PKG, 2014 Q1-2014 Q4
Revenue and Operating Margin of Founder PCB, 2007-2014
Financial Data of Subsidiaries under Founder PCB, 2013
Downstream Application of Founder PCB, 2010
Capacity of Founder PCB’s Factory in Chongqing
Capacity of Founder PCB’s No.1 Factory in Zhuhai
Capacity of Founder PCB’s No.3 Factory in Zhuhai
Capacity of Founder PCB’s No.5 Factory in Zhuhai
Capacity Breakdown of Founder PCB’s No.1 Factory in Hangzhou by Technology
Capacity of Founder PCB’s No.4 Factory in Zhuhai
HDI Technology Capability of Founder PCB
Revenue and Operating Income of Gul Technologies, 2005-2013
Associated Companies of Gul Technologies
Revenue and Gross Margin of Dynamic Electronics, 2006-2014
Revenue and Operating Margin of Dynamic Electronics, 2009-2014
Monthly Revenue and Growth Rate of Dynamic Electronics, Jan 2013-Jan 2015
Capacity of Dynamic Electronics, 2009-2012
Revenue and Operating Margin of Viasystems, 2006-2014
Revenue Breakdown of Viasystems by Business, 2008-2014
Global Distribution of Viasystems
Revenue Breakdown of Viasystems by Application, 2008-2014
Major Customers of Viasystems
Revenue Breakdown of DDI by Region and End Market
Distribution of DDI’s Factories
Major Customers of DDI
Organizational Structure of Nanya PCB
Revenue and Gross Margin of Nanya PCB, 2006-2014
Revenue and Operating Margin of Nanya PCB, 2009-2015E
Monthly Revenue and Growth Rate of Nanya PCB, Jan 2013-Jan 2015
Capacity and Global Distribution of Nanya PCB
Technology Capability of Nanya PCB
Revenue and Operating Income of WUS Printed Circuit, 2007-2014
Revenue Breakdown of WUS Printed Circuit by Layer, 2010-2014
Revenue Breakdown of WUS Printed Circuit by Application, 2007-2014
Gross Margin of WUS Printed Circuit by Application, 2012-2014
Major Customers of WUS Printed Circuit, 2013
Revenue and Operating Margin of Guangdong Goworld, 2005-2014
Organizational Structure of Guangdong Goworld
Revenue Breakdown of Guangdong Goworld by Business, 2007-2014
Output of Guangdong Goworld, 2007-2013
Organizational Structure of ZDT Holding
Revenue and Operating Margin of ZDT, 2008-2015E
Revenue and Gross Margin of ZDT, 2008-2014
Monthly Revenue of ZDT, Jan 2013-Jan 2015
ZDT Global Footprint
Number of Employees of ZDT, 2006-2014
Technology Roadmap of Multek’s ELIC, 2011-2013
Technology Roadmap of Rigid-Flex PCB of Multek, 2011-2013
Technology Roadmap of Multek’s Microvias, 2011-2013
Revenue and Gross Margin of Kinsus, 2004-2014
Revenue and Operating Margin of Kinsus, 2009-2015E
Monthly Revenue and Growth Rate of Kinsus, Jan 2013-Jan 2015
Revenue Breakdown of Kinsus by Product, 2011-2014
Revenue Breakdown of Kinsus by Application, 2011
Revenue Breakdown of Kinsus by Application, 2014 Q1
Revenue Breakdown of Kinsus by Application, 2014 Q4
Customer Distribution of Kinsus, 2013&2014
Revenue and Net Income of Shinko, FY2007-FY2015E
Revenue Breakdown of Shinko by Business, FY2010-FY2015E
Revenue and Operating Margin of ISU PETASYS, 2008-2014
Revenue Breakdown of ISU PETASYS, by Technology, 2012-2014
Revenue and Operating Margin of Shenzhen Kinwong Electronic, 2011-2015E
Capacity and Output of Shenzhen Kinwong Electronic, 2011-2014
Revenue Breakdown of Shenzhen Kinwong Electronic by Layer, 2011-2014
Revenue Breakdown of Shenzhen Kinwong Electronic by End Market, 2011-2014
ASP of Shenzhen Kinwong Electronic’s Products, 2011-2014
Customer Distribution of Shenzhen Kinwong Electronic, 2011-2014
Raw Materials Costs Structure of Shenzhen Kinwong Electronic, 2011-2014
Raw Materials Prices of Shenzhen Kinwong Electronic, 2011-2014
Major Suppliers of Shenzhen Kinwong Electronic, 2011-2014
Main Equipment of Shenzhen Kinwong Electronic, at the End of Jun 2014
Revenue and Gross Margin of Allied Circuit, 2009-2014
ASP of Allied Circuit’s Products, 2009-2014
Monthly Revenue of Allied Circuit, Jan 2013-Jan 2015
Downstream Distribution of Allied Circuit’s Shipments, 2012-2014
如果这份报告不能满足您的要求,我们还可以为您定制报告,请 留言说明您的详细需求。
|