|
|
|
报告导航:研究报告—
TMT产业—电子半导体
|
|
2015年全球及中国IC载板行业研究报告 |
 |
字数:1.7万 |
页数:130 |
图表数:160 |
|
中文电子版:8500元 |
中文纸版:4250元 |
中文(电子+纸)版:9000元 |
|
英文电子版:2200美元 |
英文纸版:2350美元 |
英文(电子+纸)版:2500美元 |
|
编号:ZYW200
|
发布日期:2015-03 |
附件:下载 |
 |
|
|
《2015年全球及中国IC载板行业研究报告》包含以下内容:
1、半导体与IC封装行业概况
2、IC载板下游市场分析
3、IC载板发展趋势
4、IC载板产业分析
5、12家IC载板厂家研究
6、6家IC载板周边厂家研究
IC载板(基板,Substrate)行业在2015年可能面临困境,一方面是FOWLP的日渐成熟,另一方面则是平板电脑销量下滑,智能手机增长乏力。另外,2013年的繁荣刺激企业在2014年大规模扩产,导致产能利用率不足。
对于手机和平板电脑领域为核心市场的FC-CSP基板面临来自FOWLP的强力竞争,FOWLP具备压倒性的优势,包括低封装高度(Low Profile),更高速度,更多I/O,更高集成度(Higher Integration),更简单的工艺(less processing step),最重要是无需载板,大幅度降低成本,IC载板占IC总成本的比例超过50%。
尽管FOWLP目前还不成熟,成本优势并不明显,但这已经是大势所趋,传统FC-CSP基板将不得不降价来与FOWLP竞争。一旦FOWLP成熟,那么FC-CSP基板的需求量会骤减60%以上。所以2015年,FC-CSP基板厂家必须大幅度降价来提前获得市场优势。预计2015年IC载板市场规模缩小7%,为71.2亿美元。
下游市场方面,大屏幕手机严重挤压平板电脑生存空间,平板电脑下滑明显。并且平板电脑功能单一,通常只是做儿童玩具,更新换代需求很少。智能手机领域,中国作为全球最大的智能手机市场,在2014年已经出现下滑。
2015年IC载板市场最大亮点是SiP封装基板,也就是智能手表,高端智能手表的核心元件必须采用SiP封装。Apple Watch内建二颗重要核心处理器,均采用SiP封装技术。Apple Watch最重要的SiP基板生产难度最高,价格比一般ARM处理器采用的晶片尺寸覆晶基板(FCCSP)高出4~5倍,订单则由南电(Nanya)、景硕(Kinsus)等台湾厂商分食。日月光(ASE)承接Apple Watch的S1晶片SiP封测业务。
此外,2015年PC市场也有可能回暖,因为平板电脑下滑也就意味着笔记本电脑市场复苏,笔记本电脑市场连续3年下滑后在2014年第一次增长,预计2015年继续增长。且笔记本电脑内建独立显卡比例大幅度升高,意味着GPU出货量大增。
IC载板应用市场中,表现较好的还有Memory市场。
Global and China IC Substrate Industry Report, 2015 highlights the followings:
1. Status quo of semiconductor and IC packaging industry
2. Analysis on downstream market of IC substrate
3. Development trend of IC substrate
4. Analysis on IC substrate industry
5. Research on 12 IC substrate vendors
6. Research on 6 IC substrate peripheral companies
IC substrate industry may be in a predicament in 2015, rooted in two aspects: first, the maturing of FOWLP; second, the tablet sales decline and sluggish smartphone growth. In addition, the prosperity of IC substrate industry in 2013 stimulated large-scale expansion of enterprises in 2014, thus leading to an insufficient rate of capacity utilization.
For FC-CSP substrate with mobile phone and tablet PC as the core market facing strong competition from FOWLP that has overwhelming superiorities including low profile, higher speed, more I/O, higher integration, less processing step, especially needing no substrate which slashes cost as IC substrate accounts for more than half of the total cost of IC.
Although it is in its infancy without obvious cost advantage, FOWLP has been an irresistible trend, the traditional FC-CSP substrate will have to reduce the price to enter a competition, and the demand for the latter will be sharply reduced by more than 60% once FOWLP matures. So in 2015, FC-CSP substrate vendors have to substantially reduce the price to gain market advantage in advance. It is expected that in 2015 the IC substrate market will encounter a 7% scale-down to USD7.12 billion.
In the downstream market, large screen mobile phone squeezed the living space of tablet PC which declined significantly. And the single-functional tablet PC is mostly used as a toy for children with less demand for replacement. In the field of smartphone, China as the world’s largest smartphone market declined in 2014.
SiP packaging substrate will be the highlight for IC substrate market in 2015 as core components of high-end smart watches must adopt SiP packaging. Both the two core processors built in Apple Watch use SiP packaging technology. The most important SiP substrate of Apple Watch calls for the most difficult production, priced 4-5 times higher than FCCSP applied to general ARM processor. The orders are shared by Nanya, Kinsus and other Taiwanese vendors. ASE undertakes Apple Watch’s SI chip SiP packaging business.
The PC market is also likely to recover in 2015 for tablet PC slump means the recovery of laptop computer market. Laptop computer market saw the first growth in 2014 after three consecutive years of decline and is expected to continue the trend in 2015. And laptop discrete graphics card accounts for a zooming proportion, signifying GPU shipments boost.
Another excellent performer in IC substrate applications is the memory market.
第一章、全球半导体产业
1.1、全球半导体产业概况
1.2、IC封装概况
1.3、IC封测产业概况
第二章、IC载板下游市场
2.1、IC载板简介
2.2、FLIP CHIP IC 载板
2.3、全球手机市场
2.4、全球智能手机市场
2.5、中国手机市场
2.6、平板电脑市场
2.7、CPU与GPU市场
2.8、内存市场
第三章、IC载板市场与产业
3.1、IC载板市场
3.2、WIDE IO/HMC MEMORY
3.3、EMBEDDED COMPONENT SUBSTRATE
3.4、EMBEDDED TRACE SUBSTRATE
3.5、手持设备IC封装 IC PACKAGING FOR HANDSET
3.5.1、手持设备IC封装现状
3.5.2、PoP封装
3.5.3、FOWLP
3.6、SIP封装
3.7、2.5D封装(SI/GLASS/ORGANIC INTERPOSER)
3.7.1、2.5D封装简介
3.7.2、2.5D封装应用
3.7.3、2.5D Interposer市场规模
3.7.4、2.5D 封装供应商
3.8、TSV(3D)封装
3.8.1、TSV封装设备
3.9、FC-PoP封装
3.10、IC载板产业
第四章、IC载板厂家研究
4.1、欣兴
4.2、IBIDEN
4.3、大德电子
4.4、SIMMTECH
4.5、LG INNOTEK
4.6、SEMCO
4.7、南亚电路板
4.8、景硕KINSUS
4.9、SHINKO
4.10、KYOCERA SLC
4.11、AT&S
4.12、珠海越亚封装基板
4.13、EASTERN
第五章、IC载板封装厂家研究
5.1、日月光
5.2、AMKOR
5.3、矽品精密
5.4、星科金朋
5.5、三菱瓦斯化学
5.6、AJINOMOTO
1. Global Semiconductor Industry
1.1 Overview
1.2 IC Packaging
1.3 IC Packaging and Testing
2. Downstream Market of IC Substrate
2.1 Introduction to IC Substrate
2.2 Flip Chip IC Substrate
2.3 Global Mobile Phone Market
2.4 Global Smartphone Market
2.5 Chinese Mobile Phone Market
2.6 Laptop Computer Market
2.7 CPU and GPU Market
2.8 Memory Market
3. IC Substrate Market and Industry
3.1 IC Substrate Market
3.2 Wide IO/HMC Memory
3.3 Embedded Component Substrate
3.4 Embedded Trace Substrate
3.5 IC Packaging for Portable Devices
3.5.1 Status Quo
3.5.2 PoP Packaging
3.5.3 FOWLP
3.6 SIP Packaging
3.7 2.5D Packaging (SI/Glass/Organic Interposer)
3.7.1 Introduction to 2.5D Packaging
3.7.2 Application of 2.5D Packaging
3.7.3 Market Size of 2.5D Interposer
3.7.4 Suppliers of 2.5D Packaging
3.8 TSV (3D) Packaging
3.8.1 TSV Packaging Equipment
3.9 FC-PoP Packaging
3.10 IC Substrate Industry
4. IC Substrate Vendors
4.1 Unimicron
4.2 IBIDEN
4.3 Daeduck Electronics
4.4 SIMMTECH
4.5 LG INNOTEK
4.6 SEMCO
4.7 Nan Ya PCB
4.8 KINSUS
4.9 SHINKO
4.10 KYOCERA SLC
4.11 AT&S
4.12 ACCESS
4.13 EASTERN
5. IC Substrate Packaging Companies
5.1 ASE
5.2 AMKOR
5.3 SPIL
5.4 STATS ChipPAC
5.5 Mitsubishi Gas Chemical Company
5.6 AJINOMOTO
1994-2019年全球半导体市场规模
2015年全球半导体市场增速
1998-2019年全球半导体市场下游分布
2009-2019年全球半导体市场地域分布
2000-2019年全球半导体企业Capital
2012-2016全球半导体设备市场地域分布
2010-2019年Wafer Process Equipment Sales by Product
2014年全球半导体产业收入Top30
主要电子产品使用IC的封装类型
2012-2017年全球IC Packaging and Testing市场规模
2012-2017年全球Outsourcing IC Packaging and Testing市场规模
2012-2017年全球IC Packaging 市场规模
2012-2017年全球IC Testing市场规模
2009-2013年台湾封测产业收入
2013年全球前10大封装企业收入
2007-2015年全球手机出货量
2011-2014年全球3G/4G手机出货量地域分布
Worldwide Mobile Phone Sales to End Users by Vendor in 2013 (Thousands of Units)
2014年3季度全球十大手机厂家出货量
Worldwide Smartphone Sales to End Users by Vendor in 2013 (Thousands of Units)
Worldwide Smartphone Sales to End Users by Operating System in 2013 (Thousands of Units)
2013-2015年全球Top 13智能手机厂家出货量
2014年3季度主要智能手机厂家出货量
2013年1月-2014年12月中国手机市场月度出货量
2014年中国智能手机市场主要厂家市场占有率
2014年中国4G手机市场主要厂家市场占有率
2011-2016年全球平板电脑出货量
Top Five Tablet Vendors, Shipments Fourth Quarter 2014
Top Five Tablet Vendors, Shipments, Market Share, and Growth, Calendar Year 2014
2008-2015年CPU与GPU出货量
2008-2015年笔记本电脑出货量
2010-2014年全球主要笔记本电脑ODM厂家出货量
2012-2016年内存市场规模
2009-2016年IC载板市场规模
2009-2016年IC载板分技术市场规模
IC载板具体应用产品
Mobile DRAM Trend
WIDE IO的优点
SK Hynix WIDE IO2 Roadmap
HMC Architecture
HMC BENEFITS
内嵌被动与主动元件主板的优点
Embedded Component Substrate Process
Comparison of Embedded Active & Passive Components
Roadmap of Embedded Passive Substrate
Structure Roadmap of Embedded Active Substrate
FOWLP and PLP Process Comparison
WHY EMBEDDED TRACE?
EMBEDDED TRACE Package Features
EMBEDDED TRACE Package Sweet Spot (for Wire Bonding)
EMBEDDED TRACE Package Sweet Spot (for FLIP CHIP)
Apple iPad 4 LTE A1459 IC Package Type List
PoP封装发展趋势
2.5D Interposer Manffacturing Revenue
2010-2017 Breakdown by interposer bulk material
TSV下游应用
TSV设备供应商
2012-2017年TSV封装设备分布
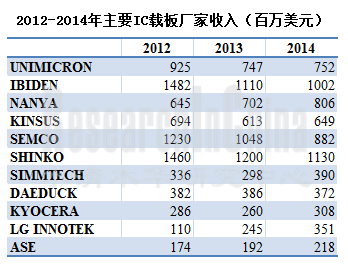
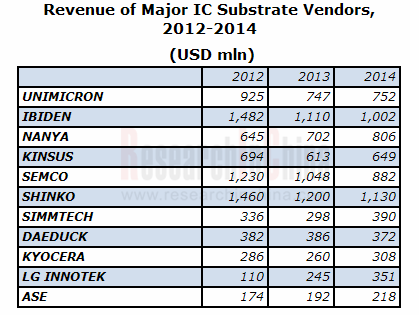
2010-2014年主要IC载板厂家收入
欣兴组织结构
2003-2014年欣兴收入与毛利率
2009-2014年欣兴收入与营业利润率
2012年1季度-2014年4季度欣兴季度收入与毛利率
2010-2014年欣兴销售额技术分布Sales Breakdown by Technology
2010-2014年欣兴收入下游应用分布Sales Breakdown by Application
2010-2014欣兴产能Capacity
2004-2013年欣兴CAPEX
欣兴历年合并
2006-2015财年IBIDEN收入与运营利润率
2006-2015财年IBIDEN收入业务分布
2012年2季度-2014年2季度IBIDEN季度收入业务分布
2012年2季度-2014年2季度IBIDEN季度营业利润业务分布
2010-2015财年ibiden电子事业部收入产品分布
2010-2015财年ibiden CAPEX与depreciation
2005-2014年大德电子收入与运营利润率
2009-2014年大德电子收入by bunesiss
2005-2014年大德GDS收入与运营利润率
2010-2014年大德GDS收入业务分布
SIMM TECH组织结构
2004-2014年SIMMTECH收入与运营利润率
2009-2014年SIMMTECH收入、毛利率与净利率
2009-2013年SIMMTECH资产负债表
2013-2015年SIMMTECH 收入产品分布
2013年1季度-2014年4季度SIMMTECH季度毛利率与运营利润率
2013年1季度-2014年4季度SIMMTECH季度出货量
2012-2015年SIMMTECH出货量
2013年1季度-2014年4季度SIMMTECH季度产能利用率
2012-2015年SIMMTECH产能利用率
2008-2014年SIMMTECH收入by application
2012-2014年SIMMTECH Substrate收入by application
SIMMTECH厂区
2006-2015年LG INNOTEK收入与运营利润率
2012年1季度-2014年4季度LG INNOTEK收入与运营利润率
2011-2015年LG INNOTEK 收入业务分布
2011-2015年LG INNOTEK 运营利润业务分布
2009-2014年SEMCO收入与营业利润率
2010-2014年SEMCO收入部门分布
2013年1季度-2014年4季度SEMCO ACI事业部收入与运营利润率
2014年1季度-2014年4季度SEMCO HDI 与PKG收入
南亚电路板组织结构
2006-2014年南亚电路板收入与毛利率
2009-2015年南亚电路板收入与营业利润率
2013年1月-2015年1月南亚电路板每月收入与增幅
南亚电路板产能与全球分布
2004-2014年景硕收入与毛利率
2009-2015年景硕收入与营业利润率
2013年1月-2015年1月景硕每月收入与增幅
2011-2014年景硕收入产品分布
2011年景硕收入下游应用分布
Q1/2014景硕收入BY Applications
Q4/2014景硕收入BY Applications
2013\2014 KINSUS客户分布
FY207-FY2015 Shinko收入与净利润
2010-2015财年Shinko收入业务分布
FY2005-FY2015 AT&S与EBITDA率
AT&S重庆substrate厂ramp
FY2014 AT&S收入业务与地域分布
FY2015 AT&S收入业务与地域分布
Q2/13-Q4/14 AT&S Mobile Devices & Substrates业务季度收入
AT&S Mobile Devices & Substrates业务主要客户
Q2/13-Q4/14 AT&S Industrial & Automotive 业务季度收入
AT&S Industrial & Automotive 业务主要客户
2010-2015 AT&S员工数量
2010-2015 AT&S CAPEX
日月光组织结构
2005-2015年日月光收入与毛利率
2009-2015年日月光收入与营业利润率
2013年1月-2015年1月日月光月度收入
2010-2014年ASE收入业务分布
2013年1季度-2014年4季度ASE封装部门收入与毛利率
2013年1季度-2014年4季度ASE封装部门收入类型分布
2013年1季度-2014年4季度ASE材料部门收入与毛利率
2013年1季度-2014年4季度ASE IC业务收入下游分布
2013年1季度-2014年4季度ASE EMS收入与毛利率
2013年1季度-2014年4季度ASE EMS收入breakdown
2005-2014年Amkor收入与毛利率、运营利润率
2007-2014年Amkor收入封装类型分布
2012-2014 Amkor Packaged units
2012-2014年Amkor收入下游分布
矽品精密工业组织结构
2003-2014年矽品收入、毛利率、运营利润率
2013年1月-2015年1月SPIL月度收入
2012年4季度-2014年4季度SPIL季度收入、毛利率与营业利润率
2005-2014年矽品收入地域分布
2005-2014年矽品收入下游应用分布
2005-2014年矽品收入业务分布
矽品2006-2014年产能统计
2004-2014年星科金朋收入与毛利率
2014年星科金朋资产负债表
2006-2013年星科金朋收入封装类型分布
2006-2013年星科金朋收入下游应用分布
2006-2013年星科金朋收入 地域分布
星科金朋全球分布
2014年星科金朋收入地域与业务分布
三菱瓦斯化学Organization Chart
2009-2015财年MGC收入与营业利润
2009-2015财年MGC收入by segment
2009-2015财年MGC operation income by segment
2009-2015财年MGC information and advanced material 部门Capex and Depreciation
ABF应用
ABF制造流程
ABF Construction
Outline of manufacturing substrate using ABF
Next build-up material in demand
Global Semiconductor Market Size, 1994-2019E
Global Semiconductor Market Growth Rate, 2015
Downstream Application of Global Semiconductor Market, 1998-2019E
Geographical Distribution of Global Semiconductor Market, 2009-2019E
Capital of Global Semiconductor Enterprises, 2000-2019E
Geographical Distribution of Global Semiconductor Equipment Market, 2012-2016E
Wafer Process Equipment Sales by Product, 2010-2019E
Top 30 of Global Semiconductor Industry by Revenue, 2014
IC Packaging Types Used by Major Electronic Products
Global IC Packaging and Testing Market Size, 2012-2017E
Global Outsourcing IC Packaging and Testing Market Size, 2012-2017E
Global IC Packaging Market Size, 2012-2017E
Global IC Testing Market Size, 2012-2017E
Revenue of Taiwan Packaging and Testing Industry, 2009-2013
Revenue of Top 10 Global Packaging Enterprises, 2013
Global Mobile Phone Shipments, 2007-2015E
Geographical Distribution of Global 3G/4G Mobile Phone Shipments, 2011-2014
Worldwide Mobile Phone Sales to End Users by Vendor in 2013
Shipments of Top 10 Global Mobile Phone Vendors, Q3 2014
Worldwide Smartphone Sales to End Users by Vendor in 2013
Worldwide Smartphone Sales to End Users by Operating System in 2013
Shipments of Top 13 Global Smartphone Vendors, 2013-2015E
Shipments of Major Smartphone Vendors, Q3 2014
Monthly Shipments of China Mobile Phone Market, 2013-2014
Market Share of Major Vendors in China Smartphone Market, 2014
Market Share of Major Vendors in China 4G Mobile Phone Market, 2014
Global Tablet PC Shipments, 2011-2016E
Top Five Tablet Vendors, Shipments Fourth Quarter 2014
Top Five Tablet Vendors, Shipments, Market Share, and Growth, Calendar Year 2014
CPU and GPU Shipments, 2008-2015E
Laptop Computer Shipments, 2008-2015E
Shipments of Major Global Laptop ODM Vendors, 2010-2014
Memory Market Size, 2012-2016E
IC Substrate Market Size, 2009-2016E
IC Substrate Market Size by Technology, 2009-2016E
Specific Application Products of IC Substrate
Mobile DRAM Trend
Advantages of WIDE IO
SK Hynix WIDE IO2 Roadmap
HMC Architecture
HMC BENEFITS
Advantages of Embedded Passive and Active Component Motherboard
Embedded Component Substrate Process
Comparison of Embedded Active & Passive Components
Roadmap of Embedded Passive Substrate
Structure Roadmap of Embedded Active Substrate
FOWLP and PLP Process Comparison
WHY EMBEDDED TRACE?
EMBEDDED TRACE Package Features
EMBEDDED TRACE Package Sweet Spot (for Wire Bonding)
EMBEDDED TRACE Package Sweet Spot (for FLIP CHIP)
Apple iPad 4 LTE A1459 IC Package Type List
Development Trend of PoP Packaging
2.5D Interposer Manffacturing Revenue
Breakdown by Interposer Bulk Material, 2010-2017
Downstream Application of TSV
TSV Equipment Suppliers
Distribution of TSV Packaging Equipment, 2012-2017E
Revenue of Major IC Substrate Vendors, 2010-2014
Unimicron’s Organizational Structure
Unimicron’s Revenue and Gross Margin, 2003-2014
Unimicron’s Revenue and Operating Margin, 2009-2014
Unimicron’s Revenue and Gross Margin, Q1 2012-Q4 2014
Unimicron’s Sales Breakdown by Technology, 2010-2014
Unimicron’s Sales Breakdown by Application, 2010-2014
Unimicron’s Capacity, 2010-2014
Unimicron’s CAPEX, 2004-2013
Unimicron’s M & A
IBIDEN’s Revenue and Operating Margin, FY2006-FY2015
IBIDEN’s Revenue Breakdown by Business, FY2006-FY2015
IBIDEN’s Revenue Breakdown by Business, Q2 2012-Q2 2014
IBIDEN’s Operating Income by Business, Q2 2012-Q2 2014
Ibiden Electronics’ Revenue Breakdown by Product, FY2010-FY2015
IBIDEN’s CAPEX and Depreciation, FY2010-FY2015
Daeduck Electronics’ Revenue and Operating Margin, 2005-2014
Daeduck Electronics’ Revenue by Business, 2009-2014
Daeduck GDS’ Revenue and Operating Margin, 2005-2014
Daeduck GDS’ Revenue Breakdown by Business, 2010-2014
SIMMTECH’s Organizational Structure
SIMMTECH’s Revenue and Operating Margin, 2004-2014
SIMMTECH’s Revenue, Gross Margin and Net Profit Margin, 2009-2014
SIMMTECH’s Balance Sheet, 2009-2013
SIMMTECH’s Revenue Breakdown by Product, 2013-2015
SIMMTECH’s Gross Margin and Operating Margin, Q1 2013-Q4 2014
SIMMTECH’s Shipments, Q1 2013-Q4 2014
SIMMTECH’s Shipments, 2012-2015E
SIMMTECH’s Capacity Utilization, Q1 2013-Q4 2014
SIMMTECH’s Capacity Utilization, 2012-2015E
SIMMTECH’s Revenue by Application, 2008-2014
SIMMTECH’s Substrate Revenue by Application, 2012-2014
SIMMTECH’s Plants
LG INNOTEK’s Revenue and Operating Margin, 2006-2015E
LG INNOTEK’s Revenue and Operating Margin, Q1 2012-Q4 2014
LG INNOTEK’s Revenue Breakdown by Business, 2011-2015E
LG INNOTEK’s Operating Income by Business, 2011-2015E
SEMCO’s Revenue and Operating Margin, 2009-2014
SEMCO’s Revenue Breakdown by Department, 2010-2014
Revenue and Operating Margin of SEMCO’s ACI Segment, Q1 2013-Q4 2014
SEMCO’s HDI and PKG Revenue, Q1-Q4 2014
Nan Ya PCB’s Organizational Structure
Nan Ya PCB’s Revenue and Gross Margin, 2006-2014
Nan Ya PCB’s Revenue and Operating Margin, 2009-2015E
Nan Ya PCB’s Revenue and Growth Rate, Jan 2013-Jan 2015
Nan Ya PCB’s Capacity and Global Distribution
KINSUS’ Revenue and Gross Margin, 2004-2014
KINSUS’ Revenue and Operating Margin, 2009-2015E
KINSUS’ Revenue and Growth Rate, Jan 2013-Jan 2015
KINSUS’ Revenue Breakdown by Product, 2011-2014
KINSUS’ Revenue Breakdown by Application, 2011
KINSUS’ Revenue by Application, Q1 2014
KINSUS’ Revenue by Application, Q4 2014
Customer Distribution of KINSUS, 2013\2014
SHINKO’s Revenue and Net Income, FY2007-FY2015
SHINKO’s Revenue Breakdown by Business, FY2010-FY2015
AT&S and EBITDA Margin, FY2005-FY2015
Chongqing Substrate Plant Ramp of AT&S
AT&S’ Revenue Breakdown by Business/Region, FY2014
AT&S’ Revenue Breakdown by Business/Region, FY2015
Revenue of AT&S’ Mobile Devices & Substrates Business, Q2/13-Q4/14
Main Customers of AT&S’ Mobile Devices & Substrates Business
Revenue of AT&S’ Industrial & Automotive Business, Q2/13-Q4/14
Main Customers of AT&S’ Industrial & Automotive Business
AT&S’ Employees, 2010-2015
AT&S’ CAPEX, 2010-2015E
Financial Data of ACCESS, 2012-2013
Major Clients of ACCESS, 2011-2013
Revenue of Packaging Substrate of ACCESS, 2011-2013
Major Equipment of ACCESS
ASE’s Organizational Structure
ASE’s Revenue and Gross Margin, 2005-2015E
ASE’s Revenue and Operating Margin, 2009-2015E
ASE’s Revenue, Jan 2013-Jan 2015
ASE’s Revenue Breakdown by Business, 2010-2014
Revenue and Gross Margin of ASE’s Packaging Division, Q1 2013-Q4 2014
Revenue Breakdown of ASE’s Packaging Division by Type, Q1 2013-Q4 2014
Revenue and Gross Margin of ASE’s Materials Division, Q1 2013-Q4 2014
Revenue Breakdown of ASE’s IC Business by Application, Q1 2013-Q4 2014
ASE’s EMS Revenue and Gross Margin, Q1 2013-Q4 2014
ASE’s EMS Revenue Breakdown, Q1 2013-Q4 2014
Amkor’s Revenue, Gross Margin and Operating Margin, 2005-2014
Amkor’s Revenue Breakdown by Packaging Type, 2007-2014
Amkor’s Packaged Units, 2012-2014
Amkor’s Revenue Breakdown by Application, 2012-2014
SPIL’s Organizational Structure
SPIL’s Revenue, Gross Margin and Operating Margin, 2003-2014
SPIL’s Revenue, Jan 2013-Jan 2015
SPIL’s Revenue, Gross Margin and Operating Margin, Q4 2012-Q4 2014
SPIL’s Revenue Breakdown by Region, 2005-2014
SPIL’s Revenue Breakdown by Application, 2005-2014
SPIL’s Revenue Breakdown by Business, 2005-2014
SPIL’s Capacity, 2006-2014
STATS ChipPAC’s Revenue and Gross Margin, 2004-2014
STATS ChipPAC’s Balance Sheet, 2014
STATS ChipPAC’s Revenue Breakdown by Packaging Type, 2006-2013
STATS ChipPAC’s Revenue Breakdown by Application, 2006-2013
STATS ChipPAC’s Revenue Breakdown by Region, 2006-2013
Global Distribution of STATS ChipPAC
STATS ChipPAC’s Revenue Breakdown by Region/Business, 2014
Mitsubishi Gas Chemical’s Organization Chart
MGC’s Revenue and Operating Income, FY2009-FY2015
MGC’s Revenue by Segment, FY2009-FY2015
MGC’s Operating Income by Segment, FY2009-FY2015
CAPEX and Depreciation of MGC’s Information and Advanced Material Division, FY2009-FY2015
ABF Application
ABF Manufacturing Process
ABF Construction
Outline of Manufacturing Substrate Using ABF
Next Build-up Material in Demand
如果这份报告不能满足您的要求,我们还可以为您定制报告,请 留言说明您的详细需求。
|