|
|
|
报告导航:研究报告—
TMT产业—电子半导体
|
|
2014-2015年全球及中国柔性线路板FPCB行业研究报告 |
 |
字数:2.7万 |
页数:155 |
图表数:182 |
|
中文电子版:8500元 |
中文纸版:4250元 |
中文(电子+纸)版:9000元 |
|
英文电子版:2400美元 |
英文纸版:2600美元 |
英文(电子+纸)版:2700美元 |
|
编号:ZYW199
|
发布日期:2015-03 |
附件:下载 |
 |
|
|
《2014-2015年全球及中国FPCB行业研究报告》包含以下内容:
1、FPCB产业分析
2、FPCB下游市场分析
3、FPCB厂家横向对比
4、22家典型FPCB厂家研究,9家FPCB上游厂家研究
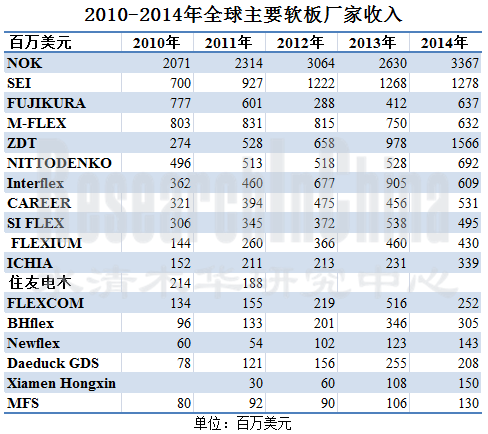
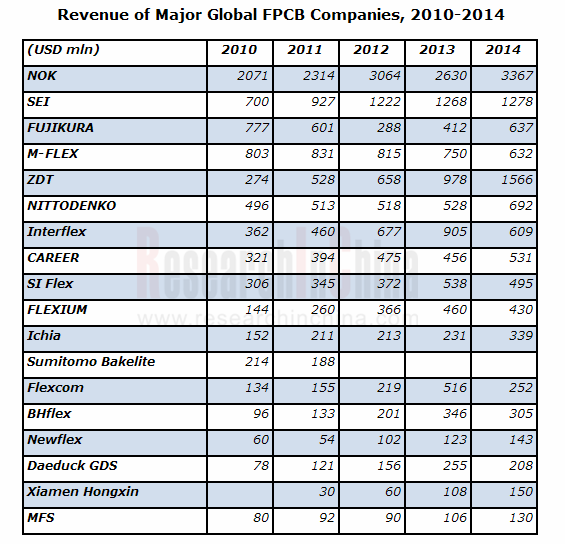
2014年对大部分FPCB厂家来说都是美好的一年,整个PCB产业产值达到125亿美元,比2013年增长10.5%,展望2015年,大宗商品暴跌,尤其铜价大跌,将大大降低PCB厂家的原材料成本,PCB厂家的利润率有望继续提高。手机屏幕变大也意味着需要使用更大面积的软板,2015年市场前景看好,但毕竟智能手机已经无法继续高速增长,而平板电脑陷入衰退,预计2015年FPCB市场增幅为8.6%。
2014年关键的PCB地区,欧元、台币和日元都显著贬值,而韩元反而升值,这不仅严重打击了韩国FPCB企业的竞争力,也让韩国PCB企业面临利润下滑。韩国PCB企业无一例外收入和利润率全面下滑,例如FLEXCOM收入大幅度下滑超过50%,龙头厂家Interflex大幅度下滑33%,营业利润率则为负14.2%,足见货币战争威力。
台湾企业和欧洲企业则受益于货币贬值,利润率大增。日本企业由于一半以上的生产基地都位于海外,因此并未从日元贬值中获得收益,但还是比韩国企业要好不少。
2014年下游市场最大变化是HDD在连续3年衰退后第一次实现增长,2014年全球HDD出货量达5.64亿部,比2013年增长2.4%。之前业内人士没有看好HDD市场前景的,大家都看好SSD,但SSD价格居高不下,并且平板电脑衰退,笔记本电脑在连续3年衰退后第一次增长。同时HDD并未因为SSD发展而萎缩,网络新经济、大数据时代的到来刺激了服务器的需求,也刺激了HDD的需求。HDD 3-5年内仍然是主流,预计2019年HDD出货量达6.21亿台。专注HDD用FPCB的日本厂家在2014年表现尤其优秀,龙头大厂NOK(Mektron)收入大增28%,营业利润率则从负10.6%转为正的8.7%。Nitto收入则大增31%。
韩国企业和美国企业竞争力明显衰退,强势美元让MFLEX收入大幅度下滑。台币贬值,让台湾企业高速增长,同时苹果也按照就近供应原则,大幅度减少对韩国企业的采购,增加对日本和台湾企业的采购,富士康旗下的ZDT在2014年收入增幅高达60%。
Global and China FPCB Industry Report, 2014-2015 involves the following:
1. Analysis on the FPCB Industry
2. Analysis on the FPCB Downstream Market
3. Comparison between FPCB Companies
4. Research on 22 Typical FPCB Companies and 9 FPCB Upstream Companies
2014 was a bumper year for most FPCB companies, and the output value of the entire PCB industry reached USD12.5 billion, rising by 10.5% from the previous year. In 2015, the prices of bulk commodities (particularly the copper price) plummet, which will greatly reduce the raw material costs of PCB companies and help raise their profitability. Larger screen size of mobile phone requires larger FPCB. The FPCB market is expected to grow 8.6% in 2015 as the smartphone market can not continue its rapid growth and the tablet PC is in recession.
In 2014, the euro, the NTD and the yen significantly devalued, while the South Korean won appreciated, which not only hit a serious blow to the competitiveness of South Korean FPCB enterprises, but minified the profit of South Korean PCB enterprises. The revenue and profit margin of all South Korean PCB companies declined, for example, Flexcom’s revenue slumped by more than 50%, the giant Interflex’s revenue dropped 33% and its operating margin turned to be the negative 14.2%, which showed the power of the currency war.
Benefiting from the currency depreciation, Taiwanese and European companies witnessed soaring profit margins. More than half of Japanese companies did not benefit from the depreciation of the yen because they set up production bases overseas, but still better than South Korean companies.
In the downstream market, the biggest change in 2014 lied in: HDD saw the first growth after three consecutive years of decline. The global HDD shipment amounted to 564 million units, an increase of 2.4% from 2013. Previously, insiders were optimistic about the prospect of SSD instead of HDD; but actually, the SSD price remained high, the tablet PC market decayed, while the laptop computer market recovered to growth after three consecutive years of downturn. At the same time, the development of SSD did not restrict HDD; the new network economy and the big data era stimulated the demand for servers and HDD. HDD will still be the mainstream in the next three to five years, and the HDD shipment is expected to reach 621 million units in 2019. Japanese companies focusing on HDD-use FPCB performed exceedingly well in 2014, for example, the leader NOK (Mektron) achieved the revenue growth rate of 28% and the operating margin of 8.7% (rising from the negative 10.6%), Nitto’s revenue surged by 31%.
The competitiveness of South Korean and American companies weakened significantly. The strong USD made MFLEX’s revenue fall dramatically. The depreciation of NTD facilitated Taiwanese companies to grow by leaps and bounds; meanwhile, Apple greatly reduced orders from South Korean companies, while placed more orders with Japanese and Taiwanese companies in accordance with the principle of the nearest supply. The revenue of ZDT under Foxconn soared 60% in 2014.
第一章 软板简介
1.1、软板简介
1.2、单面板
1.3、双面板、单铜双做、单+单、多层板
1.4、软板制造流程
第二章 FPCB市场
2.1、FPCB市场规模
2.2、HDD市场
2.3、HDD产业
2.4、全球手机市场
2.5、全球智能手机市场与产业
2.6、中国手机市场概况
2.7、笔记本电脑市场
2.8、平板电脑市场
2.9、触控屏产业链
2.10、触控屏产业规模
2.11、触控屏发展趋势
2.12、TFT-LCD产业近况
2.13、TFT-LCD产业排名
第三章 软板产业
3.1、软板产业链
3.2、FPCB厂家业务模式
3.3、FPCB产业地域分布
3.4、FPCB客户供应关系
3.5、手机软板供应关系
3.6、FPCB厂家排名
第四章 FPCB厂家研究
4.1、FUJIKURA(藤仓)
4.1.1、藤仓电子(上海)有限公司
4.1.2、藤仓电子(无锡)有限公司
4.2、旗胜
4.2.1、珠海紫翔电子科技有限公司
4.2.2、 苏州紫翔电子科技有限公司
4.3、日东电工
4.4、索尼凯美高
4.5、M-FLEX
4.6、台郡科技
4.7、嘉联益
4.8、旭软
4.9、安捷利
4.10、厦门弘信电子科技
4.11、PARLEX
4.12、SI FLEX
4.13、住友电工
4.14、DAEDUCK GDS
4.15、INTERFLEX
4.16、深圳市精诚达电路科技
4.17、范桓
4.18、NEWFLEX
4.19、FLEXCOM
4.20、MFS
4.21、毅嘉
4.22、臻鼎
第五章 FCCL厂家
5.1、宏仁电子
5.2、台虹科技
5.3、新扬科技
5.4、新日本制铁化学
5.5、有泽制造所
5.6、律胜科技
5.7、亚洲电材
5.8、达迈科技
5.9、INNOX
1 Overview of FPCB
1.1 Profile
1.2 Single-sided FPCB
1.3 Double-sided FPCB, “Single-sided FPCB + Single-sided FPCB” and Multilayer FPCB
1.4 FPCB Manufacturing Process
2 FPCB Market
2.1 FPCB Market Size
2.2 HDD Market
2.3 HDD Industry
2.4 Global Mobile Phone Market
2.5 Global Smartphone Market and Industry
2.6 Overview of Chinese Mobile Phone Market
2.7 Laptop Computer Market
2.8 Tablet PC Market
2.9 Touch Screen Industry Chain
2.10 Touch Screen Industrial Scale
2.11 Touch Screen Development Trend
2.12 Recent Developments of TFT-LCD Industry
2.13 Ranking of TFT-LCD Industry
3 FPCB Industry
3.1 FPCB Industry Chain
3.2 Business Models of FPCB Companies
3.3 Geographical Distribution of FPCB Industry
3.4 FPCB Supply
3.5 Mobile Phone FPCB Supply
3.6 Ranking of FPCB Companies
4 FPCB Companies
4.1 Fujikura
4.1.1 Fujikura Electronics Shanghai
4.1.2 Fujikura Electronics Wuxi
4.2 Nippon Mektron
4.2.1 Mektec Manufacturing Corporation (Zhuhai)
4.2.2 Mektec Manufacturing Corporation (Suzhou)
4.3 Nitto Denko
4.4 Sony Chemical
4.5 M-Flex
4.6 Flexium
4.7 Career
4.8 Sunflex
4.9 AKM
4.10 Xiamen Hongxin Electron-Tech Co, Ltd.
4.11 Parlex
4.12 SI Flex
4.13 Sumitomo Electric Industries
4.14 Daeduck GDS
4.15 Interflex
4.16 Shenzhen JCD Circuit Technology Co., Ltd.
4.17 BHflex
4.18 Newflex
4.19 Flexcom
4.20 MFS
4.21 Ichia
4.22 ZDT
5. FCCL Companies
5.1 Grace Electron
5.2 Taiflex
5.3 ThinFlex
5.4 Nippon Steel Chemical
5.5 Arisawa
5.6 Microcosm
5.7 AEM
5.8 Taimide
5.9 INNOX
FPC单面板结构
双面板结构
单铜双做结构
单+单结构图
双层板结构图
COF构装图
软硬板示意图
软板制造流程
曝光机工作概念
显像冲洗
蚀刻冲洗
剥膜
热压和
2007-2015年FPCB市场规模
2013\2017年FPCB市场下游分布
2012年4季度-2014年4季度每季度HDD出货量
2009-2015年HDD出货量
2014年全球HDD主要厂家市场占有率
2010-2019年全球HDD出货量下游分布
2007-2015年全球手机出货量
2011-2014年全球3G/4G手机出货量地域分布
Worldwide Mobile Phone Sales to End Users by Vendor in 2013 (Thousands of Units)
2014年3季度全球十大手机厂家出货量
Worldwide Smartphone Sales to End Users by Vendor in 2013 (Thousands of Units)
Worldwide Smartphone Sales to End Users by Operating System in 2013 (Thousands of Units)
2013-2015年全球Top 13智能手机厂家出货量
2014年3季度主要智能手机厂家出货量
2013年1月-2014年12月中国手机市场月度出货量
2014年中国智能手机市场主要厂家市场占有率
2014年中国4G手机市场主要厂家市场占有率
2008-2015年笔记本电脑出货量
2010-2014年全球主要笔记本电脑ODM厂家出货量
2011-2016年全球平板电脑出货量
Top Five Tablet Vendors, Shipments Fourth Quarter 2014
Top Five Tablet Vendors, Shipments, Market Share, and Growth, Calendar Year 2014
触控屏产业链
Touch Industry Supply Chain and Eco-system
2010-2016年全球触控屏市场规模
2010-2016年全球触控屏市场规模(出货量)
2013-2017年全球智能手机触控技术发展趋势
2011-2015年中尺寸触控屏技术分布
2012-2016年笔记本电脑触控屏出货量技术分布
Dec/2013-Dec/2014 Monthly Total TFT LCD Revenues and Growth
Dec/2013-Dec/2014 Monthly LCD-TV Panel Units Shipments and Growth
Dec/2013-Dec/2014 Monthly Monitor Panel Units Shipments and Growth
Dec/2013-Dec/2014 Monthly Notebook PC Panel Units Shipments and Growth
2014年2季度全球主要TFT-LCD大尺寸面板出货量市场占有率
2002-2013年全球主要TFT-LCD大尺寸面板厂家营业利润率
2012-2014年全球主要TFT-LCD面板厂家收入排名
2012-2014年全球主要TFT-LCD面板厂家营业利润率
台湾软板产业链
2009-2013年全球FPCB产业收入地域分布
2010-2011年全球FPCB产业收入地域分布
2011-2013三星集团软板主要供应商供应比例(金额)
2013年LG 软板主要供应商供应比例(金额)
2011-2014苹果集团软板主要供应商供应比例(金额)
2009-2014年日本FPC厂家收入排名
2012-2014年韩国FPC厂家收入排名
2009-2014年韩国FPC厂家营业利润率排名
2009-2014年台湾FPC厂家收入排名
2009-2014年台湾FPC厂家营业利润率排名
2010-2014年全球主要软板厂家收入排名
藤仓泰国基地一览
FY2006-FY2015藤仓收入与运营利润统计
2008-2013财年藤仓收入部门分布
FY2013-FY2015 Fujikura收入产品分布
FY2008-FY2015 FUJIKURA FPC SEGMENT REVENUE
FY2013-FY2015 Fujikura营业利润业务分布
Mektron组织结构
2006-2015财年NOK收入与运营利润
2006-2015财年NOK收入产品分布
2013-2015财年NOK营业利润产品分布
2010-2014财年NOK收入地域分布
2010-2014财年MEKTRON FPC事业部收入地域分布
Mektron全球分布
2004-2014年珠海紫翔电子科技有限公司收入与运营利润
FY2006-FY2015日东电工收入与运营利润率
FY2013-FY2015 日东电工收入业务分布
FY2013-FY2015 日东电工运营利润业务分布
FY2004-FY2015 M-FLEX收入与运营利润
FY2010-FY2014 M-FLEX收入地域分布
FY2012-2014 M-FELX收入国别结构
2006-2013财年M-FELX运营利润地域分布
2006-2008财年M-FLEX 索爱和摩托罗拉占收入比例
FY2006-FY2013 M-FLEX客户结构比例
2011年1季度-2014年4季度MFLEX收入下游分布
2005-2015年台郡收入与毛利率
2005-2015年台郡收入与运营利润率
2013年1月-2015年1月台郡月度收入与年增率
2009-201年台郡收入下游应用分布
2013-2014 台郡收入下游应用分布
2009-2013年台郡FPC层数分布
2014年4季度台郡资产负债表
2014年4季度台郡现金流
台郡软板工程能力
嘉联益关联公司关系
嘉联益组织结构
嘉联益各部门介绍
2003-2015年嘉联益收入与运营利润率
2013年1月-2015年1月嘉联益收入与年增率
2014年3季度嘉联益资产负债表
2014年嘉联益收入客户分布
嘉联益各项产品产能
嘉联益各工厂主要业务
2013年嘉联益大陆三子公司财务数据
2009-2015年旭软收入与营业利润率
2013年1月-2015年1月旭软每月收入与增幅
旭软各部门简介
2006-2014年安捷利实业收入与毛利率
2006-2014年安捷利实业收入与运营利润
2009-2013年安捷利实业收入业务分布
安捷利主要客户
安捷利FPC技术能力
2011-2014年厦门弘信电子科技股份有限公司财务指标
2011-2014年厦门弘信电子产能与产量
2011-2014年厦门弘信电子销量与ASP
2013\2014年厦门弘信电子客户分布
2007-2014年SI FLEX收入与运营利润
SI FLEX组织结构
FY2008-FY2015住友电工收入与运营利润率
FY2011-FY2015 SEI收入业务分布
FY2011-FY2015 SEI营业利润业务分布
FY2008-FY2015住友电工FPC部门收入
2005-2014年大德GDS收入与运营利润率
2010-2014年大德GDS收入业务分布
2005-2015年Interflex收入与运营利润率
2012年1季度-2015年4季度Interflex季度收入与营业利润率
2009年1季度-2014年4季度Interflex收入产品分布
2010-2015年Interflex收入客户分布
2009-2012年Interflex产能
深圳市精诚达电路组织结构
2005-2015年 BHflex收入与运营利润
范桓株式会社组织结构
2013-2015 BHflex收入下游分布
2009-2012年BHflex收入客户分布
2013年BHflex收入客户分布
2005-2015年Newflex收入与运营利润
2006-2015年FLEXCOM收入与运营利润率
2011年FLEXCOM收入客户分布
2006-2014年MFS收入与股东应得利润
2008-2013年MFS收入地域分布
毅嘉组织结构
2006-2015年毅嘉收入与运营利润率
2013年1月-2015年1月毅嘉月度收入
2013年1季度-2014年3季度毅嘉收入业务分布
2013年1季度-2014年3季度毅嘉季度毛利率
2014年毅嘉收入下游分布
ZDT Holding Structure
2008-2015年臻鼎收入与运营利润率
2008-2014年臻鼎收入与毛利率
2013年1月-2015年1月ZDT月度收入
ZDT Global Footprint
2006-2014 ZDT Number of Employees
2013年臻鼎大陆子公司财务报表
2002-2014年台虹收入与运营利润率
2013年1月-2015年1月台虹科技月度收入与年增率
2008-2014年台虹科技收入业务分布
2009-2012年台虹FCCL产品收入结构
2011-2014年台虹资产负债表
2011-2014年台虹现金流
2009-2015年新扬科技收入与营业利润率
2013年1月-2015年1月新扬科技收入与年增率
2008-2015财年新日本制铁化学收入与运营利润
2006-2015财年新日本制铁化学收入产品分布
2006-2015财年有泽制造所收入与运营利润率
2006-2015财年有泽制造所收入产品分布
2003-2014年律胜科技收入与运营利润率
2013年1月-2015年1月律胜科技收入与年增率
2007-2014年亚洲电材收入与运营利润率
2013年1月-2015年1月亚洲电材月度收入与增幅
亚洲电材组织结构
2011年亚洲电材收入产品分布
2005-2015年达迈科技收入与运营利润率
2013年1月-2015年1月达迈科技每月收入与增幅
2011年全球主要PI厂家市场占有率
2005-2015年INNOX收入与运营利润率
2011-2013年INNOX收入产品分布
INNOX 2014年收入客户分布
Structure of Single-sided FPCB
Structure of Double-sided FPCB
Block Diagram of “Single-sided FPCB + Single-sided FPCB”
Block Diagram of Double-sided FPCB
Block Diagram of COF
Schematic Diagram of Rigid and Flex PCB
FPCB Manufacturing Process
Work Concept of Exposure Machine
Imaging
Etching
Film Stripping
Hot Pressing
FPCB Market Size, 2007-2015
FPCB Market by Application, 2013-2017E
Quarterly HDD Shipment, Q4 2012-Q4 2014
HDD Shipment, 2009-2015
Market Share of Global Major HDD Companies, 2014
Global HDD Shipment by Application, 2010-2019E
Global Mobile Phone Shipment, 2007-2015
Global 3G / 4G Mobile Phone Shipment by Region, 2011-2014
Worldwide Mobile Phone Sales to End Users by Vendor in 2013
Shipment of Global Top 10 Mobile Phone Companies, Q3 2014
Worldwide Smartphone Sales to End Users by Vendor in 2013
Worldwide Smartphone Sales to End Users by Operating System in 2013
Shipment of Global Top 13 Smartphone Companies, 2013-2015
Shipment of Major Smartphone Companies, Q3 2014
Monthly Shipment of Chinese Mobile Phone Market, Jan 2013-Dec 2014
Market Share of Major Companies in Chinese Smartphone Market, 2014
Market Share of Major Companies in Chinese 4G Mobile Phone Market, 2014
Laptop Computer Shipment, 2008-2015
Shipment of Global Major Laptop Computer ODM Companies, 2010-2014
Global Tablet PC Shipment, 2011-2016E
Shipment of Top Five Tablet PC Vendors, Q4 2014
Shipment, Market Share and Growth of Top Five Tablet PC Vendors, 2014
Touch Screen Industry Chain
Touch Industry Supply Chain and Eco-system
Global Touch Screen Market Size, 2010-2016E
Global Touch Screen Market Size (Shipment), 2010-2016E
Development Trends of Global Smartphone Touch Technology, 2013-2017E
Medium-sized Touch Screen by Technology, 2011-2015
Laptop Touch Screen Shipment by Technology, 2012-2016E
Monthly Total TFT LCD Revenues and Growth, Dec 2013-Dec 2014
Monthly LCD-TV Panel Units Shipments and Growth, Dec 2013-Dec 2014
Monthly Monitor Panel Units Shipments and Growth, Dec 2013-Dec 2014
Monthly Notebook PC Panel Units Shipments and Growth, Dec 2013-Dec 2014
Market Share of Global Major Large-sized TFT-LCD Panel Companies by Shipment, Q2 2014
Operating Margin of Global Major Large-sized TFT-LCD Panel Companies, 2002-2013
Ranking of Global Major TFT-LCD Panel Companies by Revenue, 2012-2014
Operating Margin of Global Major TFT-LCD Panel Companies, 2012-2014
Taiwan's FPCB Industry Chain
Revenue of Global FPCB Industry by Region, 2009-2013
Revenue of Global FPCB Industry by Region, 2010-2011
Major FPCB Suppliers of Samsung by Value, 2011-2013
Major FPCB Suppliers of LG by Value, 2013
Major FPCB Suppliers of Apple by Value, 2011-2014
Ranking of Japanese FPC Companies by Revenue, 2009-2014
Ranking of South Korean FPC Companies by Revenue, 2012-2014
Ranking of South Korean FPC Companies by Operating Margin, 2009-2014
Ranking of Taiwanese FPC Companies by Revenue, 2009-2014
Ranking of Taiwanese FPC Companies by Operating Margin, 2009-2014
Ranking of Major Global FPCB Companies by Revenue, 2010-2014
Bases of Fujikura in Thailand
Revenue and Operating Profit of Fujikura, FY2006-FY2015
Revenue of Fujikura by Division, FY2008-FY2013
Revenue of Fujikura by Product, FY2013-FY2015
Revenue of Fujikura's FPC Segment, FY2008-FY2015
Operating Profit of Fujikura by Business, FY2013-FY2015
Organizational Structure of Mektron
Revenue and Operating Profit of NOK, FY2006-FY2015
Revenue of NOK by Product, FY2006-FY2015
Operating Profit of NOK by Product, FY2013-FY2015
Revenue of NOK by Region, FY2010-FY2014
Revenue of Mektron's FPC Division by Region, FY2010-FY2014
Global Presence of Mektron
Revenue and Operating Profit of Mektec Manufacturing Corporation (Zhuhai), 2004-2014
Revenue and Operating Margin of Nitto Denko, FY2006-FY2015
Revenue of Nitto Denko by Business, FY2013-FY2015
Operating Profit of Nitto Denko by Business, FY2013-FY2015
Revenue and Operating Profit of M-Flex, FY2004-FY2015
Revenue of M-Flex by Region, FY2010-FY2014
Revenue of M-Flex by Country, FY2012-FY2014
Operating Profit of M-Flex by Region, FY2006-FY2013
Percent of Sony Ericsson and Motorola in M-Flex’s Revenue, FY2006-FY2008
Customer Structure of M-Flex, FY2006-FY2013
Revenue of M-Flex by Application, Q1 2011-Q4 2014
Revenue and Gross Margin of Flexium, 2005-2015
Revenue and Operating Margin of Flexium, 2005-2015
Monthly Revenue and Annual Growth Rate of Flexium, Jan 2013-Jan 2015
Revenue of Flexium by Application, 2009-2012
Revenue of Flexium by Application, 2013-2014
FPC Layers of Flexium, 2009-2013
Balance Sheet of Flexium, Q4 2014
Cash Flow of Flexium, Q4 2014
FPCB Engineering Capacity of Flexium
Associated Companies of Career
Organizational Structure of Career
Divisions of Career
Revenue and Operating Margin of Career, 2003-2015
Revenue and Annual Growth Rate of Career, Jan 2013-Jan 2015
Balance Sheet of Career, Q3 2014
Revenue of Career by Client, 2014
Capacity of Career by Product
Major Business of Career by Plant
Financial Data of Three Mainland Chinese Subsidiaries of Career, 2013
Revenue and Operating Margin of Sunflex, 2009-2015
Monthly Revenue and Growth Rate of Sunflex, Jan 2013-Jan 2015
Divisions of Sunflex
Revenue and Gross Margin of AKM, 2006-2014
Revenue and Operating Profit of AKM, 2006-2014
Revenue of AKM by Business, 2009-2013
Major Clients of AKM
FPC Technical Capacity of AKM
Financial Indicators of Xiamen Hongxin Electron-Tech, 2011-2014
Capacity and Output of Xiamen Hongxin Electron-Tech, 2011-2014
Sales Volume and ASP of Xiamen Hongxin Electron-Tech, 2011-2014
Client Distribution of Xiamen Hongxin Electron-Tech, 2013-2014
Revenue and Operating Profit of SI Flex, 2007-2014
Organizational Structure of SI Flex
Revenue and Operating Margin of Sumitomo Electric Industries, FY2008-FY2015
Revenue of Sumitomo Electric Industries by Business, FY2011-FY2015
Operating Profit of Sumitomo Electric Industries by Business, FY2011-FY2015
Revenue of FPC Division of Sumitomo Electric Industries, FY2008-FY2015
Revenue and Operating Margin of Daeduck GDS, 2005-2014
Revenue of Daeduck GDS by Business, 2010-2014
Revenue and Operating Margin of Interflex, 2005-2015
Quarterly Revenue and Operating Margin of Interflex, Q1 2012-Q4 2015
Revenue of Interflex by Product, Q1 2009-Q4 2014
Revenue of Interflex by Customer, 2010-2015
Capacity of Interflex, 2009-2012
Organizational Structure of Shenzhen JCD Circuit Technology
Revenue and Operating Profit of BHflex, 2005-2015
Organizational Structure of BHflex
Revenue of BHflex by Application, 2013-2015
Revenue of BHflex by Client, 2009-2012
Revenue of BHflex by Client, 2013
Revenue and Operating Profit of Newflex, 2005-2015
Revenue and Operating Margin of Flexcom, 2006-2015
Revenue of Flexcom by Client, 2011
Revenue and Profit Attributable to Shareholders of MFS, 2006-2014
Revenue of MFS by Region, 2008-2013
Organizational Structure of Ichia
Revenue and Operating Margin of Ichia, 2006-2015
Monthly Revenue of Ichia, Jan 2013-Jan 2015
Revenue of Ichia by Business, Q1 2013-Q3 2014
Quarterly Gross Margin of Ichia, Q1 2013-Q3 2014
Revenue of Ichia by Application, 2014
Holding Structure of ZDT
Revenue and Operating Margin of ZDT, 2008-2015
Revenue and Gross Margin of ZDT, 2008-2014
Monthly Revenue of ZDT, Jan 2013-Jan 2015
Global Footprint of ZDT
Number of Employees of ZDT, 2006-2014
Financial Statements of ZDT's Subsidiaries in Mainland China, 2013
Revenue and Operating Margin of Taiflex, 2002-2014
Monthly Revenue and Annual Growth Rate of Taiflex, Jan 2013-Jan 2015
Revenue of Taiflex by Business, 2008-2014
FCCL Product Revenue Structure of Taiflex, 2009-2012
Balance Sheet of Taiflex, 2011-2014
Cash Flow of Taiflex, 2011-2014
Revenue and Operating Margin of ThinFlex, 2009-2015
Revenue and Annual Growth Rate of ThinFlex, Jan 2013-Jan 2015
Revenue and Operating Profit of Nippon Steel Chemical, FY2008-FY2015
Revenue Structure of Nippon Steel Chemical by Product, FY2006-FY2015
Revenue and Operating Margin of Arisawa, FY2006-FY2015
Revenue of Arisawa by Product, FY2006-FY2015
Revenue and Operating Margin of Microcosm, 2003-2014
Revenue and Annual Growth Rate of Microcosm, Jan 2013-Jan 2015
Revenue and Operating Margin of AEM, 2007-2014
Monthly Revenue and Growth Rate of AEM, Jan 2013-Jan 2015
Organizational Structure of AEM
Revenue of AEM by Product, 2011
Revenue and Operating Margin of Taimide, 2005-2015
Monthly Revenue and Growth Rate of Taimide, Jan 2013-Jan 2015
Market Share of Global Major PI Companies, 2011
Revenue and Operating Margin of INNOX, 2005-2015
Revenue of INNOX by Product, 2011-2013
Revenue of INNOX by Client, 2014
如果这份报告不能满足您的要求,我们还可以为您定制报告,请 留言说明您的详细需求。
|